


Report Overview
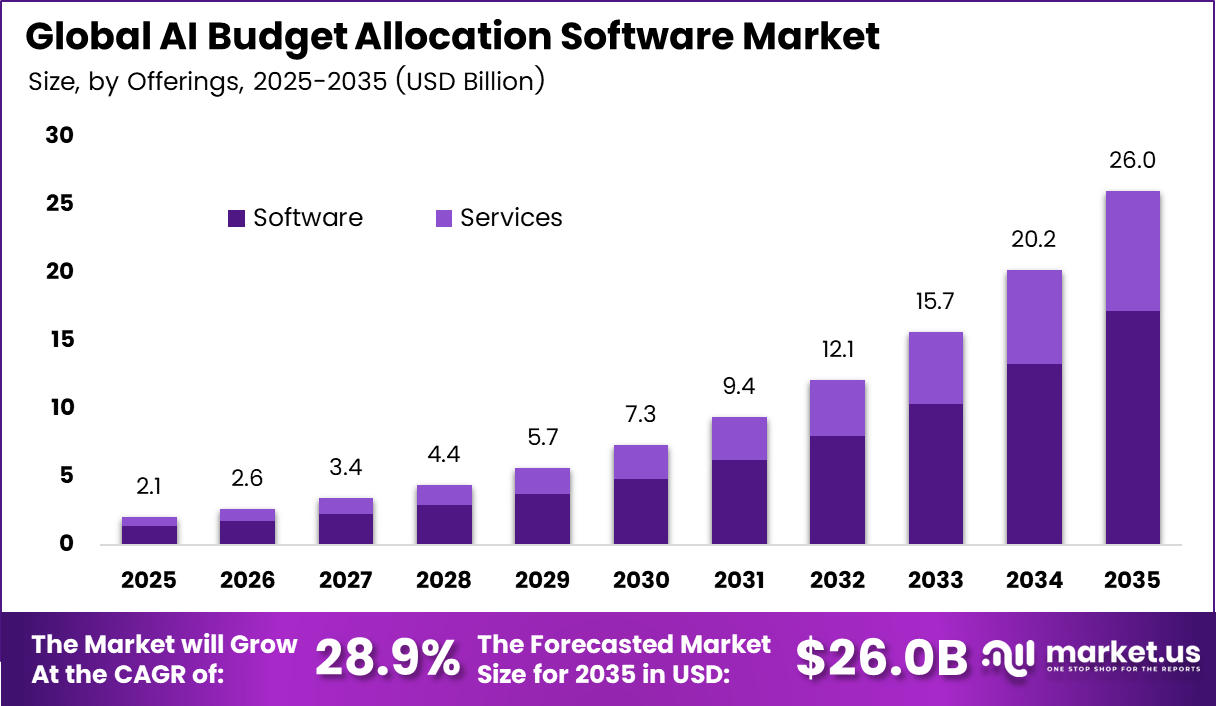
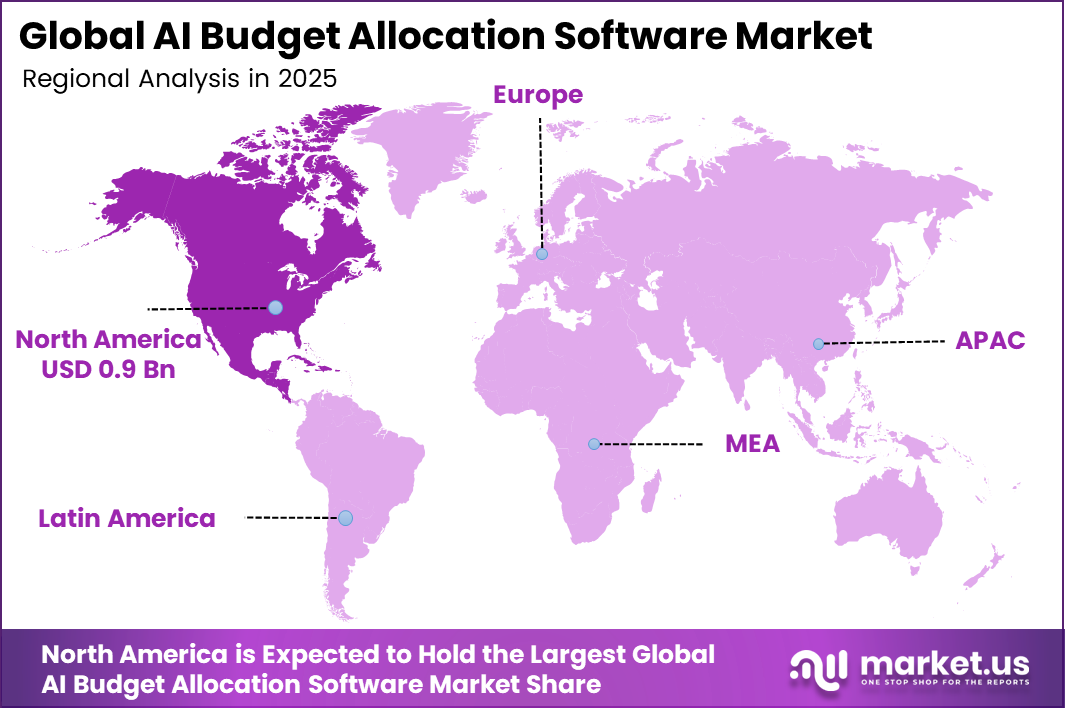
In 2025, the Global AI Budget Allocation Software Market was valued at USD 2.1 billion. The market is projected to grow at a CAGR of 28.9% during 2026–2035, reaching approximately USD 26.0 billion by 2035. North America dominated the global market in 2025, accounting for more than 41.2% of the total market share and generating approximately USD 0.9 billion in revenue.
Fast AI spending across industries drives this growth. The WTO reported that global spending on AI infrastructure should rise by at least 30% in 2026. Trade in AI goods such as chips and servers jumped 67% year on year in the first half of 2026. That trade made up 47% of global goods trade growth. Firms building this AI capacity need better tools to plan and allocate budgets. The WTO also expects world GDP to grow 2.6% in 2026 and 2.9% in 2027.
North America has the most mature base of business AI users. The U.S. Census Bureau found that 33.9% of finance and insurance firms used AI as of May 2026. The national rate stood at 19.8%. Large firms lead adoption, with 37% of businesses with 250 or more workers using AI.
These large firms run complex budgets across many units. They form the core buyer group for AI budget tools. The Census Bureau also found that between 20% and 23% of U.S. firms expect to use AI within six months. This pipeline of new users supports strong regional demand through the forecast period.
Key Takeaways
- The Global AI Budget Allocation Software Market was valued at USD 2.1 billion in 2025 and should reach USD 26.0 billion by 2035. grow at a CAGR of 28.9% from 2026 to 2035.
- By offerings, Software leads with a 76.0% share.
- By deployment, Cloud leads with a 71.2% share and is also the fastest-growing segment.
- By application, Budgeting and Forecasting leads with a 31.5% share.
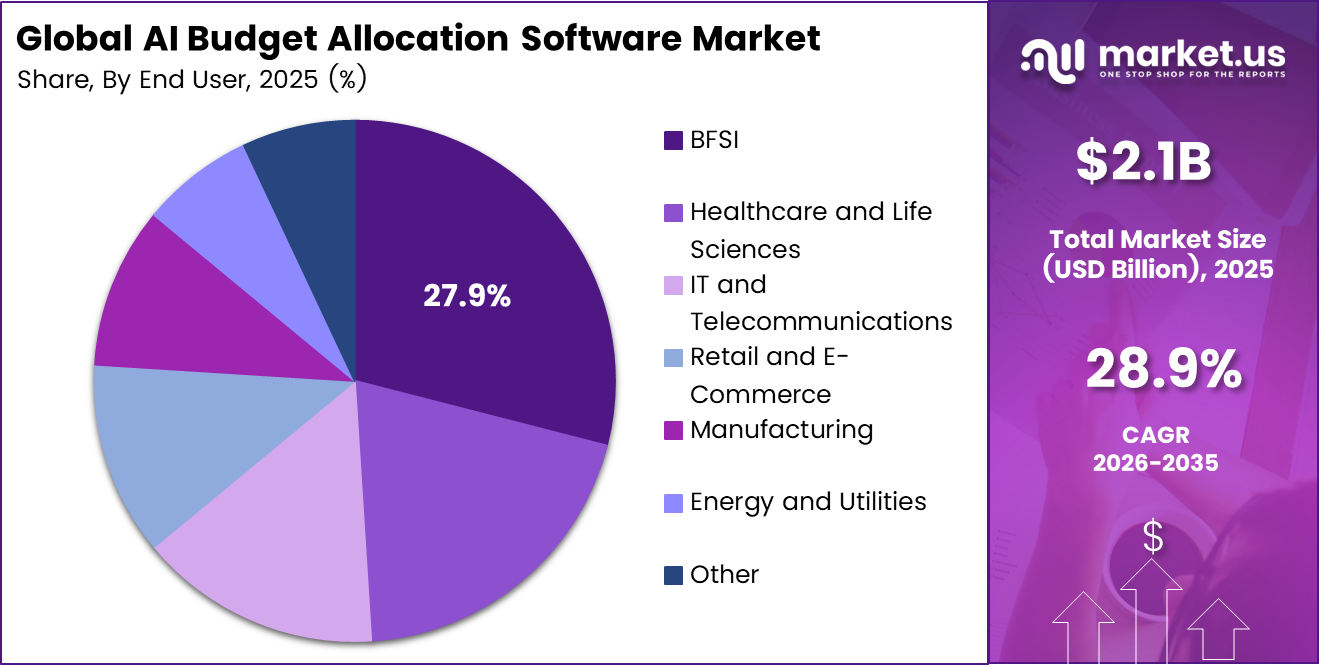
- By end user, BFSI leads with a 27.9% share.
- North America dominates with a 41.2% share and USD 0.9 billion in revenue.
By Offerings
Software dominates with 76.0% due to ready-built AI planning tools for finance.
Software leads because finance teams want tools they can switch on fast. They want to plan budgets, track spending, and get AI advice without building their own systems. Eurostat shows how strong this habit already is. Among EU firms that bought cloud services in 2023, 95.8% bought at least one Software-as-a-Service tool, and finance and accounting apps are one of the types it counts.
Services is the fastest-growing segment because many companies cannot set up AI planning tools on their own. They need outside help with setup, data cleaning, model tuning, and staff training. The U.S. Bureau of Labor Statistics expects jobs for management analysts to grow 10% from 2025 to 2035. It also projects about 94,100 openings each year, as firms look for ways to cut costs.
By Deployment
Cloud dominates with 71.2% due to low upfront cost and quick rollout.
Cloud leads because buyers do not need to buy servers or hire large IT teams to run AI budgeting tools. Vendors push model updates on their side, so finance teams always have the latest forecasting features. This matters for planners who need fresh data from many business units at once.
Business use of the cloud keeps climbing. Eurostat reports that 52.74% of EU enterprises used paid cloud services in 2025. That is a rise of 7.42 percentage points from 2023. Large firms adopt the cloud even faster: 84.67% of them bought cloud services in 2025. These are the same companies that buy advanced budget allocation platforms.
Cloud is also the fastest-growing segment. AI models need a lot of computing power, and the cloud lets firms scale that power up or down as they need it. Medium-sized firms are also moving fast. Their cloud use rose to 66.78% in 2025, which opens a big new pool of buyers for subscription tools. On-premises tools still serve firms with strict data rules, but they are growing more slowly.
By Application
Budgeting and Forecasting dominates with 31.5% due to the yearly planning cycle every finance team runs.
Budgeting and Forecasting leads because every company, in every industry, must plan its yearly budget and update its forecasts. AI makes this core task faster. It reads past data, spots trends, and suggests numbers in hours instead of weeks. This is often the first AI use case that a CFO approves.
Wider AI use in business supports this lead. Eurostat found that 20.0% of EU enterprises used AI technologies in 2025, up from 13.5% in 2024. Among large firms, the share reached 55.03%. These large firms run complex, multi-unit budgets where AI forecasting adds the most value.
Marketing-Mix and Media Budget Optimization is the fastest-growing application because ad spending is large and keeps rising. Marketers need AI to decide how to split money across channels. According to the IAB/PwC report, U.S. internet ad revenue reached $294.6 billion in 2025, a 13.9% rise from the year before.
By End User
BFSI dominates with 27.9% due to strict capital and risk planning rules.
BFSI leads because banks, insurers, and investment firms handle huge budgets under close watch from regulators. They must plan capital, test stress scenarios, and explain every cost to supervisors. AI allocation tools help them do this faster and with fewer errors. These firms also have large IT budgets and clean, structured financial data, so they were early buyers.
BFSI firms also run many cost centers, branches, and product lines. This makes cost allocation and chargeback a daily need, not a one-time project. As a result, they tend to buy full platform suites rather than single tools. This raises their share of total spending.
Healthcare and Life Sciences is the fastest-growing end user because rising costs put heavy pressure on budgets. CMS reports that U.S. national health spending grew 7.2% to $5.3 trillion in 2024. That equals $15,474 per person and 18.0% of GDP. Hospitals and drug makers now turn to AI to control costs, plan staff, and fund research pipelines more carefully.
Key Market Segments
By Offerings
- Software
- Services
By Deployment
- On-Premises
- Cloud
By Application
- Budgeting and Forecasting
- Marketing-Mix and Media Budget Optimization
- Scenario Planning and What-If Analysis
- Financial Reporting and Variance Analysis
- Cash Flow and Working-Capital Planning
- Cost Allocation and Chargeback
- Capital Allocation and Portfolio Planning
By End User
- BFSI
- Healthcare and Life Sciences
- IT and Telecommunications
- Retail and E-Commerce
- Manufacturing
- Energy and Utilities
- Other
Geopolitical Impact Analysis
AI budget software runs on cloud servers powered by advanced chips. Trade policy now shapes the cost of that hardware. The U.S. placed a 25% ad valorem tariff on certain advanced computing chips under Section 232. The rule exempts chips for U.S. data centers, research, and startups. Even so, it raises costs for some hardware outside those uses. Cloud vendors can pass those costs on through higher hosting fees.
Conflict in the Middle East hit energy and shipping hard. UNCTAD reported that daily ship transits through the Strait of Hormuz fell from 129 to just 3, a drop of about 97%. Oil prices rose 27% to about USD 91.8 per barrel. Gas prices jumped 74%. Data centers use large amounts of power, so energy shocks raise the cost of running AI models. This pushes software vendors to watch compute costs closely.
Logistics delays slowed delivery of servers and network gear. UN agencies reported about 25 days of extra shipping time on some routes during the disruption. The strait reopened only after more than 100 days of disruption. Longer lead times delayed some new data center capacity in affected regions.
Trade values also show price pressure. The WTO found that goods trade volume grew 3.5% year on year in the first half of 2026, while trade value grew 15%. Higher energy prices and strong demand for AI goods drove this gap. The WTO still raised its 2026 trade volume forecast to 3.9% from 1.9%. Buyers now ask for flexible pricing and multi-region hosting to manage this risk.
Regional Analysis
North America dominates the AI Budget Allocation Software Market, holding a 41.2% share and generating USD 0.9 billion in revenue. The region hosts the main vendors in this space. OneStream, Anaplan, Planful, Cube, and Mosaic all have deep roots in the U.S. Large buyers in finance, tech, and healthcare drive steady demand.
The U.S. Census Bureau found that 39.7% of firms in the information sector used AI as of May 2026. That rate is about twice the national average. These firms run large cloud and data budgets. They need tools that split spending across teams, projects, and campaigns. AI use also climbs with firm size. The Census Bureau reported that 32% of firms with 100 to 249 workers used AI.
Asia Pacific shows strong momentum, led by India, China, Japan and Australia. India hosts 2,117 global capability centers across 3,728 units, according to Nasscom data for FY2026. These centers employ about 2.36 million professionals and earn about USD 98.4 billion in revenue. More than 1,200 centers have built-in AI and machine learning skills.
Europe holds the second position in this market. Eurostat reported that 20.0% of EU enterprises with 10 or more workers used AI in 2025. That rate rose by 6.5 percentage points from 13.5% in 2024. Among large EU firms, 55.03% used AI. Eurostat also found that 31.05% of AI-using firms applied it to business administration and management.
Key Regions and Countries
North America
- US
- Canada
Europe
- Germany
- France
- The UK
- Spain
- Italy
- Rest of Europe
Asia Pacific
- China
- Japan
- South Korea
- India
- Australia
- Rest of APAC
Latin America
- Brazil
- Mexico
- Rest of Latin America
Middle East and Africa
- GCC
- South Africa
- Rest of MEA
Market Dynamics
Drivers
| Driver | (~) % Impact on CAGR Forecast | Geographic Relevance | Impact Timeline |
|---|---|---|---|
| AI-Spend Volatility Forces Continuous Budgeting | +2.4% | Global; strongest in North America and Europe | Short term (2 years or less) |
| Finance-Function AI Adoption | +1.7% | North America, Europe, and developed Asia-Pacific | Short term (2 years or less) |
| Rolling Forecasting Adoption | +1.3% | Global large enterprises | Short term (2 years or less) |
| Cloud Financial Operations Expansion | +1.0% | North America, Europe and Asia-Pacific | Medium term (2 to 4 years) |
| Real-Time Operational Data Availability | +0.8% | Global digitally mature enterprises | Medium term (2 to 4 years) |
| Decentralized Spending Accountability | +0.6% | Multinational and multi-division enterprises | Medium term (2 to 4 years) |
AI-Spend Volatility Forces Continuous Budgeting
Rapid adoption of metered AI infrastructure is converting technology expenditure from predictable annual commitments into variable, workload-sensitive costs: OECD statistics show firm-level AI use increasing from 14.2% in 2024 to 20.2% in 2025, after standing at 8.7% in 2023.
Eurostat similarly recorded EU enterprise adoption rising from 13.5% in 2024 to 20.0% in 2025, while the U.S. Census Bureau measured overall business usage at approximately 17–20% through May 2026 and 33.9% within finance and insurance.
The FinOps Foundation found that workload optimization and waste reduction remained the priority for 50% of practitioners in 2025, while management of AI and machine-learning expenditure climbed four priority positions, reinforcing demand for automated allocation, anomaly detection and continuous reforecasting rather than static annual plans.
Restraints
| Restraint | (~) % Impact on CAGR Forecast | Geographic Relevance | Impact Timeline |
|---|---|---|---|
| Fragmented Data-Governance Requirements | -2.1% | Europe, China, India and regulated global enterprises | Short term (2 years or less) |
| Automated-Decision Liability Exposure | -1.6% | Europe and regulated industries globally | Short term (2 years or less) |
| Enterprise Security Approval Gates | -1.3% | Global large enterprises | Short term (2 years or less) |
| High Upfront Integration Burden | -1.0% | Global midmarket and legacy-intensive sectors | Medium term (2 to 4 years) |
| Incumbent Platform Bundling | -0.8% | North America, Europe and developed Asia-Pacific | Medium term (2 to 4 years) |
| Contractual Switching Barriers | -0.6% | Global enterprise software accounts | Medium term (2 to 4 years) |
Fragmented Data-Governance Requirements
Budget-allocation engines require detailed payroll, departmental, supplier, and investment data, making divergent national rules an immediate deployment gate rather than routine compliance overhead. The European Commission states that most EU AI Act provisions and enforcement began on 2 August 2026, following general-purpose AI governance requirements introduced in 2025.
China’s Cyberspace Administration requires a security assessment when covered transfers reach at least 1 million individuals’ personal information or 10,000 individuals’ sensitive information, while transfers between 100,000 and fewer than 1 million individuals generally require a standard contract or certification.
A multinational vendor must consequently maintain regional hosting, configurable retention, transfer controls, and separate assurance evidence; an analyst execution scenario anchored to these regulatory requirements indicates procurement deferrals of 3–9 months and gross-margin pressure of 8–15 percentage points on early regional deployments.
Challenges
| Challenge | (~) % CAGR Friction Drag | Geographic Relevance | Mitigation Horizon |
|---|---|---|---|
| Hybrid Finance-AI Talent Scarcity | -1.8% | Global; acute in emerging markets and midmarket firms | Medium term (2 to 4 years) |
| Budget Taxonomy Fragmentation | -1.5% | Global multi-entity enterprises | Medium term (2 to 4 years) |
| Shock-Driven Forecast Drift | -1.2% | Global cyclical and commodity-sensitive sectors | Long term (4 years or more) |
| Workflow Change Resistance | -1.0% | Global traditional enterprises | Medium term (2 to 4 years) |
| Sparse Outcome Labels | -0.8% | Emerging markets and newly digitized sectors | Long term (4 years or more) |
| Multi-Currency Data Latency | -0.6% | Multinational enterprises | Medium term (2 to 4 years) |
Hybrid Finance-AI Talent Scarcity
Effective deployment requires professionals who can reconcile accounting controls, planning logic, data engineering, and model-risk governance, yet these capabilities remain scarce within the same teams. The World Economic Forum reports that 63% of employers identify skills gaps as a major transformation barrier, 85% plan to prioritize upskilling, and 62% expect to hire employees with AI-related skills.
An OECD survey found that 50% of SMEs reported insufficient employee skills for generative-AI use, while only 29% of adopting SMEs applied the technology to core activities. ISC2 separately estimated a global cybersecurity workforce gap of approximately 4.76 million people in 2024, an increase of 19.1%, adding secure-data and access-control constraints to finance-model implementation.
The resulting friction appears as prolonged configuration, low feature utilization, and repeated manual validation rather than cancelled demand, with an analyst scenario indicating that weak enablement can leave utilization 10–20 percentage points below plan and customization effort 15–25% above initial estimates.
Opportunities
| Opportunity | (~) % Potential CAGR Upside | Geographic Relevance | Execution Window |
|---|---|---|---|
| SME Self-Service Budget Allocation | +2.0% | Global; strongest in Europe, North America and Asia-Pacific | Medium term (2 to 4 years) |
| Vertical Planning Model Packs | +1.5% | Regulated and asset-intensive industries globally | Medium term (2 to 4 years) |
| Autonomous Reallocation Agents | +1.2% | Digitally mature enterprises globally | Long term (4 years or more) |
| Embedded Financial-Platform Channels | +0.9% | North America, Europe and developed Asia-Pacific | Medium term (2 to 4 years) |
| Sustainability-Linked Capital Planning | +0.7% | Europe and multinational enterprises | Long term (4 years or more) |
| Portfolio Planning Consolidation | +0.5% | Private-equity portfolios and multi-subsidiary groups | Medium term (2 to 4 years) |
SME Self-Service Budget Allocation
This segment remains future white space rather than a current driver because adoption is broadening but has not penetrated core financial workflows at smaller firms. OECD data show AI use at only 11.9% among small firms versus 40% among large firms, with just 29% of generative-AI-using SMEs applying it in core activities.
Eurostat recorded a comparable 2025 divide of 17.0% adoption among small EU enterprises and 55.0% among large enterprises, while the U.S. Census Bureau found usage below 20% among firms with four or fewer employees compared with 37% among firms employing at least 250 people.
An analyst execution case suggests that productization could reduce onboarding effort by 35–50%, compress implementation from 8–12 weeks to 3–5 weeks, and raise software gross margin by 6–10 percentage points. Capturing that upside requires deliberate channel partnerships, low-touch support, and tiered subscriptions.
Key Players Analysis
Tier 1 leaders include OneStream and Anaplan. OneStream posted total revenue of USD 601.9 million in fiscal 2025, up 23% year on year. Subscription revenue reached USD 550.0 million, up 28%. Its AI bookings and AI customers more than doubled in 2025. Hg agreed to buy OneStream for about USD 6.4 billion, or USD 24.0 per share in cash. That price was a 31% premium.
Anaplan is privately held and does not publish revenue. In September 2025, it bought Syrup Tech, an AI-native supply chain platform. The deal adds AI tools for retailers to plan, buy, price, and allocate stock. It also deepens Anaplan’s scenario planning offer.
Tier 2 challengers include Pigment, Datarails, Prophix, Board International, Jedox, Vena, Planful, Cube, Mosaic and Jirav. Pigment raised USD 145 million in a Series D round led by ICONIQ Growth. Datarails raised USD 70 million in Series C funding, bringing its total to USD 175 million. Its revenue grew 70% in 2025, and its staff nearly doubled to over 400 people.
Consolidation is changing the challenger tier. HiBob agreed to buy Mosaic in February 2025, which joins HR and finance planning on one platform. Prophix bought Talentia Software and Forest Grove in July 2025. These deals widen its reach into consolidation and Australian analytics. Smaller vendors now compete on agentic AI and quick setup for mid-market buyers.
Top Key Players in the Market
- Anaplan, Inc.
- OneStream, Inc.
- Planful, Inc.
- Prophix Software Inc.
- Board International S.A.
- Jedox GmbH
- Vena Solutions Inc.
- Pigment SAS
- Cube Software Inc.
- Datarails Ltd.
- Mosaic Group, Inc.
- Jirav, Inc.
Recent Developments
- In February 2025, HiBob agreed to acquire Mosaic, a cloud-based FP&A platform, to bring HR and finance planning together for CFOs.
- In September 2025, Anaplan acquired Syrup Tech, an AI-native supply chain platform that helps retailers plan, buy, price, and allocate inventory.
- In January 2026, OneStream signed a definitive agreement to be acquired by Hg in an all-cash deal worth about USD 6.4 billion, or USD 24.0 per share.
- In January 2026, Datarails raised USD 70 million in Series C funding led by One Peak, bringing its total funding to USD 175 million.
Report Scope
| Report Features | Description |
|---|---|
| Market Value (2025) | USD 2.1 Billion |
| Forecast Revenue (2035) | USD 26.0 Billion |
| CAGR (2026-2035) | 28.9% |
| Base Year for Estimation | 2025 |
| Historic Period | 2020-2024 |
| Forecast Period | 2026-2035 |
| Report Coverage | Revenue Forecast, Market Dynamics, Competitive Landscape, Recent Developments |
| Segments Covered | By Offerings (Software, Services); By Deployment (On-Premises, Cloud); By Application (Budgeting and Forecasting, Marketing-Mix and Media Budget Optimization, Scenario Planning and What-If Analysis, Financial Reporting and Variance Analysis, Cash Flow and Working-Capital Planning, Cost Allocation and Chargeback, Capital Allocation and Portfolio Planning); By End User (BFSI, Healthcare and Life Sciences, IT and Telecommunications, Retail and E-Commerce, Manufacturing, Energy and Utilities, Other) |
| Regional Analysis | North America – US, Canada; Europe – Germany, France, The UK, Spain, Italy, Rest of Europe; Asia Pacific – China, Japan, South Korea, India, Australia, Singapore, Rest of APAC; Latin America – Brazil, Mexico, Rest of Latin America; Middle East & Africa – GCC, South Africa, Rest of MEA |
| Competitive Landscape | Anaplan, Inc., OneStream, Inc., Planful, Inc., Prophix Software Inc., Board International S.A., Jedox GmbH, Vena Solutions Inc., Pigment SAS, Cube Software Inc., Datarails Ltd., Mosaic Group, Inc., Jirav, Inc. |
| Customization Scope | Customization for segments and region/country-level will be provided. Moreover, additional customization can be done based on the requirements. |
| Purchase Options | We have three licenses to opt for: Single User License, Multi-User License (Up to 5 Users), Corporate Use License (Unlimited Users and Printable PDF) |





























