


Report Overview
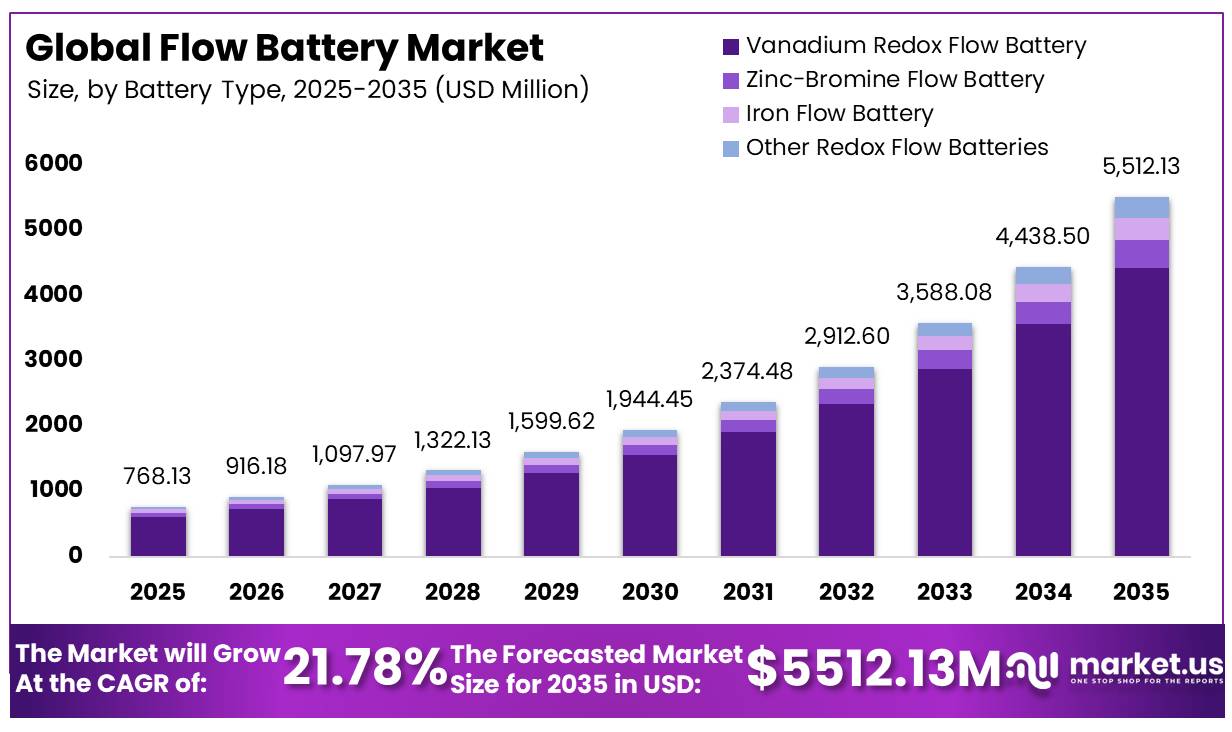
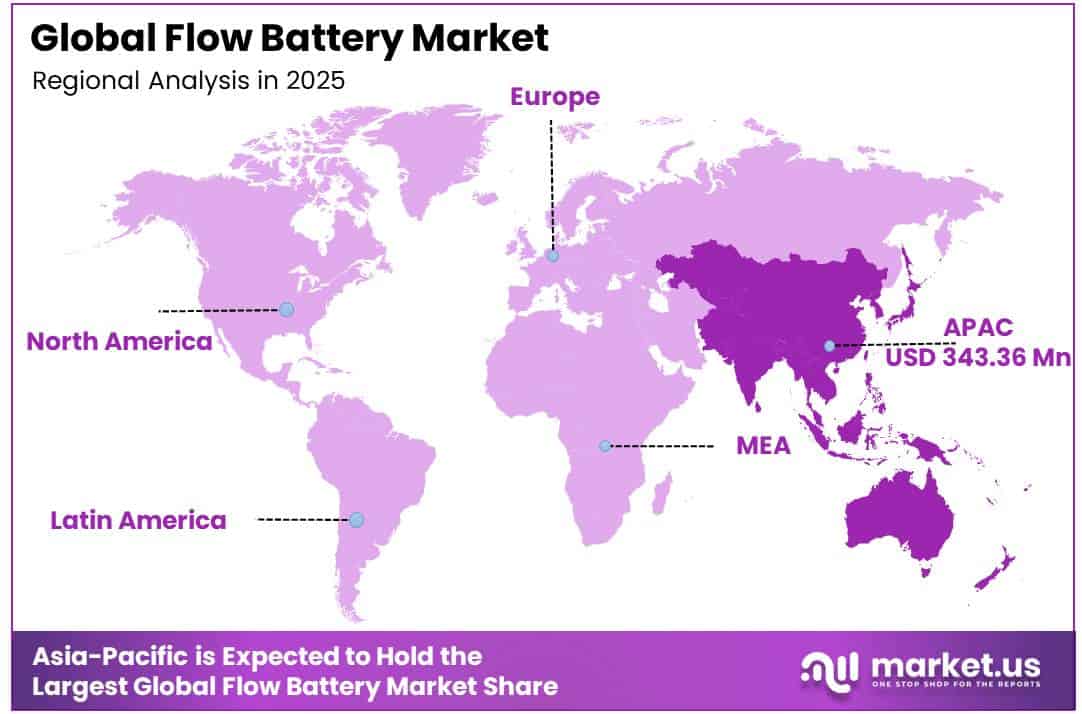
In 2025, the Global Flow Battery Market was valued at USD 768.13 Million, and between 2026 and 2035, this market is estimated to register a CAGR of 21.78%, reaching about USD 5,512.13 Million by 2035. In 2025, Asia Pacific led the market, achieving over 44.7% share with a revenue of USD 343.36 Million.
The flow battery industry is becoming an important part of the long-duration energy storage value chain. Flow batteries store electricity in liquid electrolytes held in external tanks and circulated through electrochemical stacks. Unlike conventional batteries, their power output and energy capacity can be expanded separately, allowing developers to increase discharge duration by adding electrolyte.
- Vanadium, iron-chromium, zinc-bromine and organic chemistries are being developed, while vanadium and zinc-bromine systems are among the more commercially mature options. The International Energy Agency reported that global battery storage additions reached 108 GW in 2025, around 40% higher than in 2024.
Key Takeaways
- The Global Flow Battery Market was valued at USD 768.13 Million in 2025.
- The market is projected to grow at a CAGR of 21.78% and is estimated to reach USD 5,512.13 Million by 2035.
- Vanadium Redox Flow Battery led the battery type segment with an 80.20% share, driven by long cycle life and suitability for large-scale, long-duration energy storage.
- Large-Scale (>10 MWh) systems led the system size segment with a 61.80% share, supported by rising utility investments in long-duration storage.
- Grid / Utility Energy Storage led the application segment with a 59.10% share, driven by growing renewable energy integration and grid stability needs.
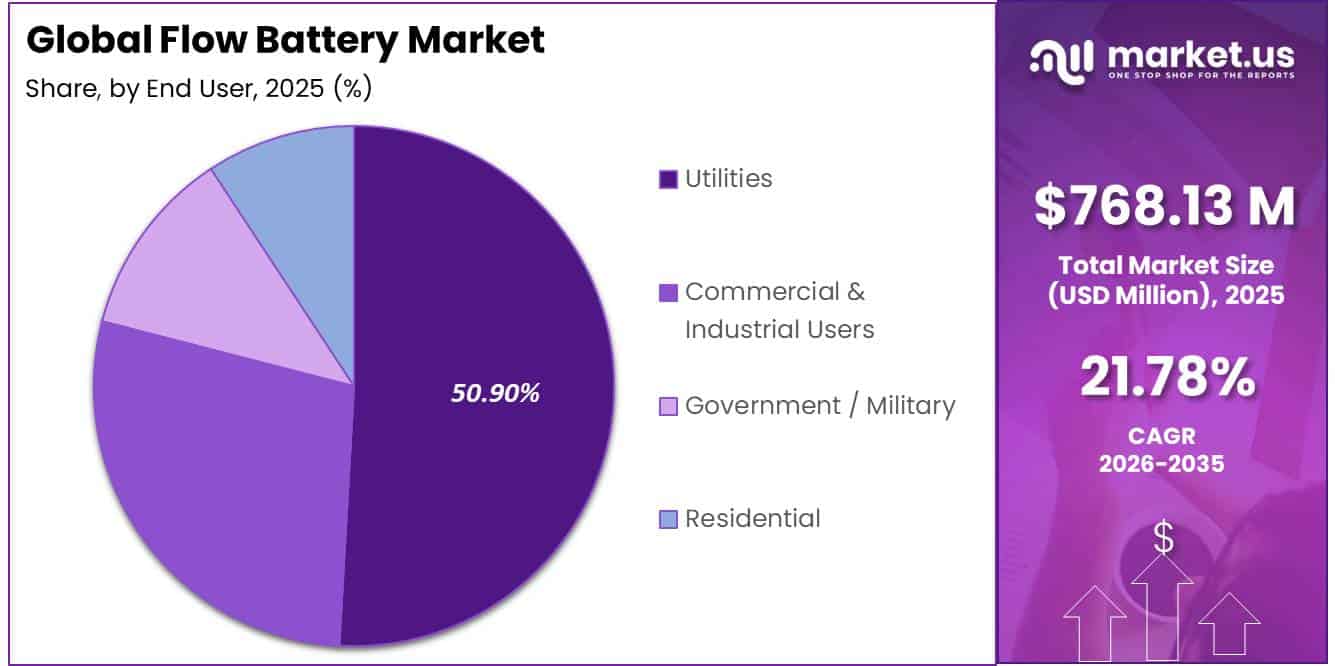
- Utilities led the end-user segment with a 50.90% share, supported by demand for scalable long-duration storage solutions.
- Asia Pacific led the regional landscape with a 44.70% share, driven by rapid renewable deployment, supportive policies, and expanding manufacturing capacity.
Lithium-ion technology still dominates shorter-duration installations, but flow batteries are gaining attention for applications requiring 8 hours or more of discharge and frequent cycling. The U.S. Department of Energy’s reference case assumes 10,000 electrolyte cycles for a 100 MW, 10-hour vanadium system. Commercial progress includes a 100 MW/400 MWh vanadium project in Dalian, China, and a planned 7 MW/30 MWh system in the United Kingdom. Demand is mainly driven by renewable expansion, grid congestion, peak-load management and the need for resilient electricity at critical facilities.
The IEA estimates that global energy storage capacity must rise to 1,500 GW by 2030 to support the tripling of renewable power capacity, with batteries supplying 1,200 GW. Flow batteries can participate because additional storage hours do not require proportional enlargement of the power stack. This feature can improve project economics where renewable shifting, capacity support and repeated grid-services operation are required.
- Government initiatives are also accelerating technology development. The U.S. Department of Energy’s flow battery assessment estimates that a 100 MW, 10-hour vanadium system would cost USD 384.5 per kWh, while its projected 2030 levelized storage cost is approximately USD 0.16 per kWh before stronger research investment. In June 2025, the department selected a USD 5 million demonstration of an organic quinone flow battery at a healthcare facility.
Europe has identified 2,356 storage projects representing 170.92 GW, including 70 GW operational and 97.26 GW expected by 2030. Wider adoption will depend on lower electrolyte, membrane and stack costs, standardised testing and safety rules, stronger financing, domestic manufacturing and electricity-market payments that properly reward storage beyond four hours.
Battery Type Analysis
Vanadium Redox Flow Battery dominates the Flow Battery market due to its long life, high durability, and strong utility-scale adoption
In 2025, Vanadium Redox Flow Battery held a dominant market position, capturing more than an 80.20% share of the global flow battery market. The segment maintained its leadership because of its long operational life, high cycling capability, and excellent safety profile compared with conventional battery technologies. Vanadium redox flow batteries can typically operate for more than 20 years and deliver over 10,000–20,000 charge-discharge cycles, making them highly suitable for grid-scale renewable energy storage and utility applications.
- The International Energy Agency reported in March 2025 that global renewable power capacity additions reached around 700 GW in 2024, including approximately 550 GW of solar PV and 120 GW of wind capacity. This rapid expansion is supporting demand for vanadium redox flow batteries, as these systems can provide long-duration storage, improve grid stability and store surplus renewable electricity for later use.
Zinc-Bromine Flow Battery is the fastest-growing segment in the global flow battery market during 2025 and 2026. The segment is witnessing increasing adoption because zinc and bromine are more widely available than vanadium, helping manufacturers reduce material costs while supporting large-scale energy storage deployments. According to the U.S. Department of Energy, long-duration energy storage technologies are critical for achieving reliable and carbon-free electricity systems, creating favorable opportunities for emerging flow battery chemistries beyond vanadium.
- The International Renewable Energy Agency (IRENA) reported that global renewable power capacity reached approximately 4,448 GW by the end of 2024, increasing the need for safe, scalable, and long-duration battery technologies such as zinc-bromine systems.
System Size Analysis
Large-Scale (>10 MWh) systems dominate the Flow Battery market due to increasing grid modernization investments
In 2025, Large-Scale (>10 MWh) held a dominant market position, capturing more than a 61.80% share of the global flow battery market. The segment maintained its leadership because utilities and transmission operators continue investing in high-capacity energy storage to improve grid stability, renewable integration, and power reliability. Large-scale flow battery installations are preferred for long-duration storage, renewable energy shifting, and transmission support, where long operating life and flexible capacity are essential.
- According to the U.S. Department of Energy (DOE), the Long Duration Storage Shot targets a 90% reduction in the cost of grid-scale long-duration energy storage by 2030, accelerating the deployment of technologies such as flow batteries for utility-scale projects.
Medium-Scale (1–10 MWh) is the fastest-growing segment in the global flow battery market during 2025 and 2026. Growth is supported by increasing deployment of commercial solar projects, industrial facilities, microgrids, and distributed energy systems that require reliable medium-capacity storage solutions. These systems provide energy cost savings, backup power, and improved grid resilience while requiring lower upfront investment than utility-scale installations.
- According to the International Energy Agency (IEA), global electricity demand is expected to increase by nearly 4% annually through 2027, driven by electrification, data centers, manufacturing, and electric vehicles.
Application Analysis
Grid / Utility Energy Storage dominates the Flow Battery market due to rising demand for long-duration grid balancing solutions
In 2025, Grid / Utility Energy Storage held a dominant market position, capturing more than a 59.10% share of the global flow battery market. The segment accounted for the largest share because electric utilities are increasingly deploying long-duration energy storage systems to integrate renewable electricity, improve grid flexibility, and maintain power reliability during periods of fluctuating demand.
- According to the International Energy Agency (IEA), global investment in electricity grids increased to approximately USD 400 billion in 2024, reflecting growing efforts to modernize transmission and distribution infrastructure and accommodate higher renewable energy penetration.
Commercial & Industrial is the fastest-growing segment in the global flow battery market during 2025 and 2026. The segment is expanding as manufacturing facilities, warehouses, commercial buildings, campuses, and data centers increasingly invest in on-site energy storage to improve power reliability, reduce peak electricity costs, and support renewable energy systems. Flow batteries offer long service life, deep discharge capability, and stable performance, making them suitable for continuous commercial operations.
End User Analysis
Utilities dominate the Flow Battery market as grid operators continue investing in long-duration energy storage.
In 2025, Utilities held a dominant market position, capturing more than a 50.90% share of the global flow battery market. The segment remained the largest end-user because electric utilities are increasingly deploying long-duration energy storage systems to balance renewable electricity generation, strengthen grid reliability, and improve energy security. Flow batteries are well suited for utility operations due to their long service life, high cycling capability, and ability to store electricity for several hours without significant performance degradation.
- The International Energy Agency reported in May 2026 that utility-scale battery systems accounted for around 87 GW, or nearly 80%, of global battery-storage capacity additions during 2025.
Commercial & Industrial Users are the fastest-growing segment in the global flow battery market during 2025 and 2026. Growth is driven by rising adoption of energy storage systems across manufacturing facilities, commercial buildings, logistics centers, healthcare facilities, universities, and data centers seeking reliable backup power and lower electricity costs. Flow batteries are gaining attention because they offer long operational life, deep discharge capability, and safe operation for continuous commercial use.
- According to the U.S. Energy Information Administration (EIA), the commercial sector accounted for approximately 36% of total U.S. retail electricity sales in 2024, highlighting the significant electricity demand from businesses and institutions.
Key Market Segments
By Battery Type
- Vanadium Redox Flow Battery
- Zinc-Bromine Flow Battery
- Iron Flow Battery
- Other Redox Flow Batteries
By System Size
- Large-Scale (>10 MWh)
- Medium-Scale (1–10 MWh)
- Small-Scale (<1 MWh)
By Application
- Grid / Utility Energy Storage
- Commercial & Industrial
- Microgrids
- Residential
By End User
- Utilities
- Commercial & Industrial Users
- Government / Military
- Residential
Driver Analysis
LDES policy targets and public funding pull for 10+ hour storage
The strongest 2026 demand driver is the formal policy recognition that long-duration energy storage is a distinct grid asset class rather than a simple extension of 2–4 hour lithium systems. The U.S. Department of Energy’s Long Duration Storage Shot keeps the sector anchored to a system-level cost target of $0.05/kWh levelized cost of storage for 10+ hour applications, while DOE’s LDES program continues to define long duration as at least 10 hours and has supported additional deployment activity through federal funding rounds, including a $100 million notice issued in September 2024.
In California alone, the CEC states that more than $247 million has been allocated to non-lithium long-duration storage, and in 2025 it awarded $14 million for a 4 MW/32 MWh vanadium flow battery project, which is important because it moves flow batteries from pilot rhetoric into bankable public co-funding structures with real MW/MWh references.
Australia adds a parallel revenue-underwriting model through the Capacity Investment Scheme, which is designed to bring forward 32 GW of new capacity by 2030, including 9 GW of clean dispatchable capacity with regular tenders from 2024 to 2027; this lowers merchant risk and expands the investable universe for longer-duration technologies where project IRRs are otherwise suppressed by long payback periods. Strategically, this driver shifts vendor business models toward utility procurement, EPC alliances, and publicly backed demonstration-to-commercial conversion pipelines, which can lift flow battery CAGR by an estimated 2.4 percentage points because it directly improves financeability, not just technology visibility.
Driver Impact Analysis
| Driver | (~) % Impact on CAGR Forecast | Geographic Relevance | Impact Timeline |
|---|---|---|---|
| LDES policy targets and public funding pull for 10+ hour storage | +2.4 pts | North America core, EU, Australia, selective APAC corridors | Short term (≤ 2 years) |
| Renewable curtailment and grid congestion raising duration value | +1.9 pts | U.S. West, Australia NEM, EU congestion pockets, China renewables bases | Short term (≤ 2 years) |
| Power-market reform enabling storage revenue stacking | +1.6 pts | U.S. ISO/RTO markets, China spot-market provinces, Australia, parts of EU | Medium term (2-4 years) |
| Safety, siting, and industrial resilience favoring non-lithium chemistries | +1.3 pts | North America industrial sites, EU, mining and remote-grid APAC corridors | Medium term (2-4 years) |
| Vanadium supply-security and domestic industrial policy accelerating localization | +1.1 pts | U.S., EU, China, Australia, South Africa-linked supply chains | Medium term (2-4 years) |
| Battery traceability and lifecycle regulation rewarding long-life assets | +0.9 pts | EU core, UK spill-over, North America procurement-led adoption | Long term (≥ 4 years) |
Restraint Analysis
Vanadium input volatility
Flow battery adoption remains structurally constrained by vanadium-linked cost volatility because electrolyte can account for roughly 30% to 50% of a vanadium redox flow battery system cost in utility configurations, and the upstream mineral remains concentrated and strategically sensitive, with USGS continuing to flag vanadium as a monitored critical-mineral supply chain and reporting that falling or unstable vanadium pricing has hindered project development economics in recent years.
The commercial problem is not merely spot price direction but financing uncertainty: when electrolyte quotes move by double digits during bid-to-close windows of 6 to 12 months, EPC contractors either widen risk premiums or refuse fixed-price wraps, which can add an estimated 6% to 10% to total installed cost and cut project IRRs by 100 to 180 basis points for 6- to 10-hour systems. This is especially relevant outside China, because Sichuan’s 2024 provincial plan explicitly proposed a vanadium resource price-stabilization mechanism and even an “electrolyte bank,” which implicitly confirms that raw-material price instability is severe enough to require policy intervention; in practical market terms, that pushes OEMs in North America and Europe toward slower order conversion, tighter working-capital management, and delayed multi-project pipeline commitments.
Restraint Impact Analysis
| Restraint | (~) % Impact on CAGR | Geographic Relevance | Impact Timeline |
|---|---|---|---|
| Vanadium input volatility | -2.2% | China-linked supply, North America, EU | Short term (≤ 2 years) |
| High upfront system CapEx | -1.9% | North America core, EU, India, APAC corridors | Medium term (2-4 years) |
| Limited bankability track record | -1.6% | North America core, EU, Australia, India | Medium term (2-4 years) |
| Compliance and passport burden | -1.1% | EU, UK-aligned markets | Medium term (2-4 years) |
| Tariff and trade friction | -0.9% | U.S. import corridor, China-linked supply chains | Short term (≤ 2 years) |
| Long project qualification cycles | -1.4% | Utility-scale U.S., EU, India, APAC corridors | Long term (≥ 4 years) |
Opportunity Analysis
C&I resilience campuses
This is not a baseline driver because most current storage growth is utility-led, while commercial and institutional campuses remain a fragmented and underdeveloped go-to-market space for long-duration chemistries. EIA’s 2026 battery storage update notes large-scale storage growth and also tracks smaller commercial and industrial storage trends, while India’s official ESS outlook highlights rising storage needs and policy-backed obligations; that backdrop makes data centers, hospitals, semiconductor parks, pharma clusters, airports, and university campuses a white-space segment for 6-10 hour non-flammable storage where vendors can offer outage-cost avoidance, demand-charge reduction, and diesel displacement, with estimated customer payback compressed from 10-12 years to 6-8 years when stacked with resilience and tariff arbitrage, EBITDA margins expanding 300 to 500 basis points through software and O&M attach, and incremental CAGR upside of about 1.6 percentage points if even 3% to 5% of mission-critical campuses in target regions adopt this model by 2032.
Opportunity Impact Analysis
| Opportunity | (~) % Potential CAGR Upside | Geographic Relevance | Execution Window |
|---|---|---|---|
| 10+ hr utility niche capture | +2.4% | North America core, EU, India | Short term (≤ 2 years) |
| Water-treatment electrolyte model | +1.8% | North America, EU, GCC, Australia | Medium term (2-4 years) |
| Defense & public-infra microgrids | +1.5% | U.S., EU, Japan, India | Short term (≤ 2 years) |
| Storage-as-a-service contracts | +2.1% | North America, EU, APAC advanced | Medium term (2-4 years) |
| C&I resilience campuses | +1.6% | U.S., EU, India, Southeast Asia | Medium term (2-4 years) |
| Vanadium stack roll-up/localization | +1.9% | China-adjacent APAC, U.S., EU, India | Long term (≥ 4 years) |
Challenges Analysis
Vanadium supply opacity
Flow batteries, especially vanadium redox systems, face a persistent scaling challenge because the underlying mineral chain remains less transparent than mature energy commodities, with the U.S. Energy Information Administration explicitly noting that critical-mineral supply chains suffer from major data gaps that mute price discovery and complicate forecasting, while the U.S. Department of Energy identifies vanadium as the main potential bottleneck within otherwise relatively accessible flow-battery component chains.
In 2026 terms, that opacity translates into modeled electrolyte price swings often exceeding 15% to 25% across annual contracting windows, procurement hedging buffers of roughly 8% to 12% in project bids, and schedule padding of 3 to 6 months for developers waiting on acceptable feedstock economics, which together justify an estimated -1.4 percentage-point drag on market CAGR even though projects still move forward. The strategic response is not simple cost cutting but longer-tenor offtake contracts, electrolyte leasing structures, secondary vanadium recovery, regional refining diversification, and inventory strategies sized to cover 6 to 9 months of deployment cadence so that OEMs can reduce bid volatility without depending on perfect commodity visibility.
Challenges Impact Analysis
| Challenge | (~) % CAGR Friction Drag | Geographic Relevance | Mitigation Horizon |
|---|---|---|---|
| Vanadium supply opacity | -1.4% | North America core, EU industrial hubs, China-linked APAC supply chains | Medium term (2-4 years) |
| Weak supplier bankability | -1.1% | North America utility RFP markets, EU project finance zones, India tenders | Medium term (2-4 years) |
| Custom engineering intensity | -0.9% | North America core, EU regulatory hubs, APAC logistics corridors | Short term (≤ 2 years) |
| Skilled labor bottlenecks | -0.8% | U.S. manufacturing belts, EU clean-tech clusters, India pilot markets | Long term (≥ 4 years) |
| Interconnection schedule drag | -1.0% | U.S. ISO/RTO regions, EU transmission-constrained nodes, India state grids | Medium term (2-4 years) |
| Electrolyte circularity gap | -0.7% | North America core, EU sustainability markets, Australia-Asia export chain | Long term (≥ 4 years) |
Geopolitical Impact Analysis
War-Driven Energy Insecurity Boosts Demand for Flow Battery Storage
The war between Russia and Ukraine, now well into its fifth year, has pushed grid resilience to the top of the energy agenda, and flow batteries are catching the attention this brings. Russian strikes have wiped out a large share of Ukraine’s thermal power capacity, forcing the country to lean on decentralised, storage-backed power rather than a handful of large plants that make easy targets. This shift has already pulled in hundreds of megawatts of battery storage, with utilities and private investors racing to add more for grid balancing and backup.
That urgency is spilling beyond Ukraine’s borders. European nations, wary of depending on a single power source during wartime, are pouring money into long-duration storage to keep their grids steady when supply is disrupted. Flow batteries fit naturally into this picture, since they can hold power for many hours without losing capacity, unlike shorter-duration lithium-ion systems.
At the same time, the conflict has added pressure on raw material flows, including vanadium, used in flow battery electrolytes, with output from Russia facing tighter scrutiny. Even so, the broader push toward energy security is expected to outweigh these supply hurdles, keeping demand for flow battery storage on a steady upward path through the rest of this decade.
Regional Analysis
Asia-Pacific dominated the Flow Battery market, accounting for 44.70% of the global market valued in 2025
In 2025, Asia-Pacific held a dominant market position, accounting for 44.70% of the global Flow Battery market, valued at USD 343.36 million. The region led the market due to rapid expansion of renewable energy, large-scale electricity grid upgrades, and strong government support for long-duration energy storage technologies. China, Japan, South Korea, and Australia continue to invest heavily in utility-scale battery storage to improve grid reliability and accommodate increasing renewable electricity generation.
- According to the International Energy Agency (IEA), China added nearly 340 GW of solar PV capacity in 2024, representing the largest annual solar deployment globally. Meanwhile, the International Renewable Energy Agency (IRENA) reported that Asia contributed more than two-thirds of global renewable capacity additions in 2024, reinforcing the region’s leadership in clean energy deployment.
North America is projected to be the fastest-growing regional market during the forecast period, supported by increasing investments in grid modernization, renewable energy integration, and advanced energy storage technologies. Utilities and commercial energy users are expanding battery storage installations to improve energy resilience and reduce dependence on conventional generation during peak demand.
Key Regions and Countries Covered
- North America
- The US
- Canada
- Europe
- Germany
- France
- The UK
- Spain
- Italy
- Russia & CIS
- Rest of Europe
- APAC
- China
- Japan
- South Korea
- India
- ASEAN
- Rest of APAC
- Latin America
- Brazil
- Mexico
- Rest of Latin America
- Middle East & Africa
- GCC
- South Africa
- Rest of MEA
Key Players Analysis
The global Flow Battery market exhibits a moderately consolidated competitive structure, with a limited number of established manufacturers accounting for a significant share of commercial deployments and technology development. Competition is driven by electrolyte innovation, long-duration energy storage projects, manufacturing expansion, strategic partnerships, and utility-scale installations.
Sumitomo Electric Industries is one of the leading participants in the flow battery market, supported by decades of vanadium redox flow battery development. The company has deployed systems with capacities exceeding 60 MWh across multiple grid-scale projects and continues expanding its energy storage portfolio through utility partnerships and renewable integration solutions.
StorTera Ltd. is an emerging developer specializing in advanced flow battery technologies for grid and industrial applications. The company is advancing modular storage systems designed for 4 to 12 hours of energy storage and continues investing in product innovation, pilot installations, and partnerships to strengthen its position in the growing long-duration energy storage market.
The Major Players in The Industry
- Rongke Power Co., Ltd.
- ESS Tech, Inc.
- Invinity Energy Systems
- Sumitomo Electric Industries
- VRB Energy Ltd.
- Primus Power
- UniEnergy Technologies (UET)
- Largo Clean Energy
- CellCube (Enerox GmbH)
- Lockheed Martin
- H2, Inc.
- StorTera Ltd.
Key Development
- In June 2026, StorTera Ltd. strengthened its energy-storage business by securing a £1 million contract from Thrive Renewables to supply a 1.2 MW/2.4 MWh battery energy storage system for the Whitelaw Brae wind farm in the Scottish Borders.
- In January 2026, Dalian Rongke Power Co., Ltd. strengthened its partnership with China Three Gorges Corporation through the Jimusaer vanadium flow battery project in Xinjiang. The project provides 200 MW/1,000 MWh of storage, supports 5 hours of continuous discharge and is connected to a 1 GW solar power plant.
Report Scope
| Report Features | Description |
|---|---|
| Market Value (2025) | USD 768.13 Mn |
| Forecast Revenue (2035) | USD 5512.13 Mn |
| CAGR (2026-2035) | 21.78% |
| Base Year for Estimation | 2025 |
| Historic Period | 2020-2024 |
| Forecast Period | 2026-2035 |
| Report Coverage | Revenue Forecast, Market Dynamics, Competitive Landscape, Recent Developments |
| Segments Covered | By Battery Type (Vanadium Redox Flow Battery, Zinc-Bromine Flow Battery, Iron Flow Battery, and Other Redox Flow Batteries), By System Size (Large-Scale (>10 MWh), Medium-Scale (1–10 MWh), and Small-Scale (<1 MWh)), By Application (Grid / Utility Energy Storage, Commercial & Industrial, Microgrids, and Residential), By End User (Utilities, Commercial & Industrial Users, Government / Military, and Residential) |
| Regional Analysis | North America – The US & Canada; Europe – Germany, France, The UK, Spain, Italy, Russia & CIS, Rest of Europe; APAC– China, Japan, South Korea, India, ASEAN & Rest of APAC; Latin America– Brazil, Mexico & Rest of Latin America; Middle East & Africa– GCC, South Africa, & Rest of MEA |
| Competitive Landscape | Rongke Power Co., Ltd., ESS Tech, Inc., Invinity Energy Systems, Sumitomo Electric Industries, VRB Energy Ltd., Primus Power, UniEnergy Technologies (UET), Largo Clean Energy, CellCube (Enerox GmbH), Lockheed Martin, H2, Inc., StorTera Ltd. |
| Customization Scope | Customization for segments, region/country-level will be provided. Moreover, additional customization can be done based on the requirements. |
| Purchase Options | We have three licenses to opt for: Single User License, Multi-User License (Up to 5 Users), Corporate Use License (Unlimited Users and Printable PDF) |





































