


Report Overview
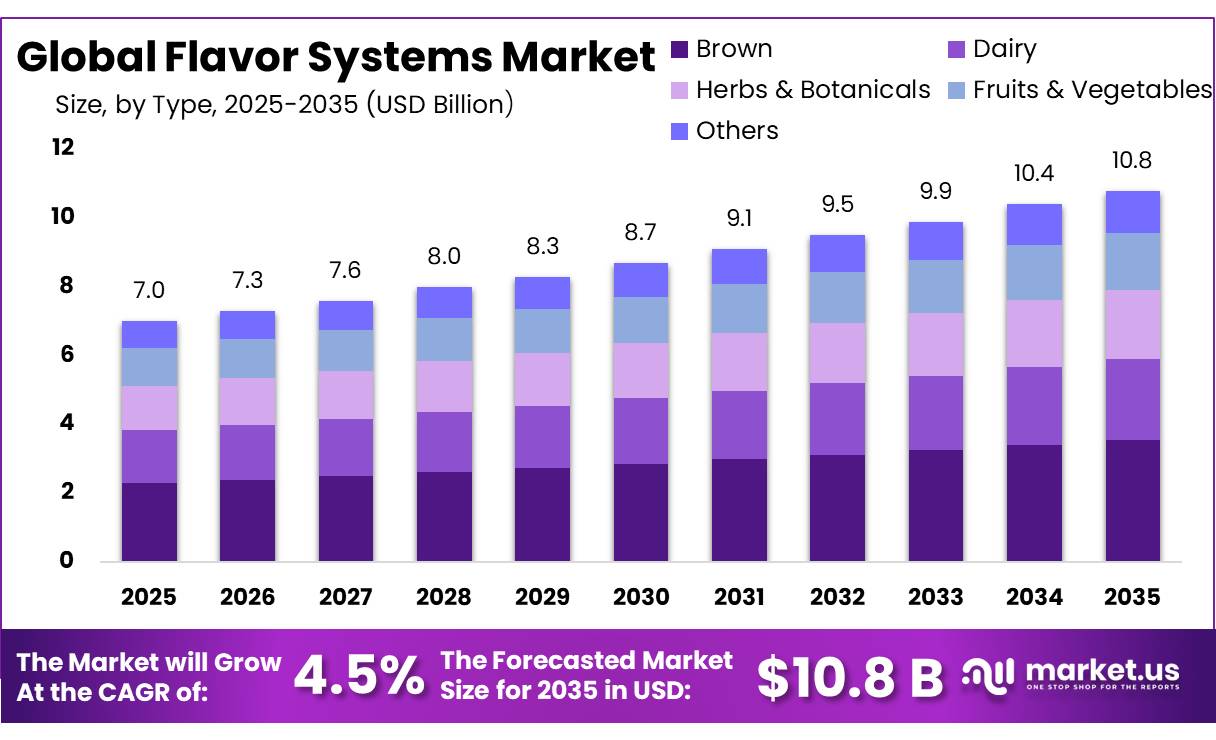
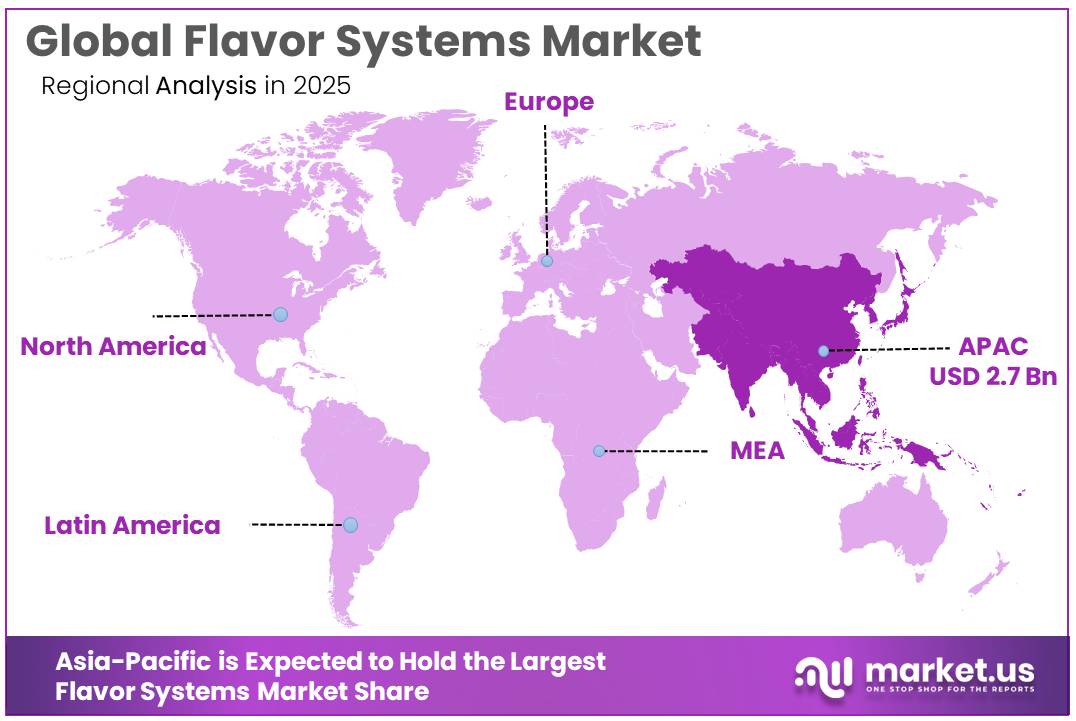
The Global Flavor Systems Market size is expected to be worth around USD 10.8 Billion by 2035, from USD 7.0 Billion in 2025, growing at a CAGR of 4.5% during the forecast period from 2026 to 2035. In 2025, Asia-Pacific held a dominant market position, capturing more than a 38.67% share, holding USD 2.7 Billion revenue.
Flavor systems are integrated combinations of flavoring ingredients and taste-modulation solutions that establish, enhance, or balance the sensory characteristics of food and beverages. Their commercial role extends beyond aroma creation to sweetness optimization, salt reduction, bitterness masking, and mouthfeel enhancement. The industry consequently operates as a formulation partner to manufacturers, connecting ingredient science with product differentiation and nutritional reformulation.
- Givaudan reported Taste & Wellbeing sales of CHF 3,642 million in 2025, increasing 2.4% on a like-for-like basis, although reported sales declined 2.9% in Swiss francs. IFF’s Taste segment generated USD 2,481 million in 2025 sales, with comparable currency-neutral growth of 4% and an adjusted operating EBITDA margin of 19.3%.
Health-oriented reformulation represents a central demand driver. Manufacturers require solutions that preserve consumer acceptance while reducing sugar or sodium and managing undesirable sensory notes. IFF’s FLAVORFIT portfolio addresses sugar reduction, salt reduction, and off-note masking, illustrating the industry’s movement toward integrated taste management. This creates opportunities for suppliers capable of balancing nutritional objectives with recognizable flavor profiles, particularly where ingredient changes otherwise weaken sweetness, savory intensity, or overall sensory quality.
- Government initiatives reinforce this reformulation opportunity. In August 2024, the United States Food and Drug Administration issued draft Phase II voluntary sodium-reduction targets covering 163 food categories. The proposed targets aim to reduce average sodium intake to approximately 2,750 milligrams daily, with implementation envisaged over three years following finalization. The FDA estimates that more than 70% of sodium intake originates from food manufacturing and commercial preparation.
Future growth opportunities also include biotechnology-enabled ingredients and fermentation-derived flavor compounds. Givaudan identifies biotechnology as a platform for developing responsibly sourced ingredients and sustainable alternatives for meat and dairy applications. Its BioNootkatone, developed with Manus Bio, uses natural fermentation without citrus inputs. This approach illustrates opportunities to diversify ingredient production while delivering targeted sensory characteristics. However, commercial momentum remains uneven: Givaudan’s Taste & Wellbeing sales reached CHF 1,789 million in the first half of 2026, growing only 0.5% like-for-like while declining 6.3% in Swiss francs.
Key Takeaways
- Flavor Systems Market size is expected to be worth around USD 10.8 Billion by 2035, from USD 7.0 Billion in 2025, growing at a CAGR of 4.5%.
- Brown held a dominant market position, capturing more than a 32.7% share.
- Natural Flavours held a dominant market position, capturing more than a 43.23% share.
- Liquid held a dominant market position, capturing more than a 68.67% share.
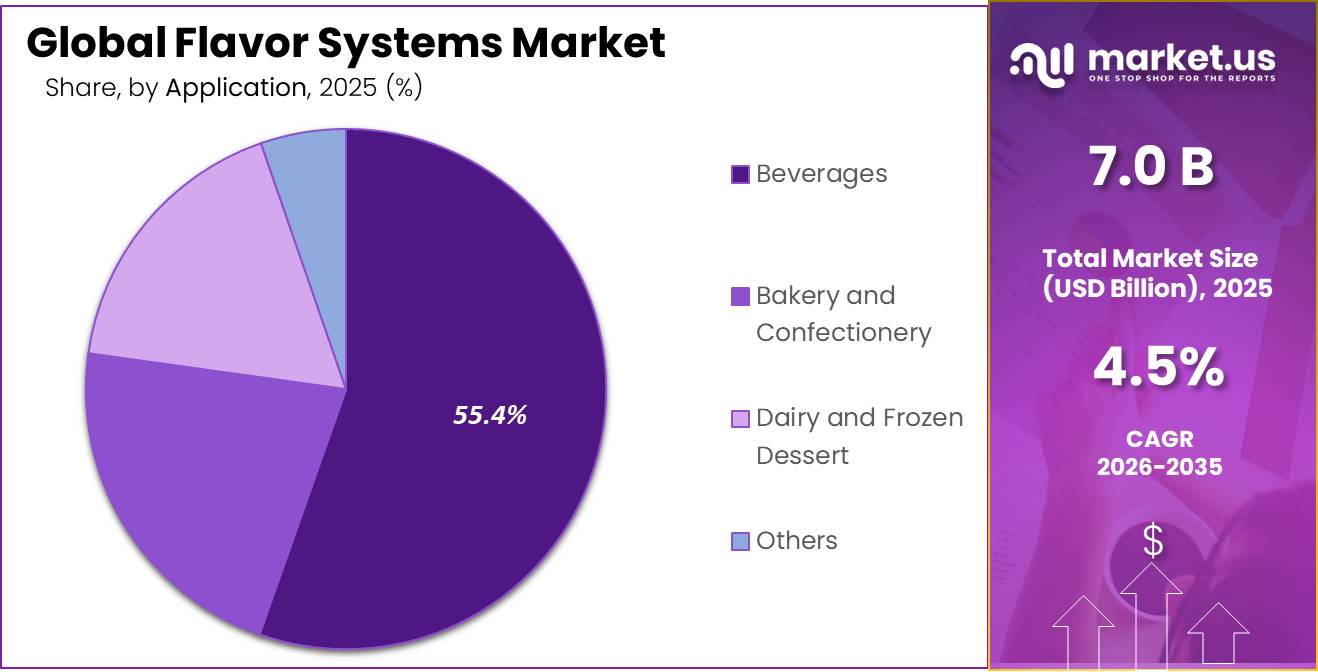
- Beverages held a dominant market position, capturing more than a 55.43% share.
- Asia-Pacific held the dominant position in the Flavor Systems Market in 2025, accounting for 38.67% of the market, valued at USD 2.7 billion
By Type Analysis
Brown flavor systems lead through their use in bakery products, chocolate, confectionery, desserts, and beverage applications.
In 2025, “Brown” held a dominant market position, capturing more than a 32.7% share. Brown flavor systems are used to create or strengthen chocolate, cocoa, caramel, coffee, roasted, and toasted taste profiles across food and beverage products. Their use in bakery items, confectionery, dairy desserts, and flavored drinks supports demand from manufacturers seeking consistent taste and aroma. The segment’s role in developing familiar, rich flavor profiles makes it relevant to both established products and new product formulations.
Dairy flavor systems are used to improve or maintain taste and aroma in products such as flavored milk, yogurt, ice cream, milkshakes, and dairy desserts. Vanilla, chocolate, strawberry, caramel, and cream-based profiles are commonly used to meet different consumer preferences. In 2025, the United States dairy industry recorded an average milk-fat content of 4.32% and skim-solids content of 9.12%, according to the United States Department of Agriculture (USDA). These figures highlight the composition of the milk used as a raw material in dairy processing, where flavor formulations must work effectively with varying fat and solids levels.
By Source Type Analysis
Natural Flavours lead through consumer interest in plant-derived ingredients and familiar taste profiles.
In 2025, “Natural Flavours” held a dominant market position, capturing more than a 43.23% share. Natural flavours are obtained from sources such as fruits, spices, herbs, vegetables, and other plant or animal materials. They are used in beverages, dairy products, bakery items, confectionery, and processed foods to provide distinctive taste and aroma. Demand is supported by food manufacturers seeking ingredients that meet product-label requirements and consumer preferences for naturally sourced components.
The United States Food and Drug Administration provides regulatory information on food ingredients and their safety status, while the European Union defines the conditions under which flavourings can be described as natural. These rules influence ingredient selection, product formulation, and labelling practices.
The German Federal Institute for Risk Assessment reports that approximately 10,000 flavouring substances have been identified in nature, of which about 2,500 are used to produce flavourings. These figures demonstrate the wide range of compounds available for flavour formulation. However, European Union Regulation (EC) No. 1334/2008 establishes rules for flavouring safety and labelling, and the European Union framework does not retain a separate authorization distinction between natural, nature-identical, and artificial flavourings.
By Form Analysis
Liquid flavor systems lead due to their easy blending, accurate dosing, and suitability for beverages and dairy products.
In 2025, “Liquid” held a dominant market position, capturing more than a 68.67% share. Liquid flavor systems are widely used in soft drinks, flavored milk, syrups, sauces, and other food products because they can be mixed efficiently into liquid formulations. Their ease of handling helps manufacturers achieve consistent taste and aroma across production batches. Liquid formats are also suitable for applications that require uniform flavor distribution and precise ingredient control. Demand is supported by beverage innovation and the need for flexible formulations across different food processing operations.
Dry flavor systems are used in seasoning mixes, snack coatings, bakery premixes, powdered beverages, soups, and instant food products. Their low-moisture format can simplify transportation, storage, and incorporation into dry ingredient blends. In 2025, demand for dry formulations was supported by food manufacturers seeking convenient handling, consistent flavor distribution, and suitability for products with extended shelf-life requirements. The United States Food and Drug Administration identifies anti-caking agents, including calcium silicate and silicon dioxide, as ingredients used to keep powdered foods free-flowing and limit moisture-related problems. This is relevant to dry flavor formulations, where powder handling and stability affect manufacturing efficiency.
By Application Analysis
Beverages lead flavor system demand through the need for consistent taste, aroma, and product variety.
In 2025, “Beverages” held a dominant market position, capturing more than a 55.43% share. Flavor systems are widely used in soft drinks, juices, energy drinks, flavored water, and ready-to-drink beverages to create distinctive taste profiles and maintain consistency across production batches. Liquid flavor formulations are particularly suitable for beverage manufacturing because they can be blended into liquid ingredients with controlled dosing.
Bakery and confectionery manufacturers use flavor systems in cakes, biscuits, cookies, pastries, chocolates, candies, and other sweet products to improve taste and product appeal. Vanilla, chocolate, caramel, fruit, and nut profiles help manufacturers develop different product varieties while maintaining consistent flavor across production batches.
In 2025, United States bakery and tortilla manufacturing recorded an annual sectoral output of approximately USD 86.56 billion, while sugar and confectionery product manufacturing recorded approximately USD 46.74 billion, based on data published by the United States Bureau of Labor Statistics through the Federal Reserve Bank of St. Louis. These figures demonstrate the scale of the industries that use flavor ingredients.
Key Market Segments
By Type
- Brown
- Dairy
- Herbs & Botanicals
- Fruits & Vegetables
- Others
By Source Type
- Nature-Identical Flavours
- Artificial Flavours
- Natural Flavours
By Form
- Dry
- Liquid
By Application
- Bakery and Confectionery
- Beverages
- Dairy and Frozen Dessert
- Others
Driver Analysis
Sugar-Reduction Reformulation
Sugar-reduction policy creates a deadline-driven opportunity for flavor systems because reducing sweetness can alter flavor balance and expose bitterness or other unwanted notes. The United Kingdom’s July 2026 policy publication sets out a reduction in the Soft Drinks Industry Levy threshold from 5 grams to 4.5 grams of sugar per 100 milliliters, alongside removal of exemptions for relevant milk-based and milk-substitute drinks from January 2028. This represents a 10% reduction in the entry threshold and extends reformulation pressure to additional packaged beverage categories; product-specific exemptions and allowances remain relevant.
The commercial mechanism is substitution toward sweetness modulation, bitterness management, and integrated flavor design rather than a simple increase in conventional flavor dosage. Suppliers can capture value when the additional formulation cost is lower than the manufacturer’s avoided levy exposure or supports consumer acceptance. The +0.6-percentage-point sensitivity receives the highest weighting because the implementation timetable falls within the forecast period and affects commercially established beverage categories. However, it assumes meaningful conversion of reformulation projects into recurring ingredient sales; the UK measure should not be treated as an EU-wide requirement.
Drivers Impact Analysis
| Driver | (~) % Impact on CAGR Forecast | Geographic Relevance | Impact Timeline |
|---|---|---|---|
| Sugar-reduction reformulation | +0.6 pp | UK core; EU, North America | Short term (≤ 2 years) |
| Sodium-reduction programs | +0.4 pp | North America core | Medium term (2–4 years) |
| Cocoa and ingredient optimization | +0.5 pp | Europe, North America; APAC manufacturing | Short term (≤ 2 years) |
| Protein taste improvement | +0.4 pp | North America, Europe | Medium term (2–4 years) |
| Localized application development | +0.3 pp | China core; East and Southeast Asia | Medium term (2–4 years) |
Restraint Analysis
Natural-Input Volatility
Agricultural dependence exposes natural flavor inputs to weather, disease, processing yields, and uneven crop recovery, complicating procurement even when headline production improves. USDA forecasts global orange production at 45.92 million metric tons in 2025/26, only 0.95% above 45.49 million metric tons in 2024/25 and below the reported ten-year average of 48.57 million metric tons. Its citrus outlook projects Brazilian production at 13.5 million metric tons, up approximately 500,000 tons but still below the five-year average; global orange juice production is forecast to increase by less than 1% to approximately 1.4 million tons.
These are crop and juice indicators, not direct measurements of flavor-grade citrus oil availability, but they demonstrate limited recovery in the upstream processing base. Flavor manufacturers consequently face a procurement trade-off between holding additional qualified material and accepting greater exposure to seasonal availability. Alternative origins or replacement ingredients may require sensory and specification approval, limiting immediate substitution. The −0.5-percentage-point sensitivity represents a scenario in which procurement uncertainty and qualification friction delay commercial orders; it does not assume that citrus prices rise continuously or that all natural flavors face identical shortages.
Restraint Impact Analysis
| Restraint | (~) % Impact on CAGR Forecast | Geographic Relevance | Impact Timeline |
|---|---|---|---|
| Natural-input volatility | −0.5 pp | Brazil supply; EU, US processors | Short term (≤ 2 years) |
| Regulatory reformulation | −0.3 pp | EU; exporters to EU | Medium term (2–4 years) |
| Uneven customer demand | −0.6 pp | North America, Europe, Latin America | Short term (≤ 2 years) |
| Input-cost pass-through | −0.4 pp | US, EU; cross-border supply | Short term (≤ 2 years) |
| Working-capital pressure | −0.2 pp | Europe, North America; global suppliers | Medium term (2–4 years) |
| Occupational liability | −0.1 pp | US manufacturing core | Long term (≥ 4 years) |
Opportunity Analysis
Clinical Sensory Platforms
The opportunity is to build application-specific sensory platforms for medical nutrition, rather than merely sell more masking ingredients into existing products. WHO projects that the population aged 60 and above will increase from 1 billion in 2020 to 1.4 billion in 2030 and 2.1 billion in 2050; the population aged 80 and above is expected to reach 426 million by 2050. These figures establish demographic context, not a directly addressable flavor-market customer count. By 2026, dsm-firmenich already offers medical-nutrition flavors, sensory modulation, customized premixes, and technologies intended to improve intake experience, confirming that basic participation in this application is already part of the commercial baseline.
The incremental white space lies in patient-group-specific sensory libraries, rotating flavor programs, and formulation packages validated for particular nutritional matrices, sold through development fees plus recurring ingredient supply. An illustrative model in which these platforms serve customers representing 5% of baseline market revenue and generate 40% additional flavor-system revenue within that cohort produces a 2% market-level endpoint uplift, supporting approximately +0.5 percentage points of CAGR upside. Execution requires patient-relevant testing, nutritional stability validation, and careful separation of palatability evidence from unproven clinical-outcome claims; demographic growth alone cannot justify premium pricing or reimbursement.
Opportunity Impact Analysis
| Opportunity | (~) % Potential CAGR Upside | Geographic Relevance | Execution Window |
|---|---|---|---|
| Clinical sensory platforms | +0.5 pp | US, EU, Japan | Medium term (2–4 years) |
| Paid digital co-creation | +0.3 pp | North America, Western Europe | Short term (≤ 2 years) |
| Biotech ingredient licensing | +0.5 pp | US, EU; Japan manufacturing | Long term (≥ 4 years) |
| SME formulation subscriptions | +0.4 pp | China, Southeast Asia, Latin America | Medium term (2–4 years) |
| Performance-linked contracts | +0.3 pp | EU, US; APAC exporters | Short term (≤ 2 years) |
Challenges Analysis
Flavorist Capability Renewal
Flavor-system development depends on accumulated sensory memory, formulation judgment, application knowledge, and mentorship, making capability renewal slower than ordinary laboratory recruitment. Kerry’s 2024 account describes a seven-year apprenticeship route to Society of Flavor Chemists certification, with its internal Flavor Academy operating during the first five years; Bell similarly describes certification after seven years and familiarity with more than 4,000 potential raw materials. These are professional-development benchmarks, not statutory requirements for every flavor-development position or evidence of a quantified global talent deficit.
Their significance for the 2026 baseline is timing: a trainee beginning a comparable seven-year pathway in 2026 would reach its endpoint around 2033, beyond the forecast period. An illustrative operating scenario in which 10% of planned incremental projects experience a 15% capacity-related revenue shortfall produces a 1.5% endpoint gap, consistent with approximately −0.4 percentage points of annualized friction.
Sales continue because established teams remain productive, but senior specialists must divide time between commercial development, troubleshooting, and training. Sustaining growth therefore requires staggered apprenticeships, documented formulation knowledge, application-technologist career paths, and succession planning; simply increasing headcount does not immediately replace experienced creative capacity.
Challenges Impact Analysis
| Challenge | (~) % CAGR Friction Drag | Geographic Relevance | Mitigation Horizon |
|---|---|---|---|
| Flavorist capability renewal | −0.4 pp | US, Western Europe; APAC hubs | Long term (≥ 4 years) |
| Matrix-specific sensory validation | −0.5 pp | North America, EU, Japan | Medium term (2–4 years) |
| Shelf-life performance translation | −0.4 pp | EU, US; tropical APAC | Medium term (2–4 years) |
| Traceability data interoperability | −0.3 pp | US core; exporting supply chains | Medium term (2–4 years) |
| Digital sensory model transfer | −0.3 pp | North America, Europe, China | Medium term (2–4 years) |
Geopolitical Impact Analysis
Geopolitical Impact of Recent Wars on the Flavor Systems Market
The ongoing conflicts in the Middle East, continued disruption in the Red Sea, and the Russia-Ukraine war are creating cost and supply-chain risks for the global Flavor Systems Market. These conflicts affect shipping routes, energy prices, freight charges, and the availability of agricultural and chemical inputs used in flavor production.
Flavor manufacturers may face higher costs for transporting natural extracts, aroma compounds, solvents, and packaging materials. According to the United Nations Conference on Trade and Development (UNCTAD), more than 80% of world merchandise trade by volume moves by sea, making maritime security important for global ingredient supply chains. In March 2026, UNCTAD reported that disruptions in the Strait of Hormuz pushed Brent crude oil above USD 90 per barrel and increased tanker freight and war-risk insurance costs.
Higher energy and logistics costs can increase manufacturing expenses for flavor producers, particularly those dependent on imported ingredients and international distribution. Longer shipping times can also delay deliveries and complicate inventory planning for food and beverage manufacturers. In response, companies may diversify suppliers, increase safety stocks, and strengthen regional sourcing. Although these measures can reduce supply risks, they may increase operating costs.
Regional Insights
Dominating Region: Asia-Pacific
Asia-Pacific held the dominant position in the Flavor Systems Market in 2025, accounting for 38.67% of the market, valued at USD 2.7 billion, according to the supplied market figures. Regional demand is supported by a large food and beverage manufacturing base, expanding packaged-food consumption, and the development of new beverage, bakery, dairy, and confectionery products. Flavor suppliers benefit from demand for fruit, sweet, savory, roasted, and locally inspired taste profiles.
China provides an important indicator of regional industrial activity. According to its National Bureau of Statistics, China’s value added from processing agricultural and related products increased by 5.6% in 2025. This expansion supports the wider food-processing ecosystem that uses flavor ingredients.
China’s official statistics also show that retail sales of grain, oil, and food products increased by 9.3% in 2025, while beverage retail sales rose by 1.0%. These figures indicate continued activity across major food and beverage categories, supporting demand for flavor ingredients used in product development.
Beyond established markets, Southeast Asia offers opportunities for flavor suppliers through expanding food manufacturing, changing consumption patterns, and demand for convenient packaged products. The Association of Southeast Asian Nations’ official statistical publications provide regional data on trade, investment, and economic activity, which help assess the industrial environment for ingredient suppliers. Source: ASEAN Statistical Highlights 2025.
Key Regions and Countries Insights
- North America
- US
- Canada
- Europe
- Germany
- France
- The UK
- Spain
- Italy
- Rest of Europe
- Asia Pacific
- China
- Japan
- South Korea
- India
- Australia
- Rest of APAC
- Latin America
- Brazil
- Mexico
- Rest of Latin America
- Middle East & Africa
- GCC
- South Africa
- Rest of MEA
Key Players Analysis
Apex Flavors Inc. is a United States-based manufacturer of flavors and extracts for food and beverage applications. Its product portfolio includes natural and artificial flavors, vanilla extracts, fruit profiles, and customized formulations for alcoholic and non-alcoholic beverages, bakery products, and desserts. The company offers hundreds of flavor options and supports customer-specific formulation requirements. Its official website states that orders can be shipped within 10 business days, supporting customers that require flexible order quantities and timely supply.
Charles H. Baldwin and Sons is a United States-based producer of vanilla extracts and specialty food ingredients. Its product range includes vanilla beans, baking ingredients, sauces, mixes, and table syrups for food and beverage applications. The company was established in 1888, giving it a long history in the flavoring and baking ingredient business. Its focus on vanilla products and traditional food ingredients supports customers seeking established flavor profiles for commercial and specialty food preparation.
E.A. Weber and Co., operating as Weber Flavors, is a United States-based flavor manufacturer established in 1902. The company develops customized flavor solutions for food, beverages, and dietary supplements, with products including vanilla extracts, natural fruit flavors, liquid flavors, powdered flavors, and oil-soluble formulations. Its capabilities also include spray-dried flavors and specialty bases for frozen desserts. A United States Department of Agriculture technical report listed 94 certified flavors for Edgar A. Weber and Company under its organic handling evaluation. This reflects its range of certified flavor products.
Top Key Players Outlook
- Apex Flavors Inc.
- Charles H. Baldwin and Sons
- E.A. Weber and Co.
- Eurovanille
- Lochhead Manufacturing Company
- MacTaggarts Brand
- McCormick and Company Inc.
- Mikoya Kasho Co. Ltd.
- Rodelle Inc.
- SAMBIRANO AROMATIC
- Seamore Holding BV
- Celtic Sea Spice Company Ltd
- Other Key Players
Recent Developments
- In January 2026, McCormick reported fiscal 2025 Flavor Solutions sales of USD 2.89 billion, up 0.5% year over year, while segment operating income reached USD 359.1 million, compared with USD 329.5 million in 2024.
- The 53,000-square-foot facility was designed to increase production capacity and improve delivery times, with planned daily capacity of up to 47,000 gallons of liquid flavors and 22,000 pounds of powdered flavors at project completion.
Report Scope
| Report Features | Description |
|---|---|
| Market Value (2025) | USD 7.0 Bn |
| Forecast Revenue (2035) | USD 10.8 Bn |
| CAGR (2026-2035) | 4.5% |
| Base Year for Estimation | 2025 |
| Historic Period | 2020-2024 |
| Forecast Period | 2026-2035 |
| Report Coverage | Revenue Forecast, Market Dynamics, Competitive Landscape, Recent Developments |
| Segments Covered | By Type (Brown, Dairy, Herbs & Botanicals, Fruits & Vegetables, Others), By Source Type (Nature-Identical Flavours, Artificial Flavours, Natural Flavours), By Form (Dry, Liquid, By Application, Bakery and Confectionery, Beverages, Dairy and Frozen Dessert, Others) |
| Regional Analysis | North America – US, Canada; Europe – Germany, France, The UK, Spain, Italy, Rest of Europe; Asia Pacific – China, Japan, South Korea, India, Australia, Singapore, Rest of APAC; Latin America – Brazil, Mexico, Rest of Latin America; Middle East & Africa – GCC, South Africa, Rest of MEA |
| Competitive Landscape | Apex Flavors Inc., Charles H. Baldwin and Sons, E.A. Weber and Co., Eurovanille, Lochhead Manufacturing Company, MacTaggarts Brand, McCormick and Company Inc., Mikoya Kasho Co. Ltd., Rodelle Inc., SAMBIRANO AROMATIC, Seamore Holding BV, Celtic Sea Spice Company Ltd, Other Key Players |
| Customization Scope | Customization for segments, region/country-level will be provided. Moreover, additional customization can be done based on the requirements. |
| Purchase Options | We have three licenses to opt for: Single User License, Multi-User License (Up to 5 Users), Corporate Use License (Unlimited User and Printable PDF) |








