


Report Overview
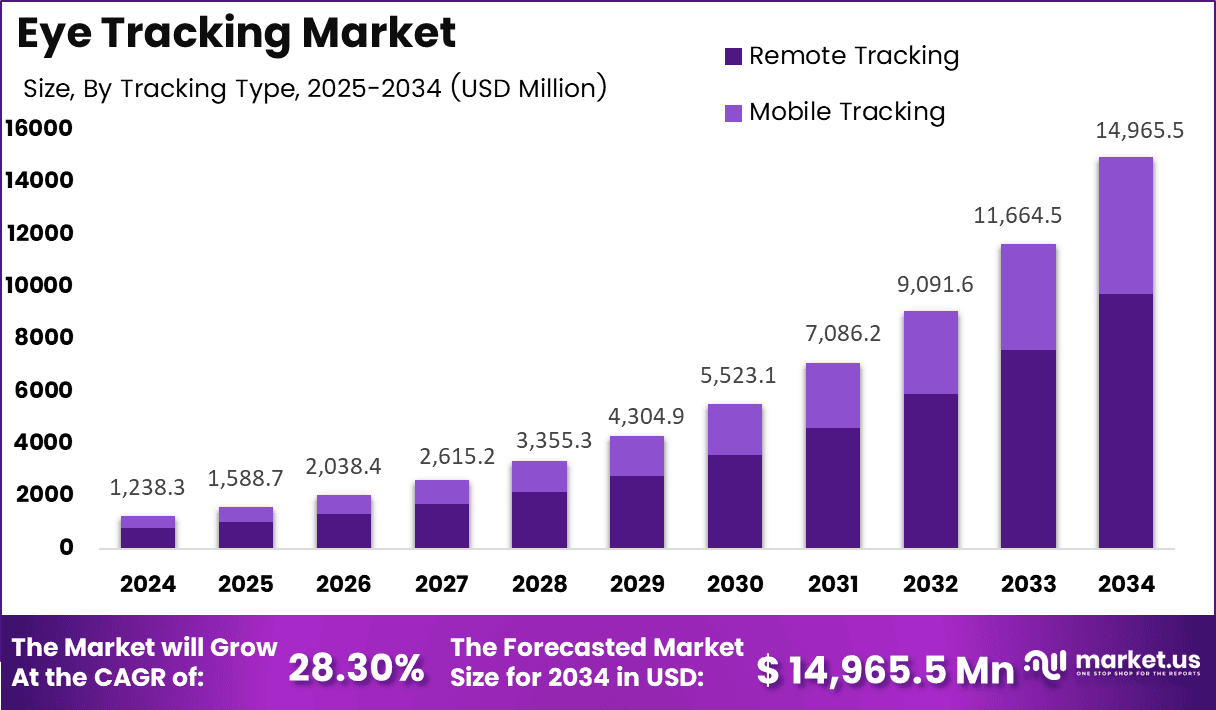
In 2024, the Global Eye Tracking Market was valued at USD 1,238.3 million. The market is projected to grow at a CAGR of 28.3% during 2025–2034, reaching approximately USD 14,965.5 million by 2034. North America dominated the global market in 2024, accounting for the total market share and generating approximately USD 495.3 million in revenue.
Eye tracking demand is rising with the rapid growth of consumer electronics, gaming, and AR-VR devices. Worldwide smartphone shipments increased 6.4% in 2024 to reach 1.24 billion units, while global AR-VR headset shipments grew 10% during the same year. As more devices add cameras and sensors, eye tracking is increasingly used for screen control, power management, and improved visual interaction.
Gaming is another major growth driver. Global gaming industry revenue reached USD 221 billion in 2024, supported by online multiplayer and cloud gaming. Eye tracking helps gaming headsets and monitors respond to where users are looking, improving speed, interaction, and immersion. India’s electronics production also increased nearly six-fold, from ₹1.9 lakh crore in 2014–15 to ₹11.3 lakh crore in 2024–25.
Key Takeaways
- The Global Eye Tracking Market was valued at USD 1,238.3 million in 2024 and is projected to reach USD 14,965.5 million by 2034, growing at a 28.3% CAGR.
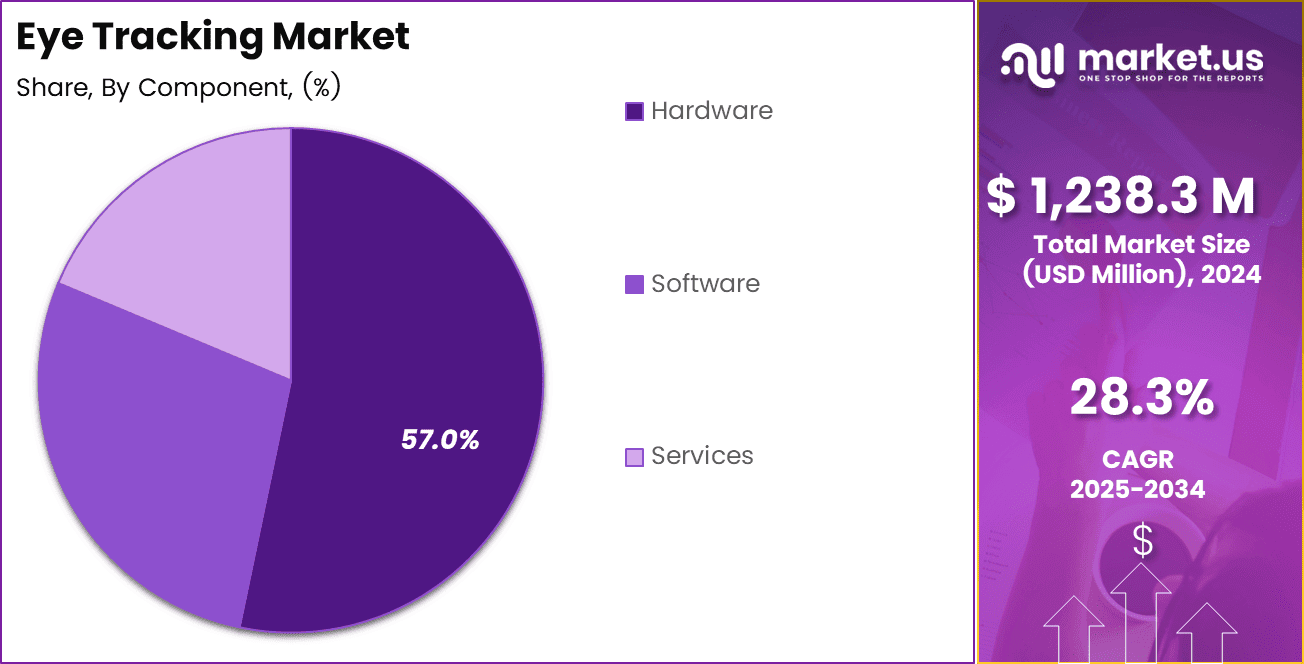
- Hardware led the component segment with a 57% share due to strong demand for cameras, illuminators, displays, processors, and tracking equipment.
- Remote Tracking dominated the tracking-type segment with a 65% share because of its suitability for controlled research, clinical, retail, and usability environments.
- Retail and Advertisement accounted for 25% of industry demand as brands increasingly use eye tracking to measure consumer attention and improve campaigns, packaging, and product placement.
- North America dominated the market in 2024, generating approximately USD 495.3 million in revenue.
Role of Generative AI
Generative AI is enhancing the development of eye-tracking technologies by improving algorithm accuracy and efficiency. It helps in designing sophisticated models that predict eye movement, particularly for remote and mobile tracking applications. This improves performance across various industries, including healthcare, automotive, and marketing.
In addition, AI enables personalized user experiences by analyzing eye movement data and adapting interfaces in real-time. It supports diagnostic advancements in healthcare, such as detecting early signs of neurodegenerative diseases. Generative AI also streamlines the development process, reducing costs and accelerating innovation, thus expanding the application scope of eye-tracking technology.
By Component
Hardware dominates with 57% due to dedicated sensors delivering accurate low-latency measurements.
Hardware leads the component split with 57% because buyers first need a physical system that captures eye position with steady accuracy and low delay. Research teams, vehicle makers, hospitals, and usability labs also buy cameras, illuminators, mounts, displays, and processors before they can collect data or run analysis.
Tobii Pro Lab supports this hardware-led work and has appeared in more than 800 peer-reviewed publications, demonstrating how a proven device-and-software setup helps buyers justify their purchase decisions. Software will grow fastest as customers seek more value from installed cameras. Vendors can add webcam tracking, analysis tools, cloud access, and study management without shipping another sensor.
By Tracking Type
Remote Tracking dominates at 65% because fixed displays support repeatable laboratory measurements.
Remote tracking controls 65% of the tracking-type split because it works from a fixed screen or camera position and gives researchers a stable view of the user. That arrangement suits laboratory studies, retail tests, clinical screening, simulator work, and office-based product research, where teams need the same distance, lighting, and task for every participant.
The International Telecommunication Union counted 5.5 billion people online in 2024, after an increase of 227 million from the prior year. This broad connected base supports phone-linked studies, lighter head-mounted systems, and software that processes data away from the lab.
By Industry Vertical
Retail and Advertisement dominate with 25% due to advertising teams paying for attention evidence.
Retail and advertisement hold 25% of industry demand because brands and agencies need direct proof of what people notice before they spend on media, packaging, websites, stores, and product displays. Eye tracking turns viewing behavior into usable evidence: teams can test whether shoppers find a price, logo, call-to-action, or shelf item, then change a campaign before full launch.
The IAB reported US digital advertising revenue of $259 billion in 2024, up 15% year on year, giving buyers a large and growing pool of spending to improve. Consumer-electronics makers also use the tools, but retail users can apply them across many campaigns and customer journeys. Automotive and transportation will grow fastest as driver-monitoring systems move from development projects into vehicle production.
Smart Eye reported automotive sales of SEK 194.9 million in 2025, a 45% increase, and recorded 370 design wins. Its systems already operate in more than 3 million vehicles. Safety rules and customer demand for driver assistance push car makers to add in-cabin sensing, while per-vehicle license fees create recurring supplier revenue.
Key Market Segments
By Component
- Hardware
- Software
- Services
By Tracking Type
- Remote Tracking
- Mobile Tracking
By Industry Vertical
- Retail and Advertisement
- Consumer Electronics
- Healthcare
- Government, Defense, and Aerospace
- Automotive and Transportation
- Others
Regional Analysis
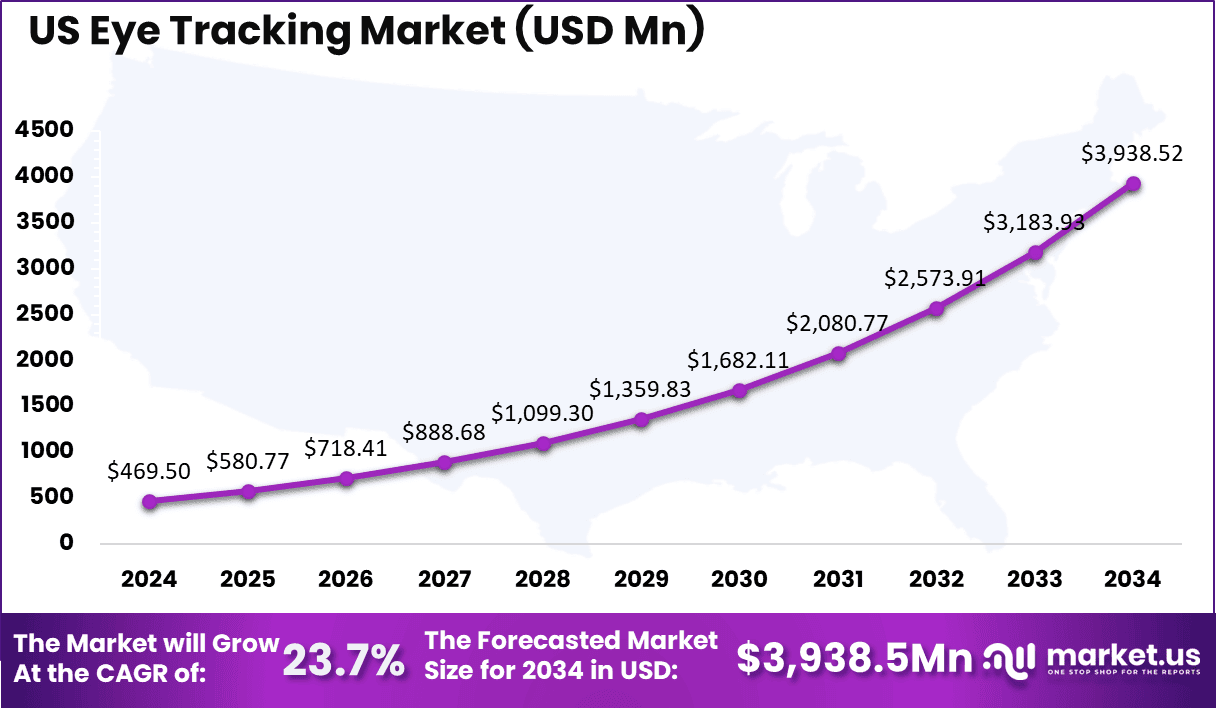
North America leads the Eye Tracking Market with a 40% share and a baseline value of USD 495.3 million, supported by strong enterprise technology spending, usability research, healthcare adoption, and automotive integration. In Europe, new vehicle safety requirements became applicable to all new vehicles from 7 July 2024, supporting wider use of driver-monitoring and in-cabin sensing technologies.
Asia Pacific is the fastest-growing region, led by China, Japan, South Korea, India, and Australia. Strong electronics supply chains, vehicle production, smartphone adoption, and semiconductor capabilities support demand for embedded eye-tracking systems. India also offers a cost-efficient software and engineering base, although price sensitivity favors webcam and mobile-based solutions.
US Market Size
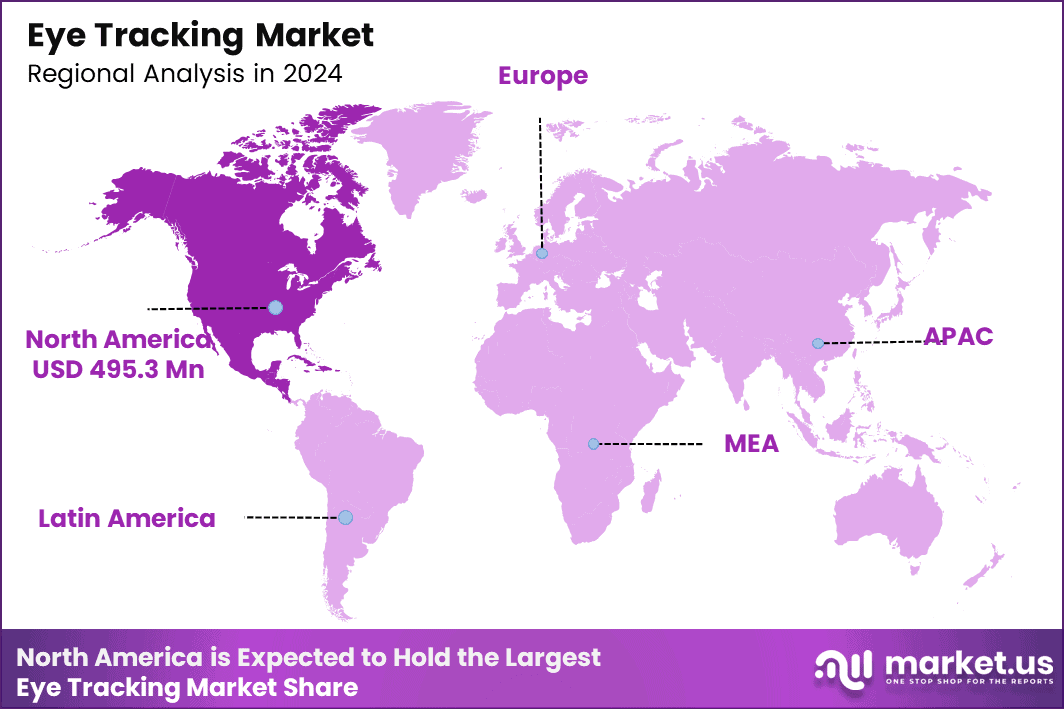
The U.S. eye tracking market is set for robust expansion, starting at USD 469.5 million in 2024 and climbing steadily to USD 3,938.52 million by 2034, fueled by a 23.7% CAGR. This growth reflects surging demand in healthcare for diagnostics and assistive tech, alongside gaming and automotive applications, where real-time gaze analysis boosts user experiences.
Globally, the market for advanced tracking technologies is expanding, driven by rising digital demands and innovation. Various regions are adopting these solutions, enhancing user experiences across industries. This growth highlights a shift towards smarter interfaces, with potential for widespread integration, shaping a dynamic and evolving technological landscape worldwide.
The 2024 eye tracking market shows North America leading with a market value of USD 495.3 million, expected to hold the largest share. Europe, APAC, MEA, and Latin America follow, with each region contributing to the global market. North America’s dominance is driven by advanced technology adoption and research.
Key Regions and Countries
- North America
- US
- Canada
- Europe
- Germany
- France
- The UK
- Spain
- Italy
- Rest of Europe
- Asia Pacific
- China
- Japan
- South Korea
- India
- Australia
- Rest of APAC
- Latin America
- Brazil
- Mexico
- Rest of Latin America
- Middle East & Africa
- GCC
- South Africa
- Rest of MEA
Market Dynamics
Drivers
| Driver | (~) % Impact on CAGR Forecast | Geographic Relevance | Impact Timeline |
|---|---|---|---|
| Vehicle Safety Mandates | +3.0% | Europe, North America, Asia Pacific | Short term (2 years or less) |
| Automotive Design-Win Conversion | +2.4% | Europe, Asia Pacific | Medium term (2 to 4 years) |
| Digital Advertising Measurement | +1.8% | North America, Europe, Asia Pacific | Short term (2 years or less) |
| Research Workflow Digitization | +1.5% | Global | Medium term (2 to 4 years) |
| Immersive Interface Adoption | +1.2% | North America, Europe, Asia Pacific | Medium term (2 to 4 years) |
Vehicle Safety Mandates
Vehicle safety mandates create the strongest active demand driver because they move eye-tracking capability from an optional feature into a vehicle-program requirement. The European Commission applied new General Safety Regulation requirements to all new motor vehicles sold in the EU from 7 July 2024, creating a direct route for attention-monitoring and warning systems in new vehicle designs.
The European Commission also estimates that the wider safety package can help save more than 25,000 lives by 2038, which strengthens the commercial case for OEM spending on in-cabin sensing. Germany’s Federal Ministry for Digital and Transport lists further staged vehicle-safety requirements through 7 January 2026 and 7 July 2026, keeping procurement active across model cycles.
Restraints
| Restraint | (~) % Impact on CAGR Forecast | Geographic Relevance | Impact Timeline |
|---|---|---|---|
| Biometric Data Compliance Costs | -2.2% | Europe, North America | Short term (2 years or less) |
| High Enterprise Deployment Cost | -1.7% | Global | Short term (2 years or less) |
| Public-Sector Procurement Delays | -1.4% | North America, Europe | Medium term (2 to 4 years) |
| Fragmented Medical Reimbursement | -1.1% | North America, Europe, Asia Pacific | Medium term (2 to 4 years) |
| Consumer Privacy Concerns | -0.9% | Global | Short term (2 years or less) |
Biometric Data Compliance Costs
Biometric data compliance creates the largest current restraint because eye-gaze records can reveal behavior, attention, health signals, and location context, forcing buyers to limit deployments until they can prove lawful collection and retention. The GDPR penalty framework allows authorities to impose fines up to €20 million or 4% of worldwide annual turnover for severe breaches, which makes legal review and data-governance spending a board-level issue.
The European Data Protection Board directs small firms to establish accountability, security, and lawful-processing controls, adding fixed compliance work before a pilot can scale. The EU AI Act began prohibiting certain unacceptable-risk AI practices on 2 February 2025, including tightly constrained biometric uses in public settings.
Challenges
| Challenge | (~) % CAGR | Geographic Relevance | Mitigation Horizon |
|---|---|---|---|
| Cross-Condition Calibration | -1.8% | Global | Medium term (2 to 4 years) |
| Algorithm Bias Validation | -1.5% | Global | Medium term (2 to 4 years) |
| Optics Supply Qualification | -1.2% | Asia Pacific, Europe, North America | Medium term (2 to 4 years) |
| Cybersecurity Lifecycle Management | -1.0% | Global | Long term (4 years or more) |
| Specialist Engineering Capacity | -0.8% | Global | Long term (4 years or more) |
Cross-Condition Calibration
Cross-condition calibration remains the leading operational challenge because eye-tracking accuracy can change with lighting, eyewear, skin tone, eye shape, camera position, vibration, and user movement. NIST has tested demographic differences across nearly 200 facial-recognition algorithms from nearly 100 developers, using 4 photo collections containing more than 18 million images; this scale shows why computer-vision suppliers need broad validation data rather than narrow laboratory samples.
NIST’s demographic-effects work also identifies measurable performance differences across user groups, which increases the test burden for gaze-estimation systems used in safety, healthcare, and employment settings. NIST released Cybersecurity Framework 2.0 on 26 February 2024 and added stronger governance and supply-chain focus, increasing the need to secure calibration data and software updates.
Opportunities
| Opportunity | (~) % Potential CAGR Upside | Geographic Relevance | Execution Window |
|---|---|---|---|
| Accessible Digital Interaction | +2.5% | Europe, North America, Asia Pacific | Medium term (2 to 4 years) |
| Webcam Software Subscriptions | +2.0% | Global | Short term (2 years or less) |
| Industrial Skills Training | +1.6% | North America, Europe, Asia Pacific | Medium term (2 to 4 years) |
| Clinical Home Monitoring | +1.3% | North America, Europe | Long term (4 years or more) |
| Synthetic Validation Data | +1.1% | Global | Medium term (2 to 4 years) |
Accessible Digital Interaction
Accessible digital interaction represents a major untapped opportunity for eye tracking. WHO estimates that 1.3 billion people, or 16% of the global population, experience significant disability, creating demand for hands-free navigation, communication, education, and workplace tools.
The European Accessibility Act took effect in June 2025, while the UN Convention on the Rights of Persons with Disabilities also supports broader access to digital technologies. Webcam-based eye tracking could reduce hardware costs by an estimated 60%–80% compared with dedicated sensor systems. Recurring software licenses, onboarding, and accessibility support could also improve gross margins by around 15–25 percentage points.
Key Player Analysis
Tier-1 leaders include Tobii AB, Seeing Machines, and Smart Eye, which together represent an estimated 70–80% of revenue among the identified publicly reporting specialist suppliers. Tobii remains the scale leader, with FY2025 revenue of SEK 834 million, compared with SEK 403.7 million for Smart Eye and US$62.3 million for Seeing Machines.
Tobii invested SEK 181 million in R&D, equal to 21.7% of sales, while reporting EBIT of negative SEK 303 million and investing outflows of SEK 177 million. Its cost-reduction programme delivered SEK 43 million in Q4 savings, alongside a strategic push into automotive driver-monitoring licensing.
Seeing Machines generated FY2025 revenue of US$62.34 million, gross profit of US$39.2 million, and a net loss of US$25.3 million. R&D spending reached US$18.95 million, or 30.4% of revenue, while automotive royalty revenue exceeded US$40 million and increased 30%. Smart Eye recorded sales of SEK 403.7 million, up 14%, with Automotive revenue rising 45% to SEK 194.9 million and Behavioral Research contributing SEK 208.8 million.
Smart Eye spent SEK 205.9 million on R&D, equal to 51.0% of sales, and raised SEK 294.0 million in long-term debt while reporting a SEK 172.8 million net loss. Tier-2 specialists such as SR Research, iMotions, Gazepoint, EyeTech Digital Systems, EyeTracking Inc., Mirametrix, LC Technologies, Ergoneers, and Eyegaze compete mainly through application specialization in research, accessibility, human-factors testing, and software workflows.
Top Key Players
- Tobii AB
- SR Research Ltd.
- iMotions A/S
- Gazepoint Research Inc.
- EyeTech Digital Systems, Inc.
- EyeTracking, Inc.
- Mirametrix Inc.
- Seeing Machines Ltd.
- Smart Eye AB
- LC Technologies, Inc.
- Ergoneers GmbH
- Eyegaze Inc.
- Other Key Players
Recent Development
- In 2025, Smart Eye AB secured its first-ever Driver Monitoring System (DMS) design win from a major Japanese OEM in April 2025, valued at SEK 200 million based on product lifecycle projections, with upsell potential as a software Tier-1 supplier exceeding SEK 2.4 billion; total design wins reached 361 from 23 OEMs, with combined lifetime value surpassing SEK 8.535 billion.
- In 2025, Tobii AB initiated a cost-reduction program in Q3 2025 targeting SEK 100 million in savings over four quarters, while full-year 2025 consolidated revenue contracted 3% year-over-year to USD 85.05 million (from USD 87.40 million in 2024), with capital expenditure suppressed by 50% to USD 17.74 million.
Report Scope
| Report Features | Description |
|---|---|
| Market Value (2024) | USD 1,238.3 Mn |
| Forecast Revenue (2034) | USD 14,965.5 Mn |
| CAGR(2025-2034) | 28.3% |
| Base Year for Estimation | 2024 |
| Historic Period | 2020-2023 |
| Forecast Period | 2025-2034 |
| Report Coverage | Revenue forecast, AI impact on Market trends, Share Insights, Company ranking, competitive landscape, Recent Developments, Market Dynamics, and Emerging Trends |
| Segments Covered | By Component (Hardware, Software, Services), By Tracking Type (Remote Tracking, Mobile Tracking), By Industry Vertical (Retail and Advertisement, Consumer Electronics, Healthcare, Government, Defense, and Aerospace, Automotive & Transportation, Others) |
| Regional Analysis | North America – US, Canada; Europe – Germany, France, The UK, Spain, Italy, Russia, Netherlands, Rest of Europe; Asia Pacific – China, Japan, South Korea, India, New Zealand, Singapore, Thailand, Vietnam, Rest of Latin America; Latin America – Brazil, Mexico, Rest of Latin America; Middle East & Africa – South Africa, Saudi Arabia, UAE, Rest of MEA |
| Competitive Landscape | Tobii AB, SR Research Ltd., iMotions A/S, Gazepoint Research Inc., EyeTech Digital Systems, Inc., EyeTracking, Inc., Mirametrix Inc., Seeing Machines Ltd., Smart Eye AB, LC Technologies, Inc., Ergoneers GmbH, Eyegaze Inc., Other Key Players |
| Customization Scope | Customization for segments, region/country-level will be provided. Moreover, additional customization can be done based on the requirements. |
| Purchase Options | We have three licenses to choose from: Single User License, Multi-User License (Up to 5 Users), Corporate Use License (Unlimited Users, Printable PDF) |





































