
Quick Navigation
Report Overview
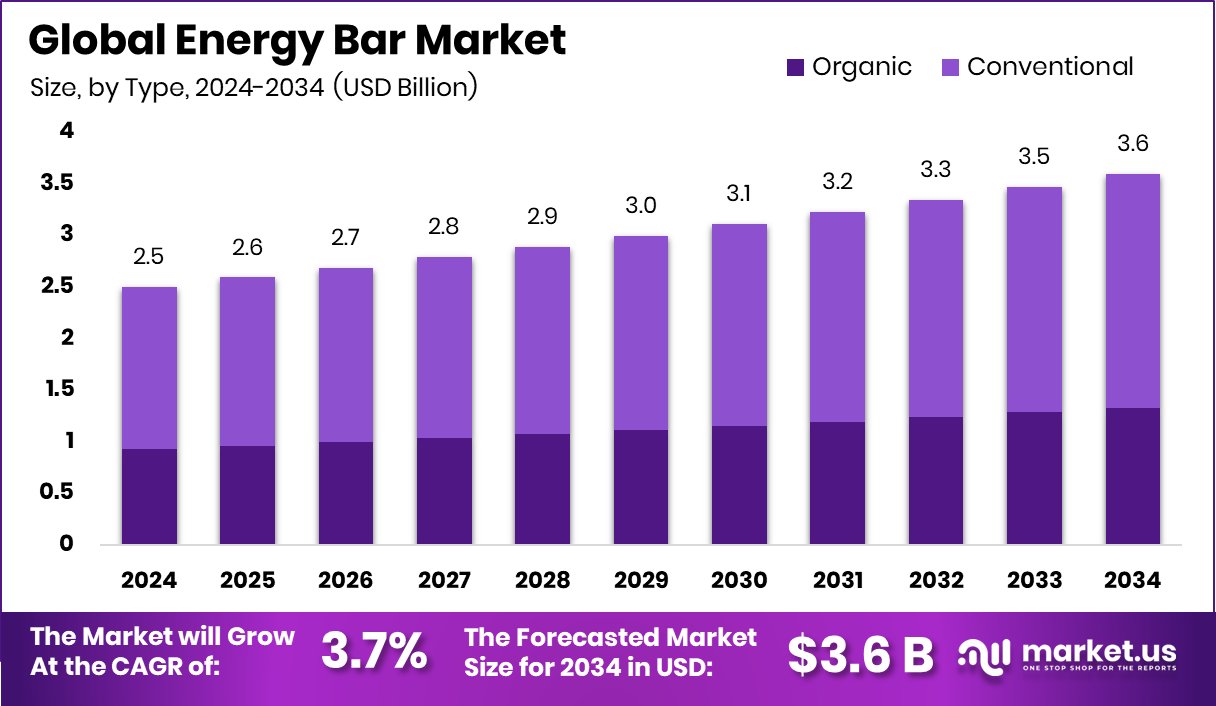
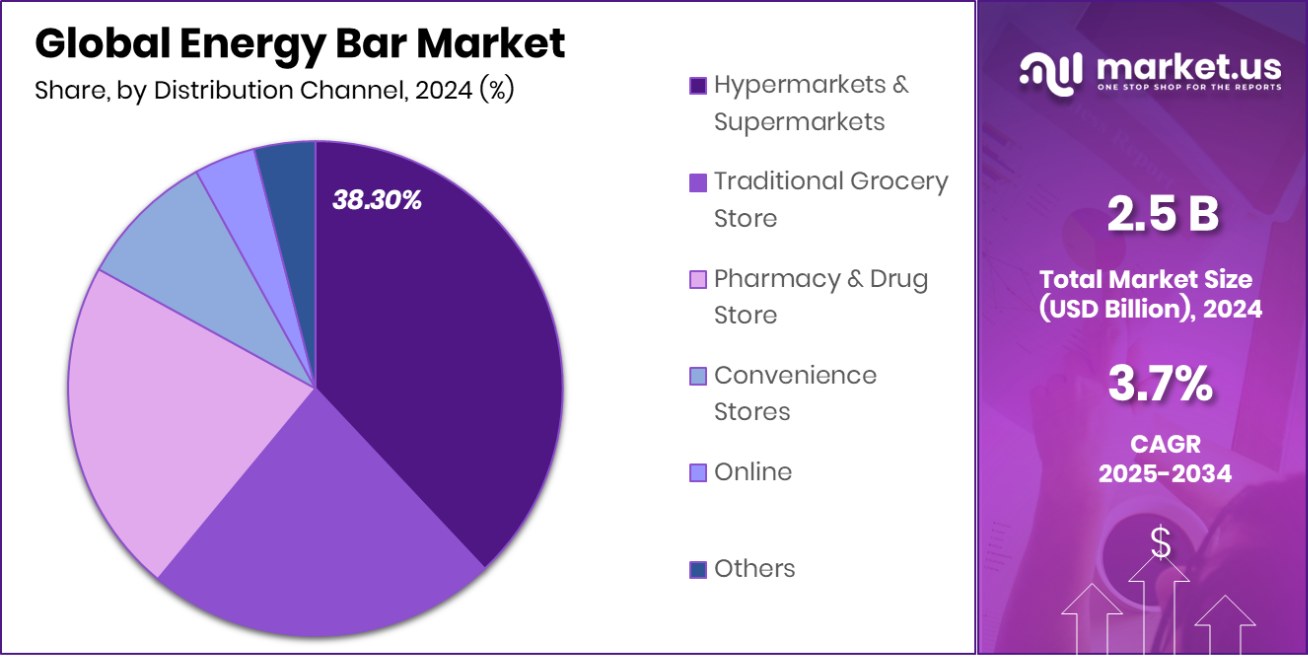
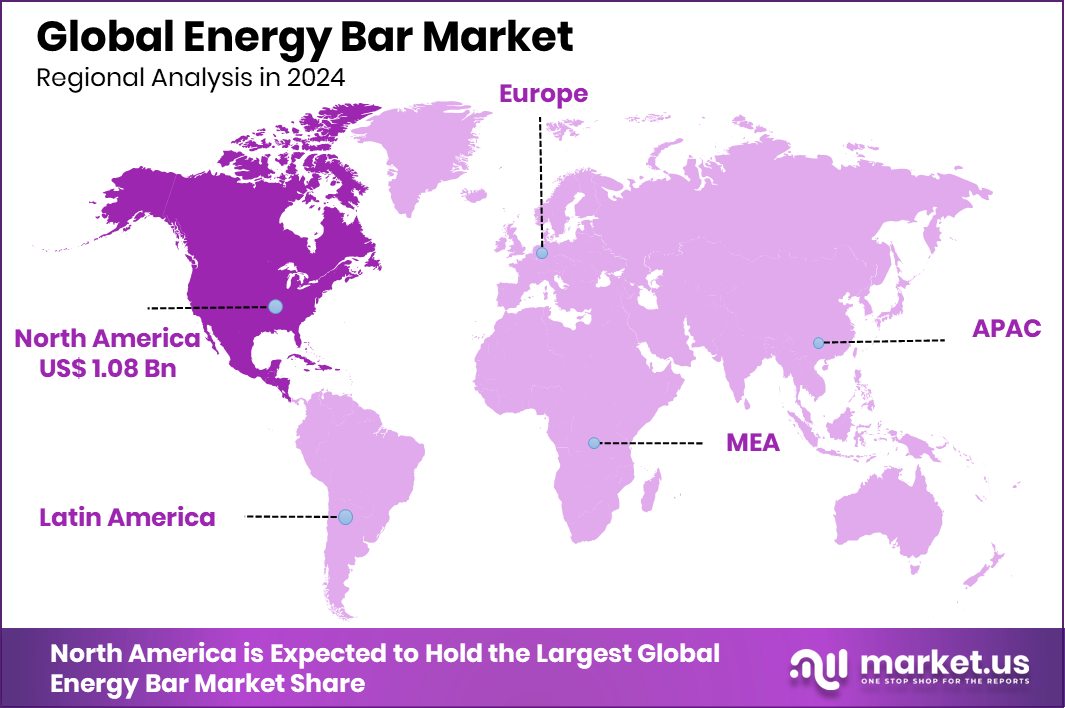
The Global Energy Bar Market is expected to be worth around USD 3.6 billion by 2034, up from USD 2.5 billion in 2024, and grow at a CAGR of 3.7% from 2025 to 2034. North America contributes USD 1.08 billion, accounting for 43.30% of the global market.
An energy bar is a convenient, ready-to-eat snack designed to deliver a quick boost of energy. Typically packed with carbohydrates, proteins, fiber, and healthy fats, these bars are formulated to fuel physical activity or serve as a meal replacement.
They’re popular among athletes, busy professionals, and fitness enthusiasts due to their portability and nutritional content. The Canadian government announced $7.3 million in funding for cereals research and market expansion through programs like AgriMarketing and AgriScience.
The energy bar market is steadily growing as more people adopt active and health-conscious lifestyles. Whether it’s a pre-workout snack or an afternoon pick-me-up, energy bars are gaining space in everyday routines. Urbanization, fast-paced work schedules, and the rise of fitness culture have made on-the-go nutrition essential, pushing consumers toward functional food options like energy bars.
One key growth factor is the rising awareness of fitness and wellness across all age groups. Consumers are becoming more mindful of their diets, looking for products that support energy, endurance, and recovery. Energy bars fit this need perfectly, offering both functionality and taste in a single pack. In 2024, global cereal production was estimated at 2,842 million tons, with wheat production projected to rise to 796 million tons in 2025, a near 1% year-on-year increase.
Demand is also fueled by diet trends such as high-protein, low-carb, and plant-based eating. This allows energy bars to cater to various dietary needs without sacrificing convenience or flavor. Moreover, the inclusion of superfoods and clean labels is driving consumer trust.
Key Takeaways
- The Global Energy Bar Market is expected to be worth around USD 3.6 billion by 2034, up from USD 2.5 billion in 2024, and grow at a CAGR of 3.7% from 2025 to 2034.
- Conventional energy bars dominate the market, capturing 63.30% due to affordability and wide availability.
- Cereals and grains are as primary ingredients in energy bars, contributing to 37.20% market share.
- Hypermarkets and supermarkets dominate energy bar sales, accounting for 38.30% of the global distribution share.
- Energy Bar market in North America reaches USD 1.08 billion, with a 43.30% share.
By Type Analysis
Conventional energy bars dominate the market with a 63.30% revenue share.
In 2024, Conventional held a dominant market position in the By Type segment of the Energy Bar Market, with a 49.2% share. This significant lead can be attributed to its broad consumer appeal, widespread availability, and cost-effective production compared to organic alternatives.
Conventional energy bars benefit from established distribution channels, consistent product formulations, and competitive pricing, which collectively support their sustained demand across various demographics.
Consumers seeking quick energy boosts during workouts or between meals often favor conventional options due to their familiarity and accessibility in supermarkets, gyms, and convenience stores.
Additionally, major brands in this category have built strong brand loyalty through extensive marketing and product diversification. Although organic bars are gaining traction, their higher pricing and limited retail penetration have restricted their overall market share.
Conventional bars are also preferred in mass-market applications such as vending machines, sports events, and travel outlets. The segment’s performance is further strengthened by product innovations in flavors, protein content, and dietary considerations like gluten-free or low-sugar variants.
By Ingredient Analysis
Cereals and grains account for 37.20% of energy bar ingredients globally.
In 2024, Cereals and Grains held a dominant market position in the By Ingredient segment of the Energy Bar Market, with a 49.2% share. This leadership is primarily driven by the widespread consumer preference for energy bars formulated with oats, rice crisps, wheat flakes, and other cereal-based ingredients that are perceived as natural sources of sustained energy.
Cereals and grains are valued for their nutritional density, offering essential carbohydrates and dietary fiber that contribute to satiety and prolonged energy release. Their versatility allows manufacturers to blend them with nuts, fruits, and sweeteners to create products appealing to a broad audience, from athletes to busy professionals and students. Additionally, these ingredients help achieve a desirable texture and shelf stability, supporting product innovation and longer market viability.
Energy bars featuring cereals and grains are also more cost-effective to produce at scale, making them attractive to both premium and budget-friendly brands. Their familiarity among consumers further boosts purchase frequency.
By Distribution Channel Analysis
Hypermarkets and supermarkets dominate sales, holding 38.30% of the distribution share.
In 2024, Hypermarkets and Supermarkets held a dominant market position in the By Distribution Channel segment of the Energy Bar Market, with a 49.2% share. This channel’s strong foothold stems from its extensive retail footprint, allowing consumers to access a wide range of energy bar brands and product types under one roof. Shoppers benefit from the convenience of in-store purchases, competitive pricing, and promotional offers, which collectively drive higher volume sales.
The dominance of hypermarkets and supermarkets is further supported by their strategic placement in urban and semi-urban areas, catering to daily and weekly grocery needs. These retail formats provide ample shelf space, enabling better visibility and impulse purchases of energy bars, particularly near checkout counters. Additionally, consumers appreciate the ability to compare ingredients, flavors, and nutritional content in person before making a purchase.
Major brands prioritize this channel for product launches and promotional campaigns due to its ability to deliver immediate reach and visibility. Retailers also collaborate with manufacturers to offer bundle deals and discounts that appeal to price-sensitive consumers.
Key Market Segments
By Type
- Organic
- Conventional
By Ingredient
- Cereals and Grains
- Nuts and Seeds
- Fruits
- Protein
- Chocolate Coated
- Others
By Distribution Channel
- Hypermarkets and Supermarkets
- Traditional Grocery Store
- Pharmacy and Drug Store
- Convenience Stores
- Online
- Others
Driving Factors
Rising Health Awareness is Boosting Energy Bar Sales
One of the top driving factors for the energy bar market in 2024 is the rising health awareness among consumers. People today are more conscious about what they eat, and they prefer snacks that offer nutritional value along with convenience. Energy bars fit perfectly into this trend, offering a quick source of protein, fiber, and essential nutrients without needing preparation.
With busy lifestyles, especially among urban populations, demand has grown for on-the-go food options that support fitness and wellness goals. Additionally, consumers are reading labels more carefully and choosing products that align with their diets—whether it’s low sugar, high protein, or gluten-free.
Restraining Factors
High Product Prices Limit Mass Consumer Reach
A major restraining factor in the energy bar market is the high product pricing, which limits its appeal to a broader consumer base. While health-conscious individuals in urban areas may willingly pay a premium, many middle-income and rural consumers find energy bars expensive compared to traditional snacks.
This price gap creates a barrier to market penetration, especially in developing economies where affordability plays a key role in daily purchases.
Additionally, organic or high-protein variants often cost even more, narrowing the target audience further. Despite rising awareness around nutrition, the lack of cost-effective options prevents many people from making energy bars a regular part of their diet. For wider adoption, manufacturers must focus on value pricing and affordable pack sizes.
Growth Opportunity
Rising Demand for Plant-Based Energy Bar Products
The biggest growth opportunity in the energy bar market is the growing demand for plant-based products. Consumers today want healthier snacks, and plant-based energy bars match perfectly with this trend. More people are adopting vegan, vegetarian, or flexitarian lifestyles, increasing their interest in snacks made without animal products.
Bars made from ingredients like nuts, seeds, and natural sweeteners are becoming very popular among younger, health-conscious buyers. Brands can win customers by clearly highlighting the health benefits, such as higher protein content, fiber, vitamins, and natural ingredients.
Companies investing in plant-based options will attract environmentally aware consumers looking for sustainable products. Expanding product variety and improving taste profiles will further boost sales and customer loyalty in this fast-growing segment.
Latest Trends
Rising Demand for Plant-Based Energy Bars
The Energy Bar market has witnessed a significant surge in demand for plant-based options. With an increasing number of consumers becoming health-conscious and environmentally aware, plant-based energy bars have gained popularity as an alternative to traditional protein bars. These bars typically feature ingredients like oats, nuts, seeds, and plant-based proteins, appealing to vegans and those seeking clean-label products.
This trend is not only driven by dietary preferences but also by the rising concerns over animal welfare and sustainability. Manufacturers are now focusing on enhancing the taste and nutritional value of plant-based bars, making them more appealing to a broader audience.
Regional Analysis
North America holds 43.30% market share, valued at USD 1.08 billion.
The Energy Bar market is segmented across five key regions: North America, Europe, Asia Pacific, Middle East & Africa, and Latin America. North America leads the market with a dominant share of 43.30%, translating to a market value of USD 1.08 billion. This growth is driven by the region’s high consumer demand for on-the-go, healthy snacks, coupled with a robust supply of innovative products across various dietary preferences, including plant-based and protein-rich bars.
Europe follows closely with a significant share in the market, driven by growing awareness of healthy lifestyles and increasing adoption of nutritional snacking habits. The rising popularity of clean-label and organic energy bars among European consumers is fueling the market in this region.
The Asia Pacific region is witnessing rapid growth, especially due to increasing urbanization and a shift toward healthier eating habits. With a rising middle class, there is an emerging demand for energy bars as convenient, nutritious snacks.
Latin America and the Middle East & Africa regions are experiencing slower but steady growth, primarily driven by changing dietary habits and increasing disposable incomes. However, these regions still represent smaller market shares compared to North America and Europe.
Key Regions and Countries
- North America
- US
- Canada
- Europe
- Germany
- France
- The UK
- Spain
- Italy
- Rest of Europe
- Asia Pacific
- China
- Japan
- South Korea
- India
- Australia
- Rest of APAC
- Latin America
- Brazil
- Mexico
- Rest of Latin America
- Middle East & Africa
- GCC
- South Africa
- Rest of MEA
Key Players Analysis
The global energy bar market in 2024 continues to evolve, driven by growing consumer demand for convenient, nutritious, and functional snacking options. Among the leading players shaping the competitive landscape are Glanbia plc, Kellanova, and Kellogg Company—each leveraging unique strengths to maintain their market positions.
Glanbia PLC has solidified its standing through its strong focus on performance nutrition. With a robust portfolio that includes leading brands like Optimum Nutrition and think!®, the company is strategically positioned to capitalize on the growing health and wellness trend. Glanbia’s innovation pipeline and targeted acquisitions in functional snacking reflect its commitment to meeting evolving consumer preferences.
Kellanova, the global snacking powerhouse formed after the strategic separation from Kellogg Company, has emerged with a renewed focus on agility and brand-centric growth. With iconic brands under its belt, Kellanova is actively investing in R&D and marketing to enhance the appeal of its energy bar offerings. Its global footprint and omnichannel strategy give it a competitive edge in reaching health-conscious consumers across regions.
Kellogg Company, Despite the spinoff, continues to wield influence in the cereal and breakfast category, which overlaps with the energy bar segment. The company’s established distribution networks, brand equity, and focus on plant-based ingredients position it well to address the demand for cleaner-label products.
Top Key Players in the Market
- BellRing Brands, Inc
- General Mills Inc.
- Glanbia plc
- Kellanova
- Kellogg Company
- Mars, Incorporated.
- McKee Foods Corporation
- Mondelez International, Inc.
- Nestlé S.A.
- NuGo Nutrition, Inc.
- Post Holdings Inc.
- PROBAR LLC
- The Simple Good Foods Company
- THG plc
Recent Developments
- In March 2025, Kellanova introduced Rice Krispies Treats Bliss bars, featuring multiple toppings like Chocolate Sea Salt Pretzel and Caramel Sea Salt Pretzel, marking a new indulgent offering in their snack lineup.
- In December 2023, General Mills introduced Nature Valley Protein Smoothie Bars, combining oats, nuts, dried fruits, and yogurt for a convenient, protein-rich snack.
Report Scope
| Report Features | Description |
|---|---|
| Market Value (2024) | USD 2.5 Billion |
| Forecast Revenue (2034) | USD 3.6 Billion |
| CAGR (2025-2034) | 3.7% |
| Base Year for Estimation | 2024 |
| Historic Period | 2020-2023 |
| Forecast Period | 2025-2034 |
| Report Coverage | Revenue Forecast, Market Dynamics, Competitive Landscape, Recent Developments |
| Segments Covered | By Type (Organic, Conventional), By Ingredient (Cereals and Grains, Nuts and Seeds, Fruits, Protein, Chocolate Coated, Others), By Distribution Channel (Hypermarkets and Supermarkets, Traditional Grocery Store, Pharmacy and Drug Store, Convenience Stores, Online, Others) |
| Regional Analysis | North America – US, Canada; Europe – Germany, France, The UK, Spain, Italy, Rest of Europe; Asia Pacific – China, Japan, South Korea, India, Australia, Singapore, Rest of APAC; Latin America – Brazil, Mexico, Rest of Latin America; Middle East & Africa – GCC, South Africa, Rest of MEA |
| Competitive Landscape | BellRing Brands, Inc, General Mills Inc., Glanbia plc, Kellanova, Kellogg Company, Mars, Incorporated., McKee Foods Corporation, Mondelez International, Inc., Nestlé S.A., NuGo Nutrition, Inc., Post Holdings Inc., PROBAR LLC, The Simple Good Foods Company, THG plc |
| Customization Scope | Customization for segments, region/country-level will be provided. Moreover, additional customization can be done based on the requirements. |
| Purchase Options | We have three licenses to opt for: Single User License, Multi-User License (Up to 5 Users), Corporate Use License (Unlimited User and Printable PDF) |


