
Quick Navigation
Report Overview
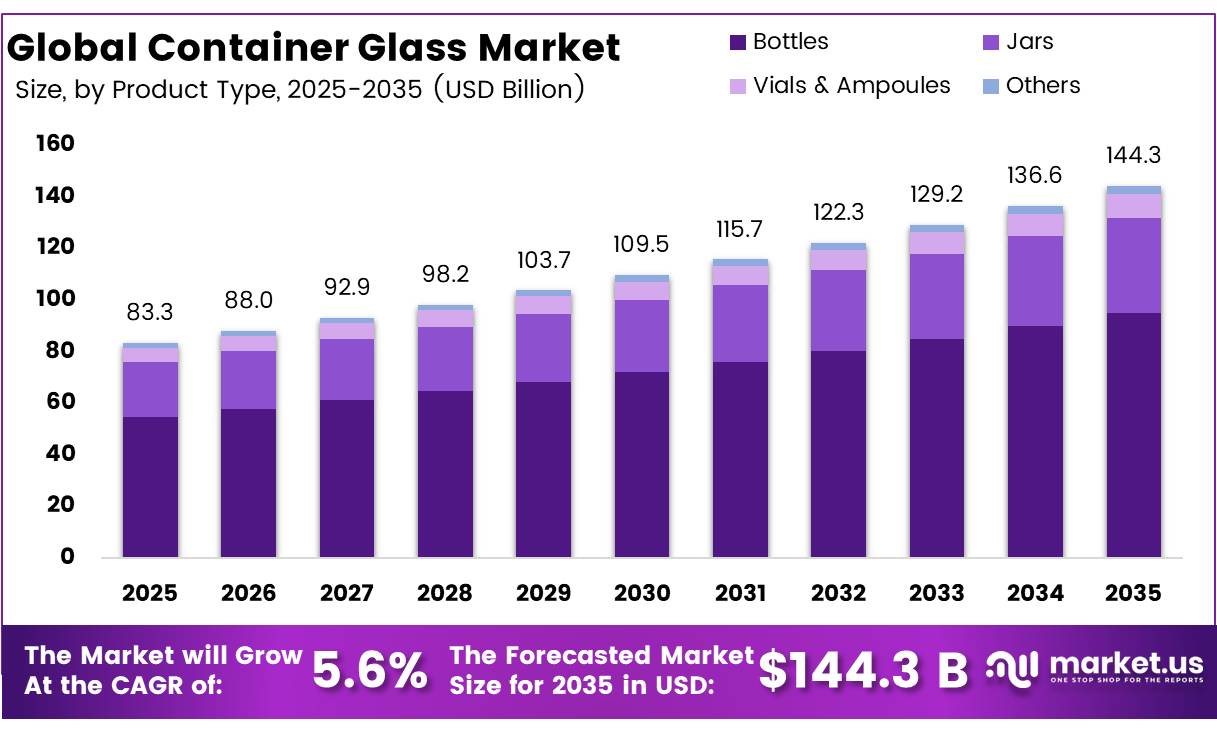
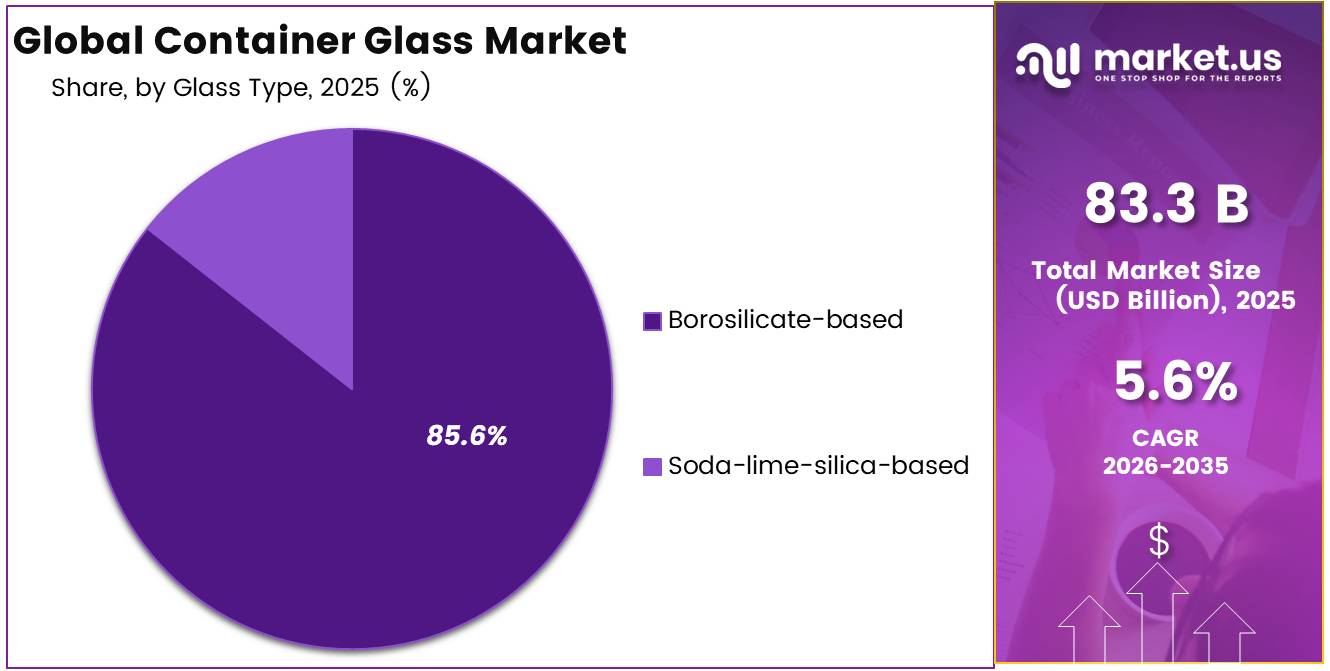
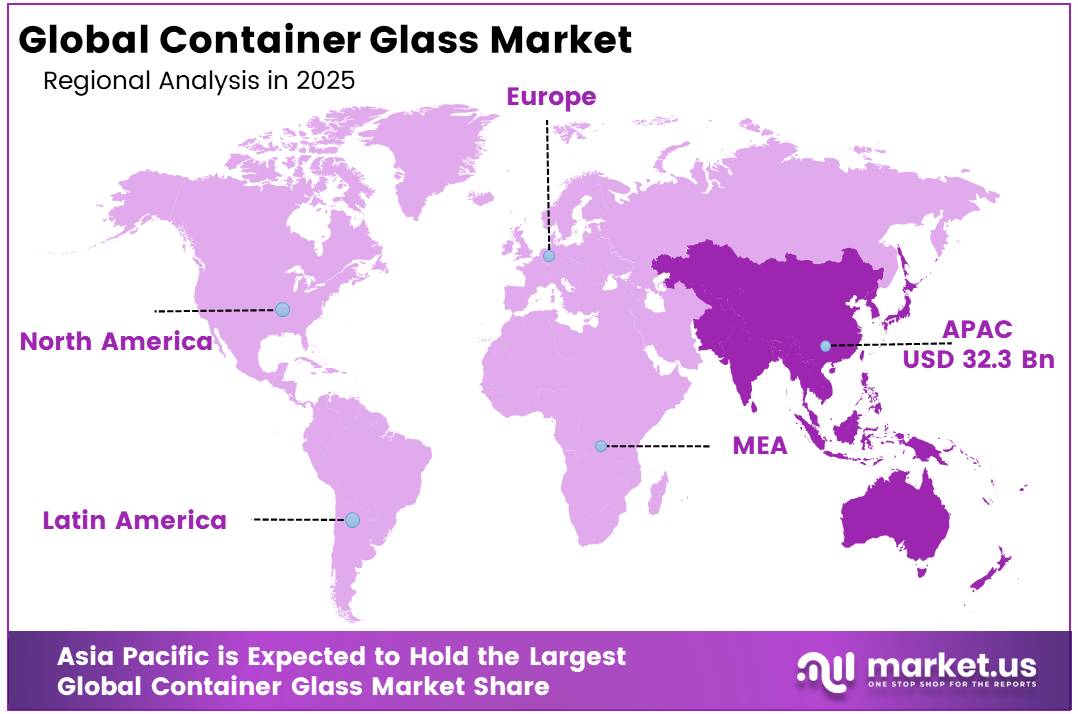
The global market for container glass registered a value of USD 83.35 billion in 2025, forecasted to post a CAGR of 5.64% to attain USD 144.33 billion by 2035. Asia Pacific held a dominant market position, capturing more than a 38.7% share, holding USD 32.26 billion in revenue.
The use of container glass as primary packaging in food & beverage, pharmaceutical, and cosmetic segments stems from its inert chemical nature, 100% recyclable nature, and unmatched consumer trust. Single-use plastic bans that have already started in more than 40 countries are increasingly encouraging buyers to purchase sustainable alternatives in the form of glass as the preferable structurally designed solution.
- The Environment Agency reported that the UK’s final packaging recycling obligation reached 7,901,447 tonnes in 2024, while all registered producer compliance schemes met their recycling obligations under packaging regulations, supporting increased recovery of glass packaging materials.
Key Takeaways
- The Global Container Glass Market had a valuation of USD 83.3 billion in 2025.
- The Global Market will be worth USD 144.3 billion by 2035, CAGR is expected to grow to 5.6% during the forecast period from 2025 to 2035.
- By product type, bottles commanded 65.7% share of total market revenues in 2025.
- By glass type, borosilicate glass accounted for 85.6% share, boosted by strict pharmaceutical regulatory standards and excellent thermal performance requirements.
- By forming technique, Blow & Blow method accounted for 45.6% of total global production capacity in 2025.
- By end-use industry, food & beverages accounted for 38.7% of total revenues, supported by worldwide premiumization trends and shift to glass packaging from plastic.
- In 2025, Asia Pacific emerged as the dominant region was the most dominant region in the separator market, accounting for 62.3% of the total global consumption.
Growing consumer acceptance to pay higher prices for products packaged in glass compared to plastics is driving revenue share gain of the category. Increasing biologics approvals for drug manufacturers requiring pharmaceutical-grade borosilicate bottles, increasing value and growth in premiumization of global spirits and craft beer segment driving the need for high-value bottles, and investments being made in Asia-Pacific to increase the annual production capacity to more than 12 billion bottles per annum until 2030 are all contributing factors towards market growth.
- In July 2025, According to the UK Department for Environment, Food & Rural Affairs (DEFRA), glass packaging achieved a 65.7% recycling rate in 2024, one of the highest among all packaging materials. This reflects continued demand for recyclable glass packaging and investments in circular packaging systems.
Container Glass Market Segment
Product Type Analysis
Bottles represents the most dominant segment of the market
Bottles dominate global container glass market revenue at 65.7% in 2025, powered by widespread usage in beer, wine, spirits, carbonated drinks, and pharmaceutical oral liquids across 185 markets, with over 137 billion unit shipments recorded in 2025 including 72 billion units purchased by alcohol beverage makers alone.
- In January 2025, the European Union’s Packaging and Packaging Waste Regulation (Regulation (EU) 2025/40) entered into force, mandating that all packaging placed on the EU market be recyclable and strengthening recycled-content and reuse requirements, creating significant long-term opportunities for container glass manufacturers.
Jars represent the fastest-growing sub-segment, driven by rising consumer demand for premium food, artisanal products, and baby food across European and North American retail channels. Vials and Ampoules contribute 6.5%, supported by strong pharmaceutical fill-finish growth and biologics approvals globally. Other sub-segments account for the remaining 2.2%.
Glass Type Analysis
Borosilicate Glass is a significant glass type
The borosilicate glass variant captured the largest global container glass market share of 85.6%, as the only FDA, USP, EP, and JP approved primary container material for pharmaceuticals and injectables in 2025. The glass’s capability of withstanding thermal shock of up to 165°C and its absence of extractable compounds made it non-substitutable across pharmaceutical, biotech, and injectable drug packaging applications.
- According to EFPIA’s The Pharmaceutical Industry in Figures 2025, the European pharmaceutical industry invested €55 billion in research and development in 2024, reinforcing continued demand for high-quality pharmaceutical packaging, including borosilicate glass containers used for injectable medicines
Soda-lime-silica glass is the fastest growing segment, serving low-cost standard beverage bottles and commodity food packaging applications where price competitiveness is the primary buyer criterion. Priced 35–40% cheaper per tonne than borosilicate glass, soda-lime-silica glass remains the preferred material for high-volume, price-sensitive categories such as carbonated soft drinks, water, and ambient food products, where regulatory compliance requirements for chemical inertness and thermal resistance are significantly less stringent than in pharmaceutical applications.
Forming Method Analysis
Blow & Blow Process Dominates Market through High-Speed Bottle Manufacturing Efficiency
The Blow & Blow process leads in forming process type with a global container glass market size share of 45.6% of production volumes in 2025, running on IS equipment at 400–600 containers/min speeds to meet the high throughput requirements of large-volume bottlers and fill-finishers worldwide. According to the UK Government’s Extended Producer Responsibility (EPR) for Packaging data, producers placed 2,170,516 tonnes of glass packaging on the UK market during the 2024 reporting period, highlighting the continued importance of container glass within the packaging industry.
The Narrow Neck Press & Blow (NNPB) process is the fastest-growing forming method, driven by its ability to reduce glass weight by 20–30% without compromising structural integrity, directly lowering raw material consumption and carbon emissions per unit produced.
End-Use Industry Analysis
Food and Beverages Dominate Market Driven by Premiumization and Consumer Preference
The Food & Beverage end-use market accounted for 68.7% of the revenue share in 2025, driven by the widespread use of glass packaging for alcoholic beverages, soft drinks, bottled water, dairy products, sauces, and premium food products. Glass remains a preferred packaging material owing to its chemically inert composition, superior barrier properties, ability to preserve product taste and quality, and infinite recyclability.
- According to the U.S. Bureau of Labor Statistics, the Producer Price Index (PPI) for glass container manufacturing increased from 210.596 in December 2024 to 214.961 in June 2025, indicating sustained manufacturing activity and continued demand for container glass across food and beverage packaging applications.
The Pharmaceuticals segment is growing at the fastest pace, driven by accelerating new biological drug approvals from the FDA and EMA, expanding vaccine manufacturing programs under the WHO Immunization Agenda 2030, and rising fill-finish capacity investments across India, South Korea, and Ireland all of which mandate borosilicate glass as the sole compliant primary container material.
Key Market Segments
By Product Type
- Bottles
- Jars
- Vials & Ampoules
- Others
By Glass Type
- Borosilicate-based
- Soda-lime-silica-based
By Forming Method
- Blow & Blow
- Press & Blow
- Narrow Neck Press & Blow
By End-use Industry
- Food & Beverages
- Pharmaceuticals
- Cosmetics & Personal Care
- Chemicals
- Others
Drivers
Regulatory Pressure: EU PPWR & Global Anti-Plastic Mandates
The most immediate structural tailwind for container glass in 2026 is regulatory compulsion. The EU’s Packaging and Packaging Waste Regulation (PPWR), published as Regulation (EU) 2025/40 on 22 January 2025 and entered into force on 11 February 2025, becomes fully applicable to all economic operators on 12 August 2026 making it the single most consequential regulatory event for packaging formats in the current year.
The PPWR mandates that all packaging must be recyclable by 2030, eliminates PFAS in food contact packaging from August 2026, sets Member State packaging waste reduction targets of 5% by 2030 and 15% by 2040, and requires ecomodulation fees that penalise non-recyclable formats directly imposing cost pressure on single-use plastics and multi-material laminates that cannot compete with glass’s 100% recyclability credential.
Drivers Impact Analysis
| Driver | (~) % Impact on CAGR | Geographic Relevance | Impact Timeline |
|---|---|---|---|
| Regulatory Pressure: EU PPWR & Global Anti-Plastic Mandates | +1.4% | EU core; North America spill-over; India, Southeast Asia secondary | Short–Medium term (≤ 3 years) |
| Pharmaceutical & Biologics Pipeline Expansion | +1.2% | North America, Europe primary; APAC fastest-growing at +17% sub-CAGR | Long term (≥ 4 years) |
| Premiumisation of Beverages & Cosmetics | +1.0% | North America, EU, APAC corridors (China, India, Japan) | Medium term (2–4 years) |
| APAC Middle-Class Urbanisation & Capacity Build-Out | +0.9% | India, China, Vietnam, Indonesia primary; South America spill-over | Medium–Long term (3–6 years) |
| Circular Economy Infrastructure: Cullet Loops & Recycling Mandates | +0.7% | EU (leading at ~75% collection rates), North America, selective APAC | Medium term (2–4 years) |
| Energy Transition & Decarbonisation Technology | +0.5% | EU, North America; Japan, Korea early adopters in APAC | Long term (≥ 4 years) |
Restraints
Inter-Material Substitution: PET, Aluminum & Flexible Packaging
The container glass market faces structurally asymmetric competition from substitute packaging materials that benefit from superior weight-to-volume economics, lower breakage rates, and in the case of plastics approximately USD 43 billion in annual global government subsidies, creating a cost distortion that prevents fair substrate competition on unit economics and sustains PET’s cost advantage even as virgin plastic faces regulatory headwinds.
A standard 330ml glass bottle weighs approximately 200g versus 20g for a comparable engineered PET bottle a 10:1 weight ratio meaning that filling a standard 24-pallet trailer with glass containers carries approximately 4,320 kg of additional dead weight per load versus PET, directly inflating per-case transportation costs by an estimated 20%–35% on routes exceeding 500km and making glass structurally uncompetitive for e-commerce distribution channels where dimensional weight pricing further penalises heavy materials.
Restraint Impact Analysis
| Restraint | (~) % Impact on CAGR | Geographic Relevance | Impact Timeline |
|---|---|---|---|
| Energy Intensity & Carbon Cost Escalation | -1.3% | EU core; North America; Japan; energy-import-dependent APAC | Short–Medium term (≤ 3 years) |
| Secular Decline in Alcoholic Beverage Demand | -1.1% | North America, Western Europe primary; Australia secondary | Medium term (2–4 years) |
| Inter-Material Substitution: PET, Aluminum & Flexible Packaging | -0.9% | Price-sensitive APAC, South America, Eastern Europe; North America secondary | Medium–Long term (3–6 years) |
| High CapEx Intensity & Furnace Decarbonisation Costs | -0.7% | EU primary (CBAM exposure); North America; emerging APAC producers | Long term (≥ 4 years) |
| Logistical Cost Asymmetry & Fragility Penalty | -0.5% | North America, South America; dispersed APAC markets | Short–Medium term (≤ 3 years) |
| Raw Material Supply Volatility: Soda Ash & Silica Sand | -0.4% | China, India, Southeast Asia; North America; selective Middle East | Short term (≤ 2 years) |
Opportunity
Connected Glass: Smart & Digital Packaging Layer Monetisation
For brand owners, the value proposition is concrete: connected glass enables real-time provenance authentication, consumer engagement triggered at the point of consumption, first-party data collection to circumvent cookie deprecation, and chain-of-custody traceability that satisfies the EU’s Digital Product Passport (DPP) requirements under the Ecodesign for Sustainable Products Regulation (ESPR) requirements that will compel brand owners to invest in traceability infrastructure by 2027–2028 regardless.
At the unit-economics level, a glass producer integrating NFC inlays into 500 million containers annually at a USD 0.03 average SaaS margin per container generates USD 15 million of incremental recurring revenue on an asset base that requires zero additional furnace capacity a 100% software-leveraged margin improvement that would compress the industry’s current gross margin range of 25%–35% closer to 35%–45% on the connected-container sub-portfolio.
Opportunity Impact Analysis
| Opportunity | (~) % Potential CAGR | Geographic Relevance | Execution Window |
|---|---|---|---|
| Connected Glass: Smart & Digital Packaging Layer Monetisation | +1.5% | North America, EU primary; APAC fast-follower | Short term (≤ 2 years) |
| Reuse-as-a-Service (RaaS): Deposit Return & Refill Loop | +1.2% | EU core (18 DRS markets); North America emerging; India pilot-stage | Medium term (2–4 years) |
| Cannabis & Nutraceutical Packaging: Adjacent TAM Capture | +1.1% | North America (US, Canada, Germany); selective EU; Australia | Short–Medium (≤ 3 years) |
| Functional Coatings & Surface Engineering Upsell | +0.8% | EU, North America primary; China, India, Japan secondary | Medium term (2–4 years) |
| Africa & Middle East Greenfield Market Entry | +0.7% | Sub-Saharan Africa (Nigeria, Kenya, South Africa); GCC, Egypt | Long term (≥ 4 years) |
| M&A Consolidation in Fragmented APAC & EM Markets | +0.6% | India, Southeast Asia, Brazil; Eastern Europe | Medium–Long (3–6 years) |
Challenges
Geopolitical Energy & Supply Chain Volatility
The container glass industry’s structural dependence on continuous, uninterrupted natural gas supply at predictable prices a dependency rooted in the physics of glass melting, where furnaces must run at 1,450–1,550°C for campaigns of 12–18 years without shutdown creates an irreducible geopolitical energy exposure that has shifted from a theoretical tail-risk to an active operational cost challenge as a result of the Iran conflict and Strait of Hormuz closure in early 2026, which directly impacted LNG supply corridors serving South Asia and East Asia and forced Indian glass bottle producers to halt output lines as gas supply disruptions materialised in Q1 2026.
The Strait of Hormuz carries approximately 20%–22% of global LNG trade, and its effective partial closure from early 2026 drove Brent crude prices up 9% and international LNG spot prices up an estimated 18%–24% on affected Asian delivery routes a price shock that translated directly to an incremental energy cost burden of USD 12–20 per tonne of glass melted for plants in India, Pakistan, Bangladesh, and Southeast Asian markets sourcing spot or mid-term LNG contracts without multi-year price floors.
Challenges Impact Analysis
| Challenge | (~) % CAGR Friction | Geographic Relevance | Mitigation Horizon |
|---|---|---|---|
| Skilled Workforce Erosion & Knowledge Transfer Deficit | -1.4% | North America, Western Europe primary; India, Southeast Asia secondary | Long term (≥ 4 years) |
| Cullet Contamination & Collection Infrastructure Gaps | -1.2% | North America core; Eastern EU; South America; India | Medium term (2–4 years) |
| Geopolitical Energy & Supply Chain Volatility | -1.1% | India, APAC; Middle East-import-dependent EU; South America | Short–Medium term (≤ 3 years) |
| Decarbonisation Technology Readiness & Grid Access | -1.0% | EU primary (CBAM-exposed); North America; Japan, Korea; India | Long term (≥ 4 years) |
| Quality Control & AI Inspection Adoption Lag | -0.6% | Globally distributed; most acute in APAC, India, Eastern EU | Medium term (2–4 years) |
| Post-Consumer Glass Recycling Infrastructure Fragmentation | -0.4% | North America; Sub-Saharan Africa; Southeast Asia; South America | Long term (≥ 4 years) |
Geopolitical Impact Analysis
Geopolitical Trade Shifts, Tariff Pressures, and Energy Policy Reshaping the Container Glass Market
The global container glass market is being reshaped by three simultaneous geopolitical forces: US-China trade tensions, EU carbon border adjustment policies, and sovereign manufacturing investment programs across emerging economies. US Section 301 tariffs on Chinese-manufactured glass containers and raw material inputs have accelerated supply chain localization among North American bottlers and pharmaceutical fill-finish operators, driving new domestic capacity investments in Mexico, India, and Southeast Asia as alternative sourcing destinations.
The EU’s Carbon Border Adjustment Mechanism (CBAM), fully operational in 2026, is raising the landed cost of glass containers imported from high-emission manufacturing economies including Turkey, Ukraine, and North Africa, providing a structural cost competitiveness advantage to European producers actively investing in electric furnace and hybrid melting technologies.
- In October 2025, according to Eurostat (European Commission), the European Union generated 79.7 million tonnes of packaging waste, including 15.0 million tonnes of glass packaging waste (18.8% of total packaging waste) based on the latest available official dataset. The increasing volume of glass packaging waste continues to reinforce EU energy and circular economy policies, encouraging greater use of recycled glass (cullet), improved furnace energy efficiency, and lower-carbon manufacturing practices across the container glass industry.
Regional Analysis
Asia Pacific Dominates Global Container Glass Market with 38.7% Share in 2025
Asia Pacific dominates the global container glass market, accounting for 38.7% of revenue share in 2025, driven by China’s position as the world’s largest glass producer, rapidly growing beverage consumption across Southeast Asia, and India’s expanding pharmaceutical packaging sector, reducing import dependence on European and Chinese borosilicate glass suppliers.
Europe holds the second largest regional share, supported by the EU Single-Use Plastics Directive. North America is bolstered by the rapidly growing craft spirits sector and an expanding pharmaceutical fill-finish industry requiring borosilicate-grade primary containers. Latin America, spearheaded by Mexico’s tequila export boom, represents an emerging premium bottle demand market.
Key Regions and Countries Covered
North America
- The US.
- Canada
Europe
- Germany
- France
- The UK.
- Italy
- Spain
- Russia & CIS
- Rest of Europe
Asia Pacific
- China
- Japan
- South Korea
- India
- ASEAN
- Rest of Asia Pacific
Latin America
- Brazil
- Mexico
- Rest of Latin America
Middle East & Africa
- GCC Countries
- South Africa
- Rest of Middle East & Africa
Key Players Analysis
The major players in the global container glass market, including O-I Glass, Verallia, Ardagh Group, Owens Corning, Vitro, and Gerresheimer, are differentiated through their capability to provide diverse glass types, forming process technologies, and solutions catered to specific applications across pharmaceutical packaging, beverages, and cosmetics segments.
The consistent adoption of lightweighting solutions, transition toward electric furnaces, implementation of AI-powered inspection systems, and commitment to circular economy principles are necessary for manufacturers to remain competitive within a market increasingly driven by sustainability regulations, pharmaceutical-grade material requirements, and premium beverage packaging demand.
The Major Players In The Industry
- Amcor plc
- Ardagh Group
- Borosil
- Corning Incorporated
- Gerresheimer AG
- O-I Glass, Inc.
- Piramal Glass Private Limited
- Schott AG
- Stevanato Group
- FrigoGlass
- Consol Glass Pty Ltd.
- Central Glass Co., Ltd.
- Vitro, S.A.B. de C.V.
- Vidrala
- Hindusthan National Glass Industries Limited
- Other Key Players
Key Development
- In April 2026, Gerresheimer AG obtained a multi-year contract for supplying its customers with 800 million units per year of borosilicate vials, applicable to its pharmaceutical filling-and-finishing plants in Europe.
- In March 2026, Hindustan National Glass Industries Limited opened a USD 280 million greenfield manufacturing plant in India, which would increase its annual production capacity to 2.4 billion units catering to the local pharmaceutical and premium beverages market.
Report Scope
| Report Features | Description |
|---|---|
| Market Value (2025) | USD 83.3 Billion |
| Forecast Revenue (2035) | USD 144.3 Billion |
| CAGR (2026-2035) | 5.6% |
| Base Year for Estimation | 2025 |
| Historic Period | 2020–2024 |
| Forecast Period | 2026–2035 |
| Report Coverage | Revenue Forecast, Market Dynamics, Competitive Landscape, Geopolitical Impact, and Recent Developments |
| Segments Covered | By Product Type (Bottles, Jars, Vials & Ampoules, and Others), By Glass Type (Borosilicate-based and Soda-lime-silica-based), By Forming Method (Blow & Blow, Press & Blow, and Narrow Neck Press & Blow), By End-use Industry (Food & Beverages, Cosmetics & Personal Care, Pharmaceuticals, Chemicals, and Others) |
| Regional Analysis | North America – The US & Canada; Europe – Germany, France, The UK, Spain, Italy, Russia & CIS, Rest of Europe; APAC– China, Japan, South Korea, India, ASEAN & Rest of APAC; Latin America– Brazil, Mexico & Rest of Latin America; Middle East & Africa– GCC, South Africa, & Rest of MEA |
| Competitive Landscape | Amcor plc, Ardagh Group, Borosil, Corning Incorporated, Gerresheimer AG, O-I Glass Inc., Piramal Glass Private Limited, Schott AG, Stevanato Group, FrigoGlass, Consol Glass Pty Ltd., Central Glass Co. Ltd., Vitro S.A.B. de C.V., Vidrala, Hindusthan National Glass Industries Limited |
| Customization Scope | Segment, country, and regional customization, along with company profiling, pricing trends, CAGR updates, competitive benchmarking, and additional application or technology segmentation, can be provided as per client requirements. |
| Purchase Options | We have three licenses to opt for Single User License, Multi-User License (Up to 5 Users), Corporate User License (Unlimited User and Printable PDF) |


