Report Overview
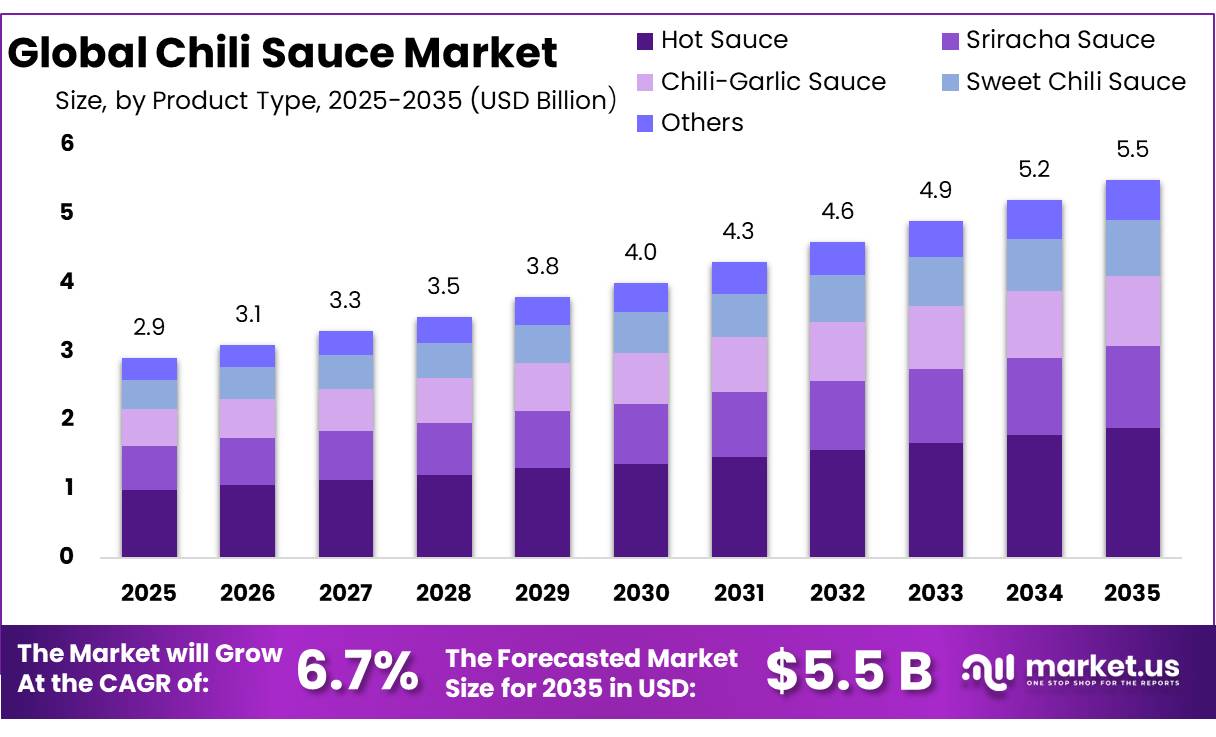
The Global Chili Sauce Market size is expected to be worth around USD 5.5 Billion by 2035, from USD 2.9 Billion in 2025, growing at a CAGR of 6.7% during the forecast period from 2026 to 2035. In 2025, North America held a dominant market position, capturing more than a 41.23% share, holding USD 1.1 Billion revenue.
The global chili sauce industry is an important segment of the processed food and condiments sector, supported by increasing demand for spicy foods, convenient meal solutions, ready-to-eat products, and international cuisines. Chili sauce is manufactured using fresh or processed chili peppers combined with ingredients such as vinegar, salt, garlic, tomatoes, sugar, spices, and permitted food additives.
According to Agriculture and Agri-Food Canada, global production of fresh green chillies and peppers reached approximately 36.97 million metric tonnes in 2022, demonstrating the importance of pepper cultivation to the global food-processing supply chain. This agricultural supply provides manufacturers with essential raw materials for chili-based sauces, pastes, seasonings, and condiments. However, variations in weather conditions, crop yields, transportation costs, and agricultural input prices can affect raw material availability and production expenses.
- International trade also supports the expansion of the chili sauce industry. According to World Bank World Integrated Trade Solution data based on United Nations Comtrade, global exports under HS code 210390, covering sauces and mixed condiments rather than chili sauce alone, recorded substantial commercial activity in 2024. The European Union exported approximately USD 2.65 billion, while the United States recorded USD 1.74 billion, Italy recorded USD 1.71 billion, and China recorded USD 1.21 billion.
Several factors are driving industrial development, particularly changing consumer food preferences, growing restaurant and foodservice activities, and the popularity of spicy international cuisines. Manufacturers are expanding their product portfolios through different heat levels, regional flavors, reduced-sugar formulations, organic ingredients, and clean-label products. Food safety requirements are also influencing manufacturing practices.
The US Food and Drug Administration’s Food Safety Modernization Act requires applicable food-processing facilities to implement preventive controls, including appropriate cooking, acidification, sanitation, and allergen management procedures. Under the Codex Standard CXS 306-2023, chili sauce has a maximum specified pH of 4.6, while total soluble solids are specified within 8% to 60%, depending on the product type.
Key Takeaways
- Chili Sauce Market size is expected to be worth around USD 5.5 Billion by 2035, from USD 2.9 Billion in 2025, growing at a CAGR of 6.7%.
- Hot Sauce held a dominant market position, capturing more than a 34.21% share.
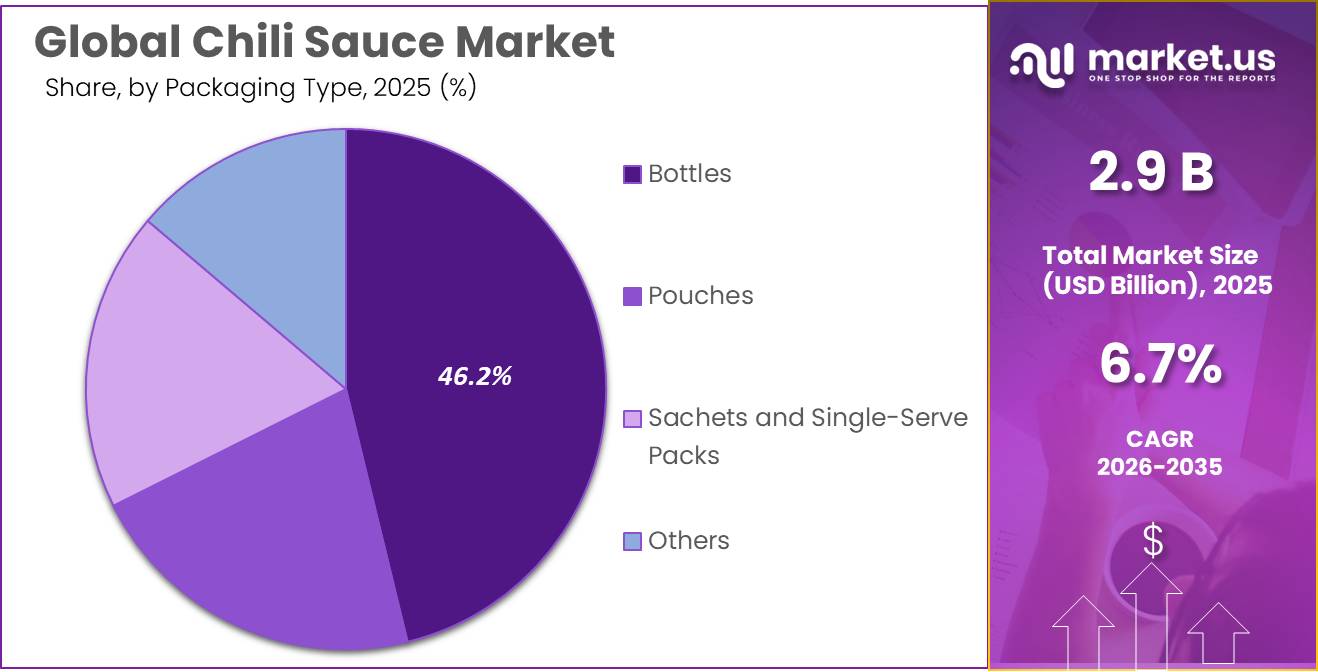
- Bottles held a dominant market position, capturing more than a 46.00% share of the Chili Sauce Market.
- Retail held a dominant market position, capturing more than a 64.56% share of the Chili Sauce Market.
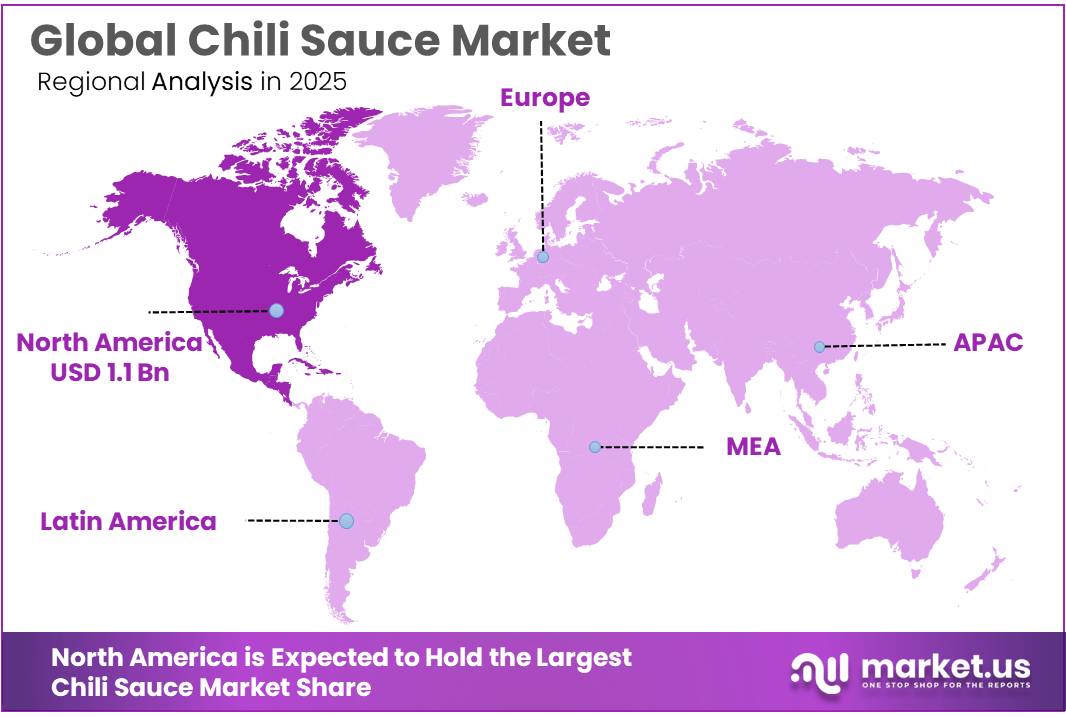
- North America held the leading position in the Chili Sauce Market in 2025, accounting for 41.23% of the global market, with a market value of USD 1.1 billion.
By Product Type Analysis
Hot Sauce – Dominates the Market Through Strong Consumer Demand and Wide Foodservice Applications
In 2025, “Hot Sauce” held a dominant market position, capturing more than a 34.21% share of the Chili Sauce Market by Product Type. The segment benefits from its widespread use in household cooking, restaurants, quick-service restaurants, and packaged food products. Hot sauce is commonly used as a condiment, cooking ingredient, and flavor enhancer across different cuisines. Its demand is supported by consumer preference for spicy flavors, convenient meal preparation, and the growing availability of different heat levels and flavor combinations. Manufacturers are focusing on garlic-infused, smoky, fermented, and premium hot sauce varieties to strengthen product differentiation.
Sriracha Sauce represents an important product category in the Chili Sauce Market, supported by consumer interest in bold flavors, garlic-based condiments, and versatile cooking ingredients. Its combination of chili peppers, garlic, vinegar, salt, and sweetening ingredients makes it suitable for restaurants, household consumption, dipping sauces, marinades, and ready-to-eat food applications.
In 2025 and 2026, manufacturers can strengthen this segment through product diversification, improved packaging, and wider foodservice distribution. The FAO and WHO Codex Standard CXS 306-2023 provides relevant manufacturing quality benchmarks for chili sauces, specifying a maximum pH of 4.6 and total soluble solids ranging from 8% to 60%, depending on the product type. These standards support consistent product quality and processing practices.
The US Food and Drug Administration also requires applicable acidified food products to maintain an equilibrium pH of 4.6 or below. Such requirements encourage manufacturers to invest in acidity monitoring, hygienic production, and quality-control systems. Growing interest in specialty condiments and international cuisines provides further opportunities for Sriracha sauce manufacturers to expand their product portfolios and distribution networks.
By Packaging Type Analysis
Bottles – Dominates the Market Due to Convenience, Product Visibility, and Easy Storage
In 2025, “Bottles” held a dominant market position, capturing more than a 46.00% share of the Chili Sauce Market by Packaging Type. The segment benefits from its convenient handling, easy dispensing, reusable packaging options, and suitability for household and commercial consumption. Bottled packaging allows manufacturers to offer different product sizes, including small retail packs and larger foodservice containers. Transparent bottles also help consumers identify product appearance, thickness, and consistency before purchasing.
In 2025 and 2026, demand for bottled chili sauce is supported by its wide availability across supermarkets, convenience stores, restaurants, and online retail platforms. Manufacturers are also focusing on improved dispensing caps, squeeze bottles, lightweight packaging, and recyclable materials to improve product convenience and reduce packaging waste. These factors support the continued use of bottles as a preferred packaging format.
Pouches are gaining attention in the Chili Sauce Market because of their lightweight structure, flexible storage, and suitability for single-serving and household applications. In 2025 and 2026, pouch packaging provides manufacturers with opportunities to serve restaurants, takeaway outlets, foodservice operators, and retail consumers seeking convenient condiment formats. Compared with rigid packaging, flexible pouches can reduce packaging material requirements and storage space, depending on their design.
Resealable and stand-up pouch formats also improve handling and product accessibility. The segment has further growth opportunities through recyclable mono-material structures, improved barrier properties, and portion-controlled packaging. The US Environmental Protection Agency identifies packaging as an important component of municipal solid waste management, encouraging manufacturers to improve packaging material efficiency and recycling practices.
By Distribution Channel Analysis
Retail – Dominates the Market Through Wider Product Availability and Direct Consumer Access
In 2025, “Retail” held a dominant market position, capturing more than a 64.56% share of the Chili Sauce Market by Distribution Channel. The segment benefits from the wide availability of chili sauce through supermarkets, grocery stores, convenience stores, specialty food shops, and online retail platforms. Retail distribution allows manufacturers to reach household consumers directly and offer products in different flavors, packaging formats, and price ranges.
In 2025 and 2026, manufacturers are strengthening retail distribution through attractive packaging, promotional activities, new product launches, and wider shelf availability. The growing presence of private-label sauces and premium specialty condiments also supports product visibility and consumer choice. Retail outlets remain an important sales channel because they provide easy product access and allow consumers to compare brands before purchasing.
Hypermarkets and Supermarkets represent an important distribution channel for the Chili Sauce Market because they provide consumers with easy access to different brands, flavors, packaging sizes, and price categories. In 2025 and 2026, these outlets support product sales through dedicated condiment shelves, promotional offers, private-label products, and regular household grocery purchases. Their established supply networks also help chili sauce manufacturers reach a wider customer base and maintain consistent product availability.
According to the US Census Bureau, food and beverage store sales reached approximately USD 1.006 trillion in 2025, based on the reported monthly sales figures. This demonstrates the significant scale of grocery and food retail distribution in the United States. Supermarkets also provide opportunities for manufacturers to introduce premium hot sauces, garlic chili sauces, and specialty condiment varieties. Growing demand for convenient shopping, product variety, and established retail brands is expected to support this channel in 2026.
Key Market Segments
By Product Type
- Hot Sauce
- Sriracha Sauce
- Chili-Garlic Sauce
- Sweet Chili Sauce
- Others
By Packaging Type
- Bottles
- Pouches
- Sachets and Single-Serve Packs
- Others
By Distribution Channel
- Retail
- Hypermarkets and Supermarkets
- Convenience Stores
- Online Stores
- Others
- HoReCa/Foodservice
- Restaurants
- Hotels
- Catering
Driver Analysis
Regional-Flavour Mainstreaming
Established manufacturers are translating regionally associated chili flavours into accessible supermarket products, lowering the discovery barrier for consumers who do not routinely shop specialist cuisine aisles. In February 2025, Heinz launched three globally inspired sauces nationally in the US, including Thai Inspired Sweet Chili with ginger, sriracha and sesame oil; McCormick separately commercialized its 2025 Aji Amarillo Hot Sauce, combining Peruvian yellow chili with pineapple.
These are evidence of active product commercialization, not proof that every globally inspired condiment belongs in the chili sauce market: non-chili-led barbecue sauces and creamy dressings remain excluded under this report’s scope.
In an illustrative regional-flavour launch reaching 2,000 stores, sales of six bottles per store weekly generate 624,000 bottles annually. At an assumed USD 1.80 manufacturer realization per bottle, gross annual revenue is USD 1.123 million; if 40.0% replaces existing chili sauce purchases, net incremental category revenue falls to approximately USD 673,920.0 before promotions and returns. Suppliers therefore capture value through repeatable flavour authenticity, broad retail acceptance and household recruitment rather than launch counts alone.
The business model shifts from a single pepper-and-vinegar proposition toward application-specific regional portfolios supported by culinary development. The +1.0 pp contribution assumes 25.0% revenue exposure grows 4.0 percentage points faster through regional-flavour recruitment, excluding sweet-heat purchases allocated primarily to reduced heat intensity below.
Drivers Impact Analysis
| Driver | (~) % Impact on CAGR Forecast | Geographic Relevance | Impact Timeline |
|---|---|---|---|
| Regional-flavour mainstreaming | +1.0 pp | US, Canada, UK, Western Europe | Short term (≤ 2 years) |
| Mild and sweet-heat recruitment | +0.8 pp | North America, EU, Australia | Short term (≤ 2 years) |
| Multi-occasion sauce formats | +0.7 pp | US, UK, EU, Australia | Short term (≤ 2 years) |
| Recipe-ready foodservice adoption | +0.7 pp | US, Canada, UK; urban Asian markets | Medium term (2–4 years) |
| Distributor-enabled retail reach | +0.6 pp | North America core; UK, EU export channels | Medium term (2–4 years) |
Restraint Analysis
Price-Led Demand Resistance
Price increases needed to protect margins can reduce unit purchases or cause consumers to select cheaper sauces, limiting real market growth even where reported sales benefit from inflation. McCormick’s third-quarter 2026 presentation reported 2.2% pricing and a negative 0.3% volume/mix contribution at group level; Consumer Americas recorded a negative 2.5% volume/mix contribution, while management raised expected annual cost inflation to 6.0–7.0%.
These are diversified-company indicators, not chili-sauce-specific elasticity estimates, and management also described improving hot-sauce trends, so they should not be used to claim that the entire category is contracting.
In an illustrative product selling 10.0 million bottles annually at a USD 1.50 manufacturer realization, revenue is USD 15.0 million. An 8.0% increase to USD 1.62 accompanied by a 6.0% volume reduction produces USD 15.228 million of nominal revenue, up 1.5%, but only 9.4 million bottles. At constant prices, that represents declining demand rather than equivalent real growth. If unit production cost rises from an assumed USD 1.00 to USD 1.08, contribution increases slightly from USD 5.0 million to USD 5.076 million before commercial expenditure, illustrating why protecting profit does not necessarily expand physical demand.
Suppliers must assess price-pack architecture, promotional returns and consumer substitution instead of assuming input-cost recovery is volume-neutral. The −0.5 pp deduction assumes 25.0% revenue exposure grows 2.0 percentage points more slowly through price-related purchase resistance, excluding simple transfers between equally priced chili-sauce brands.
Restraint Impact Analysis
| Restraint | (~) % Impact on CAGR Forecast | Geographic Relevance | Impact Timeline |
|---|---|---|---|
| Price-led demand resistance | −0.5 pp | US, Canada, UK, Western Europe | Short term (≤ 2 years) |
| Uneconomic incremental listings | −0.4 pp | North America, UK, EU export channels | Short term (≤ 2 years) |
| Noncompliant product exclusion | −0.3 pp | US; exporters into US | Medium term (2–4 years) |
| Recall-driven sales withdrawals | −0.3 pp | US retail; shared export supply chains | Short term (≤ 2 years) |
| Heat-limited consumer adoption | −0.3 pp | North America, Western Europe, Australia | Long term (≥ 4 years) |
Opportunity Analysis
Packaged-Meal Sauce Partnerships
Co-development with chilled-meal, frozen-meal and meal-kit manufacturers offers an adjacent route to monetize chili sauce as a measured ingredient or separately packaged accompaniment, rather than depend entirely on condiment-aisle purchases. McCormick’s current Branded Food Ingredients platform explicitly offers Frank’s RedHot and Cholula in manufacturing formats and supports ingredient supply, licensing and co-branding; this establishes an existing capability, not an entirely unserved category or a disclosed pipeline of incremental orders.
The untapped opportunity is winning additional programs that introduce qualifying liquid chili sauce where no in-scope sauce was previously purchased, excluding existing branded partnerships and dry flavour systems. In an illustrative portfolio of ten newly converted meal programs, each selling two million units annually with a 15-g sauce component, technical demand is 300 tonnes per program, or 3,000 tonnes overall. At an assumed USD 2.50/kg manufacturer realization, gross annual sauce revenue is USD 7.5 million.
If 40.0% replaces incumbent chili sauce rather than creating additional category consumption, net incremental revenue falls to USD 4.5 million; royalties must not be added to the same ingredient sales. Suppliers need validated performance under the customer’s actual freezing, reheating and packaging conditions, reliable dosing and clear ownership of recipe changes. The +0.35 pp contribution assumes 7.0% revenue exposure grows 5.0 percentage points faster through net-new packaged-food applications, excluding finished-meal value and ordinary restaurant ingredient use already counted as a driver.
Opportunity Impact Analysis
| Opportunity | (~) % Potential CAGR Upside | Geographic Relevance | Execution Window |
|---|---|---|---|
| Packaged-meal sauce partnerships | +0.35 pp | US, UK, Germany, Japan, South Korea | Medium term (2–4 years) |
| Nutrition-qualified institutional sauces | +0.30 pp | US, UK, EU, Australia | Medium term (2–4 years) |
| Consumption-led discovery subscriptions | +0.25 pp | US, Canada, UK, Germany | Short term (≤ 2 years) |
| New-account portion-control programs | +0.25 pp | US, UK, EU, Gulf states | Short term (≤ 2 years) |
| Shared-access craft commercialization | +0.25 pp | US, UK, EU export markets | Medium term (2–4 years) |
Challenges Analysis
Pepper Heat and Flavour Variability
Pepper genotype, maturity and growing conditions alter capsaicinoid content and aroma, requiring sauce manufacturers to standardize incoming ingredients rather than assume that a named variety provides a fixed sensory profile. An April 2026 scientific review identifies temperature, water availability, nutrition and genotype-dependent responses as determinants of pungency, while an August 2026 study of eight cultivars reported capsaicinoid increases of approximately 24.2–73.4% during ripening in the sampled peppers.
In an illustrative blend, equal masses of analytically comparable pepper ingredients rated at 20,000 and 40,000 Scoville Heat Units produce a nominal 30,000-SHU blend before dilution and processing effects. If the second lot instead measures 50,000 SHU, its required share falls from 50.0% to approximately 33.3% to maintain the same nominal target; retaining a fixed 50:50 recipe would yield approximately 35,000 SHU, 16.7% above target. This simplified calculation assumes linear blending on a consistent analytical basis and does not predict perceived heat, aroma or finished-sauce acceptance.
Manufacturers need capsaicinoid assays, maturity specifications, sensory panels and controlled blending inventories, with substitutes checked for colour and flavour as well as pungency. The −0.30 pp contribution assumes 15.0% revenue exposure grows 2.0 percentage points more slowly through blending adjustments, incoming-material holds and corrective trials, excluding customers who reject a correctly manufactured product simply because its intended heat level is unsuitable.
Challenges Impact Analysis
| Challenge | (~) % CAGR Friction Drag | Geographic Relevance | Mitigation Horizon |
|---|---|---|---|
| Pepper heat and flavour variability | −0.30 pp | Mexico, India, Thailand; US, EU processors | Long term (≥ 4 years) |
| Acidification and thermal consistency | −0.30 pp | US, EU, Southeast Asian export hubs | Medium term (2–4 years) |
| Viscosity and filling control | −0.25 pp | North America, EU, Thailand, China | Medium term (2–4 years) |
| Allergen-safe production changeovers | −0.25 pp | US, UK, EU, Asian co-manufacturers | Medium term (2–4 years) |
| Format-specific packaging validation | −0.20 pp | North America, EU, UK, Australia | Medium term (2–4 years) |
Geopolitical Impact Analysis
Geopolitical Impact of Ongoing Middle East and Russia-Ukraine Conflicts on the Chili Sauce Market
The ongoing Middle East conflict and Russia-Ukraine war are creating supply-chain challenges for the global Chili Sauce Market in 2026. Disruptions around the Strait of Hormuz, Red Sea, and Black Sea are increasing shipping costs, energy expenses, and transportation delays. These developments affect chili sauce manufacturers through higher costs for transporting chili peppers, vinegar, sugar, packaging materials, and other processing ingredients.
According to the World Bank’s October 2026 Commodity Markets Outlook, global energy prices are projected to increase by 32% in 2026, while food commodity prices are expected to rise by approximately 10%. The United Nations also reported 134 confirmed maritime incidents in the Strait of Hormuz and wider Middle East maritime area as of November 11, 2026. Higher fuel, fertilizer, and logistics expenses may increase agricultural procurement and manufacturing costs. Smaller sauce producers could face additional pressure on profit margins and product pricing.
However, manufacturers can reduce these risks by diversifying suppliers, maintaining raw material inventories, sourcing ingredients locally, and improving distribution networks. These developments may also encourage investment in efficient production and sustainable packaging.
Regional Insights
Dominating Region: North America (41.23% Share, USD 1.1 Billion)
North America held the leading position in the Chili Sauce Market in 2025, accounting for 41.23% of the global market, with a market value of USD 1.1 billion. The region benefits from strong consumer demand for spicy condiments, established food-processing facilities, extensive supermarket networks, and a well-developed restaurant industry. The United States represents a major contributor, supported by demand for hot sauces, Mexican-style condiments, and specialty chili-based products.
According to the US Department of Agriculture (USDA), US chile pepper production reached 2.32 million hundredweight in 2024, representing a 13% increase over 2023. This agricultural supply supports domestic food processing and condiment manufacturing. Regional trade also strengthens the industry, with US imports of prepared sauces and mixed condiments reaching approximately USD 2.03 billion in 2025.
Beyond its established position, North America offers further growth opportunities through premium hot sauces, organic chili condiments, reduced-sugar formulations, and innovative packaging. The United States, Canada, and Mexico provide manufacturers with opportunities to expand cross-border distribution and strengthen regional supply chains.
According to World Bank World Integrated Trade Solutions data, US exports of prepared sauces and mixed condiments reached USD 1.83 billion in 2025, with Canada receiving approximately USD 643.25 million and Mexico receiving USD 340.71 million. These trade flows demonstrate strong regional commercial connections and opportunities for manufacturers to expand distribution.
Key Regions and Countries Insights
- North America
- US
- Canada
- Europe
- Germany
- France
- The UK
- Spain
- Italy
- Rest of Europe
- Asia Pacific
- China
- Japan
- South Korea
- India
- Australia
- Rest of APAC
- Latin America
- Brazil
- Mexico
- Rest of Latin America
- Middle East & Africa
- GCC
- South Africa
- Rest of MEA
Key Players Analysis
McCormick & Company maintains a strong position in the chili sauce industry through its Frank’s RedHot, Cholula, and other condiment brands. In 2025, the company reported total net sales of USD 6.84 billion, representing 1.7% growth over 2024. Its Consumer segment generated USD 3.95 billion, while condiments and sauces contributed USD 950.9 million. The company distributes products across approximately 150 countries and territories, supporting its international presence in hot sauces and specialty condiments.
McIlhenny Company is a major participant in the global hot sauce industry through its TABASCO brand. Founded in 1868, the family-owned company manufactures its products on Avery Island, Louisiana. Its TABASCO sauces are distributed across more than 195 countries and territories and labeled in over 36 languages and dialects. The company offers 9 core pepper sauce varieties, including Original Red, Jalapeño, Chipotle, Habanero, Sweet Chili, and Sriracha. Its established international distribution and traditional pepper-mash aging process strengthen its competitive position.
The Kraft Heinz Company maintains a significant presence in the global condiment industry through its Heinz, Kraft, and other established food brands. In 2025, the company generated total net sales of USD 24.942 billion, compared with USD 25.846 billion in 2024. North America contributed USD 18.586 billion to its annual sales, while international developed markets generated USD 3.539 billion. Its broad retail distribution network, established manufacturing capabilities, and condiment portfolio support its participation in the chili sauce and related sauce categories.
Top Key Players Outlook
- McCormick & Company, Incorporated
- McIlhenny Company
- The Kraft Heinz Company
- Huy Fong Foods, Inc.
- Grupo Herdez, S.A.B. de C.V.
- Lee Kum Kee International Holdings Ltd.
- Kikkoman Corporation
- Unilever PLC
- Chung Jung One
- Lao Gan Ma
- Cholula Food Company, LLC
- Masan Group Corporation
- Other Key Players
Recent Developments
- In August 2026, Huy Fong Foods, Inc. highlighted another chili pepper supply shortage linked to unfavorable weather and crop conditions, creating potential pressure on production continuity and product availability. From an investment perspective, the company’s existing 650,000-square-foot Irwindale manufacturing facility and automated production infrastructure provide an established industrial base.
- In 2025, Unilever reported total group turnover of €50.5 billion, while its Foods business generated €12.9 billion in turnover, with underlying sales growth of 2.5%.
Report Scope
| Report Features | Description |
|---|---|
| Market Value (2025) | USD 2.9 Bn |
| Forecast Revenue (2035) | USD 5.5 Bn |
| CAGR (2026-2035) | 6.7% |
| Base Year for Estimation | 2025 |
| Historic Period | 2020-2024 |
| Forecast Period | 2026-2035 |
| Report Coverage | Revenue Forecast, Market Dynamics, Competitive Landscape, Recent Developments |
| Segments Covered | By Product Type (Hot Sauce, Sriracha Sauce, Chili-Garlic Sauce, Sweet Chili Sauce, Others), By Packaging Type (Bottles, Pouches, Sachets and Single-Serve Packs, Others), By Distribution Channel (Retail, Hypermarkets and Supermarkets, Convenience Stores, Online Stores, Others, HoReCa/Foodservice, Restaurants, Hotels, Catering) |
| Regional Analysis | North America – US, Canada; Europe – Germany, France, The UK, Spain, Italy, Rest of Europe; Asia Pacific – China, Japan, South Korea, India, Australia, Singapore, Rest of APAC; Latin America – Brazil, Mexico, Rest of Latin America; Middle East & Africa – GCC, South Africa, Rest of MEA |
| Competitive Landscape | McCormick & Company, Incorporated, McIlhenny Company, The Kraft Heinz Company, Huy Fong Foods, Inc., Grupo Herdez, S.A.B. de C.V., Lee Kum Kee International Holdings Ltd., Kikkoman Corporation, Unilever PLC, Chung Jung One, Lao Gan Ma, Cholula Food Company, LLC, Masan Group Corporation, Other Key Players |
| Customization Scope | Customization for segments, region/country-level will be provided. Moreover, additional customization can be done based on the requirements. |
| Purchase Options | We have three licenses to opt for: Single User License, Multi-User License (Up to 5 Users), Corporate Use License (Unlimited User and Printable PDF) |