
Quick Navigation
Report Overview
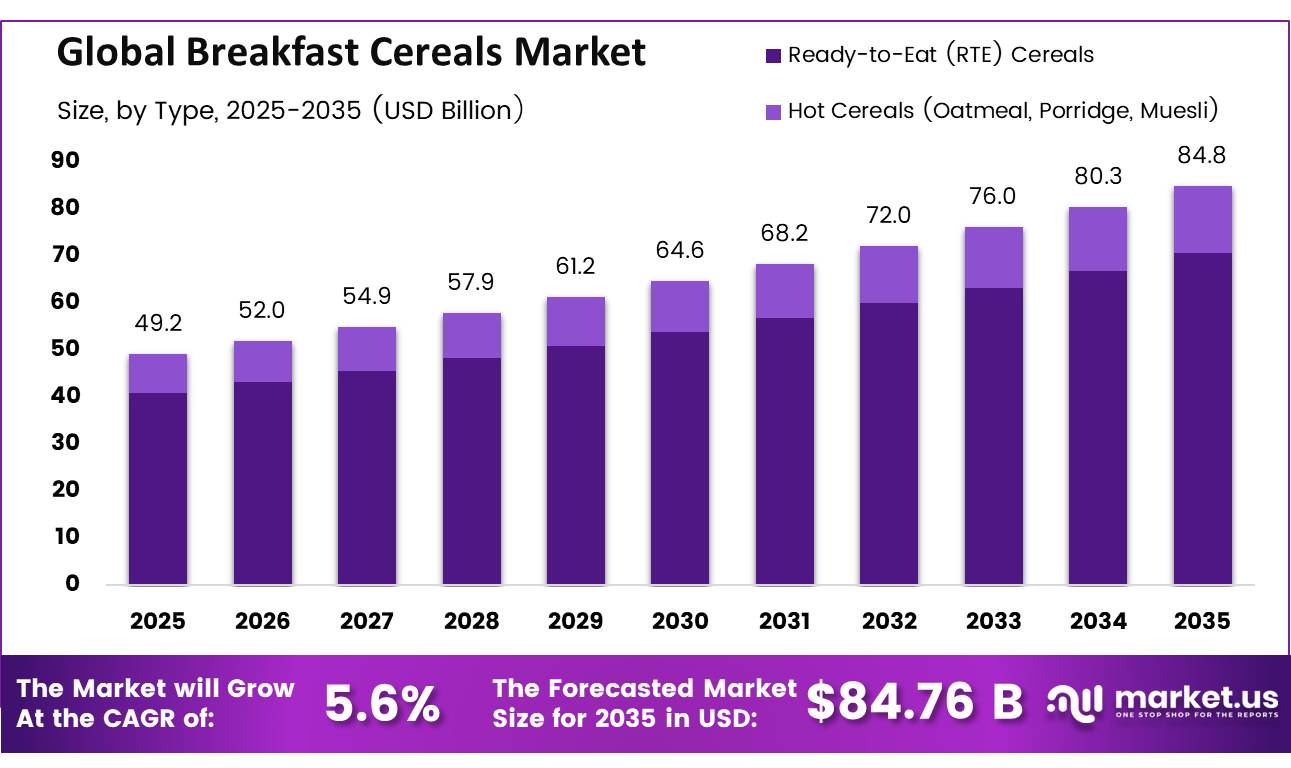
The Global Breakfast Cereal Market size is expected to be worth around USD 84.8 Billion by 2035, up from USD 49.2 Billion in 2025, growing at a CAGR of 5.6% during the forecast period from 2025 to 2035. In 2025, North America led the market, achieving over 32.50% share with a revenue of USD 17.31 Billion.
Breakfast cereal is a food category based on grains such as corn, wheat, oats, rice and barley. It includes ready-to-eat flakes, puffs, granola and muesli, and hot cereals. The industry connects grain farming, milling, extrusion, baking, fortification, flavouring, packaging and distribution. Its value today lies in convenience, shelf life, portion control and the ability to deliver fibre, vitamins and minerals.
- In June 2026, the Food and Agriculture Organization estimated global cereal production at 3,036 million tonnes for 2025, while cereal trade was placed at 508.6 million tonnes for 2025/26. FAO also projected a 31.7% global cereal stock-to-use ratio for 2026/27.
Key Takeaways
- The global Breakfast Cereals market was valued at USD 49.20 billion in 2025.
- The global Breakfast Cereals market is projected to grow at a CAGR of 5.6% and is estimated to reach USD 84.76 billion by 2035.
- On the basis of type, the Ready-to-Eat (RTE) Cereals dominated the market, constituting 83.20% of the total market share.
- Based on the nature, the conventional dominated the Breakfast Cereals market, with a substantial market share of around 68.50%.
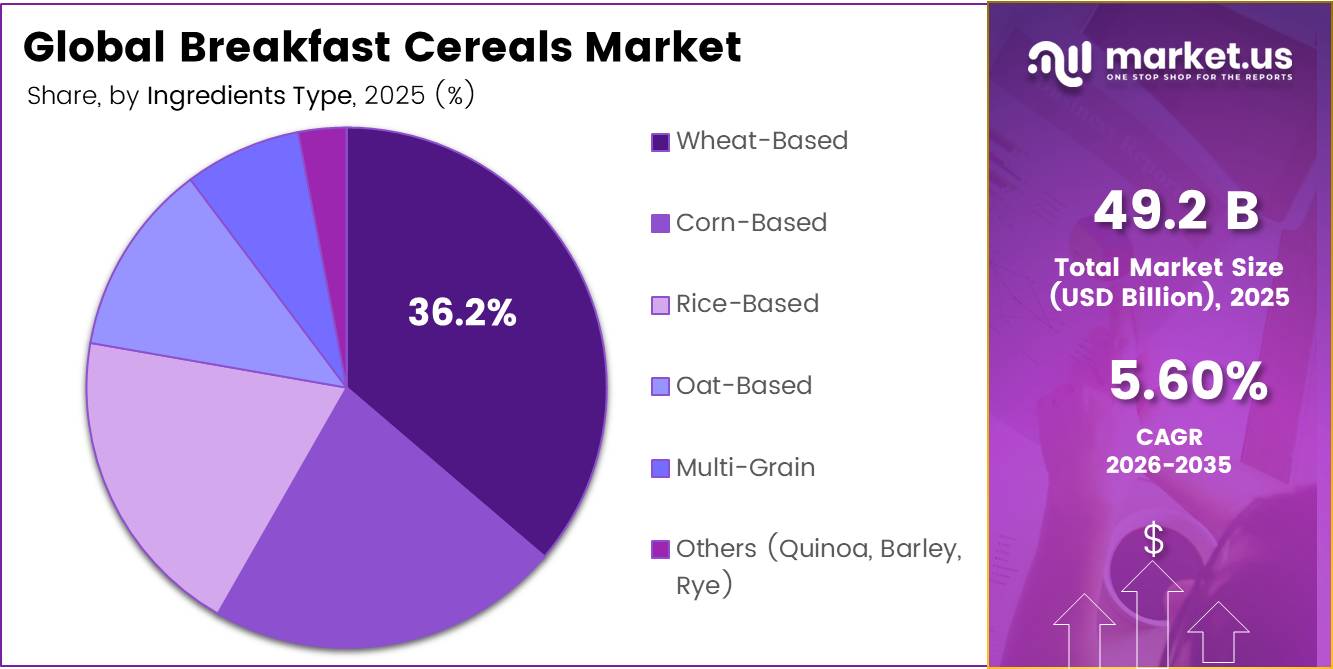
- Based on the Ingredient, Wheat-Based led the market, comprising 36.25% of the total market.
- Among the packaging, the Boxes / Cartons held a major share in the Breakfast Cereals market, 54% of the market share.
- Among the Distribution Channel, the Supermarkets & Hypermarkets is the most considerable within the market, accounting for around 54.70% of the revenue.
- In 2025, the North America was the most dominant region in the battery separator market, accounting for 35.20% of the total global consumption
These volumes provided manufacturers with a broad supply base for maize, wheat, rice and oat-based products. Europe also offers a strong processing network, as its food and drink industry generates approximately €1.2 trillion in turnover, employs 4.7 million people, creates €250 billion in value added and includes 304,000 companies, around 99% of which are small and medium-sized businesses.
Demand is increasingly shaped by consumers seeking convenient nutrition, but regulation is changing cereal formulations. From July 1, 2025, USDA school-meal standards limited breakfast cereals to no more than 6 grams of added sugar per dry ounce. U.S. schools must also ensure that 80% of weekly grain offerings are primarily whole grain, meaning they contain at least 50% whole grains. Reformulation remains important because school breakfasts currently obtain about 17% of their calories from added sugars, while approximately 70%–80% of school-aged children exceed the recommended added-sugar limit. USDA has invested more than US$5 billion in school nutrition since 2021, including US$100 million for the Healthy Meals Incentives Initiative.
Government food programmes create another demand channel. USDA’s School Breakfast Program served 2.5 billion breakfasts in fiscal 2024 at a cost of US$5.7 billion. Updated school nutrition standards retain the requirement that 80% of weekly grain offerings must be primarily whole grain, meaning they contain at least 50% whole grains. This framework supports compliant cereals for schools and encourages suppliers to control added sugar, sodium and serving size.
Breakfast Cereals Market Segments
By Type Analysis
Ready-to-Eat (RTE) cereals are the leading segment in the market.
Ready-to-Eat (RTE) cereals dominate the breakfast cereal industry, holding an 83.20% market share due to their widespread use in busy urban households, among school-aged children, and as convenient snacks. Their ease of use, long shelf life, and capability to meet no-preparation morning needs have made them the favoured option for modern consumer lifestyles occupying an average of 4.5 linear meters of shelf space per corporate store layout.
As cities expand and life moves faster, more people are turning to ready-to-eat (RTE) cereals as a quick morning fix. This shift, combined with the rapid rise of 10-minute grocery delivery apps, has pushed manufacturers to ramp up production and get creative with grain processing.
Leading manufacturers are cutting out extra salt often slashing sodium by about 30 milligrams per serving while packing in at least 3 grams of dietary fiber to earn coveted “heart-healthy” stickers on the front of boxes . This recipe makeover is paying off; in cereal-loving regions like North America, the average person still buys an impressive 14.2 kilograms of cereal every year, cementing cold cereal’s spot as the ultimate global breakfast staple.
By Nature Analysis
Conventional Formulations Dominates the Breakfast Cereal Market
Conventional breakfast cereals, accounting for 68.50% of the market, represent the dominant formulation segment due to their superior performance characteristics in a global industry valued at $68.32 billion. The conventional manufacturing process enables the formation of highly uniform grain extrusions with optimized flavour stability, which enhances shelf longevity and keeps household consumption high at an average of 9.4 kilograms of traditional cereal annually. These attributes make conventional cereals particularly suitable for family-sized distribution networks and discount grocery frameworks, where high consumption volumes and reliable cost performance are essential.
Compared to organic alternatives and gluten-free variants, conventional cereals offer improved price-to-volume ratios, better texture preservation, and enhanced compatibility with long-term international supply chains. Their ability to support automated, high-speed line production also contributes to a voluntary 25% reduction in artificial preservatives to remain competitive with niche brands without raising retail prices.
By Ingredients Analysis
Wheat-Based Cereals represent dominant segment in the market
Wheat-based cereals continue to dominate the global breakfast cereals market with a 36.25% market share, mainly due to strong consumer familiarity, affordability, and processing efficiency. In 2025, around 64% of consumers preferred wheat-based ready-to-eat cereals because they stay crunchy longer in milk and offer better bowl-life durability compared to other grains. Wheat’s cost efficiency has also made it attractive during periods of economic pressure, with nearly 71% of budget-conscious consumers continuing to choose wheat cereals for their affordability.
Oat-based cereals are emerging as one of the fastest-growing segments. About 58% of consumers prefer oats for their heart-health and cholesterol-lowering benefits, while 74% of fitness-focused buyers choose oat products because they provide longer satiety and support weight management. This demand has driven a 14.2% increase in oat-based product launches, including high-protein granolas, instant oat cups, and ready-to-eat porridge options.
By Packaging
Boxes and Cartons Lead the Breakfast Cereal Packaging Market
Breakfast cereal packaging is currently dominated by cartons and boxes with 54% of market share, which remain the leading global format due to their strong presence across retail supply chains and long-established consumer familiarity. They are cost-effective to produce, easy to transport and stack, and highly efficient for inventory management in stores. Their large surface area also provides valuable space for branding, nutritional information, and promotional messaging, helping products stand out on crowded shelves.
single-serve cups and bowls are the fastest-growing packaging segment in the cereal market. Their growth is driven by increasing demand for convenience, particularly among busy urban consumers, students, and travelers. These formats are pre-portioned and ready-to-eat, requiring no additional preparation, which makes them ideal for on-the-go lifestyles. Rising health awareness and preference for portion control also support their adoption, while brands continue to innovate with portable, mess-free designs to capture this expanding consumer need.
By Distribution Channel
Supermarkets & Hypermarkets Dominates Cereal Distribution Segment
Supermarkets and hypermarkets hold the leading position within the cereal value chain, with a 54.70% market share. The key to their dominance lies in high product availability, competitive prices, and the convenience of purchasing multiple items in one location. Approximately 73% of household buyers favor supermarkets and hypermarkets due to the availability of various cereal brands and pack sizes. Additionally, 66% of thrifty households depend on store-brand cereals to cope with inflationary effects. Large retailers enjoy better bargaining power, making it possible to offer regular discounts and bundled products, increasing purchase volume.
Online Retailing turns out to be the Fastest Growing Distribution Channel Based on Convenience and Digitization. It growing rapidly because of increasing demands for convenience and digitized grocery shopping. Around 56% of urban consumers are inclined towards online channels for their everyday grocery needs. Growth in this sector is facilitated by the use of auto-refill subscriptions, which are adopted by 68% of online customers, as well as quick commerce platforms that have resulted in an upsurge of 44% in impulse purchasing of ready-to-eat cereals. Online platforms enable consumers to gain greater insight into prices while increasing availability of niche health cereals.
Key Market Segments
By Type
- Coated Separator Ready-to-Eat (RTE) Cereals
- Non-coated Separator Hot Cereals (Oatmeal, Porridge, Muesli)
By Nature
- Conventional
- Organic
- Gluten-Free
By Ingredients
- Wheat- Based
- Corn-Based
- Rice-Based
- Oat-Based
- Multi-Grain
- Others (Quinoa,Barley,Rye)
By Packaging
- Boxes / cartons
- Pouches / Bags
- Single-Serve Packs
- Others
By Distribution Channel
- Supermarkets & Hypermarkets
- Convenience Stores
- Online Retail
- Specialty Health Stores
- Others
Driver Analysis
Sugar reduction and whole-grain reformulation
A second major driver is nutritional reformulation, which is helping cereal preserve relevance under tightening public-health scrutiny and changing shopper preferences. European cereal reporting in 2026 showed that breakfast cereals cut sugar by 18% over the last decade while increasing whole grain by 23% and fiber by 21%, indicating that reformulation is no longer incremental but category-wide.
Industry examples also show brand-level compliance pressure translating into action: Nestlé cereal operations previously removed 59 million teaspoons of sugar from key family brands, and wider European commitments targeted 20% sugar reduction in children’s products by 2025. The strategic impact is important because reformulation expands the addressable consumer base into health-conscious households, improves retailer acceptance in stricter markets, and protects volumes from policy or front-of-pack pressure, while enabling brands to defend premium pricing through “better-for-you” claims instead of relying on nostalgia alone.
Drivers Impact Analysis
| Driver | (~) % Impact on CAGR Forecast | Geographic Relevance | Impact Timeline |
|---|---|---|---|
| Protein and functional cereal premiumization | +2.1% | North America core, U.K., EU, Australia, urban APAC | Short term (≤ 2 years) |
| Sugar reduction and whole-grain reformulation | +1.7% | EU core, U.K., North America, developed APAC | Medium term (2-4 years) |
| E-commerce and online grocery expansion | +1.4% | North America, China, India metros, U.K., EU-5 | Short term (≤ 2 years) |
| Urban convenience and on-the-go breakfast formats | +1.9% | APAC corridors, North America, Latin American cities, GCC | Medium term (2-4 years) |
| Emerging-market household penetration gains | +1.6% | India, Southeast Asia, Middle East, Africa urban clusters | Long term (≥ 4 years) |
| Private-label and value-tier innovation | +1.3% | Europe core, U.S., Canada, price-sensitive APAC | Medium term (2-4 years) |
Restraint Analysis
Mature-market volume stagnation
A deeper structural restraint is simple category maturity in developed markets, where cereal is widely distributed but no longer culturally dominant as the default breakfast choice, making incremental growth harder to capture without unusually strong innovation. U.S. ready-to-eat cereal unit sales rose 5.2% in 2020 but then dropped 8.7% in 2021, according to reporting that framed cereal as a long-decline category even though profit pools remain attractive for well-managed brands.
More recent trade coverage showed major players still seeing soft category momentum, with General Mills’ RTE cereal dollar sales down 2.7% in one tracked period despite continued innovation efforts, reinforcing that premiumization can protect value better than it restores broad-based volume. This matters strategically because a mature category must spend more per unit of growth—on product refreshes, claims substantiation, packaging changes, and retail support—while competing not just with rival cereals but with yogurt, breakfast sandwiches, smoothies, eggs, and meal bars, which lowers the ceiling for baseline CAGR in North America, Western Europe, and Japan.
Restraint Impact Analysis
| Restraint | (~) % Impact on CAGR Forecast | Geographic Relevance | Impact Timeline |
|---|---|---|---|
| Grain and sugar inflation | -1.8% | North America, EU, APAC importers, LATAM | Short term (≤ 2 years) |
| HFSS promotion limits | -1.5% | U.K., EU regulatory hubs | Medium term (2-4 years) |
| Mature-market volume stagnation | -1.6% | U.S., Canada, Western Europe, Japan | Long term (≥ 4 years) |
| Food-safety recall risk | -1.1% | North America core, EU, Australia | Short term (≤ 2 years) |
| Health-perception discount | -1.3% | Global, strongest in urban developed markets | Medium term (2-4 years) |
| Packaging and input pass-through | -1.0% | Europe, North America, developed APAC | Medium term (2-4 years) |
Opportunity Analysis
Subscription and refill bundles
Recurring-revenue cereal models remain largely untapped even though cereal is one of the most naturally replenishable products in food retail, with stable shelf life, predictable consumption cadence, and strong cross-sell potential with milk alternatives, bars, granola, and snack packs. Global online grocery was projected to grow from $655.51 billion in 2025 to $794.86 billion in 2026, yet most cereal companies still treat digital as a listing channel rather than a relationship channel.
The opportunity is to build subscription or auto-replenishment bundles segmented by household type—kids, fitness, diabetic-friendly, high-fiber, or value families—thereby lowering reorder friction and smoothing promotional volatility. This is upside above baseline because it requires operational redesign, including direct CRM, pack customization, retention analytics, and bundling logic; if executed well, it can reduce customer acquisition cost by 15%–25%, increase lifetime value by 25%–40%, and improve forecast accuracy through more stable reorder cycles.
Opportunity Impact Analysis
| Opportunity | (~) % Potential CAGR Upside | Geographic Relevance | Execution Window |
|---|---|---|---|
| Personalized functional cereal | +2.2% | North America, U.K., EU-5, Japan, South Korea | Medium term (2-4 years) |
| Adult wellness dayparts | +1.9% | U.S., Canada, Western Europe, Australia | Short term (≤ 2 years) |
| Subscription and refill bundles | +1.6% | North America core, U.K., urban APAC | Short term (≤ 2 years) |
| Emerging-market sachet plays | +2.0% | India, Southeast Asia, Africa urban clusters, GCC | Medium term (2-4 years) |
| Private-label premium white space | +1.5% | Europe core, U.S., Canada | Medium term (2-4 years) |
| Brand roll-up and platform M&A | +1.4% | North America, Western Europe | Long term (≥ 4 years) |
Challenges Analysis
Forecasting amid input swings
A persistent challenge for cereal manufacturers is not simply high input costs but the operational difficulty of forecasting procurement, pricing, and promotional calendars when grain, sugar, cocoa, and freight inputs move on different cycles and pass through different supplier contracts. Breakfast cereal plant economics still carry a heavy raw-material burden, with one 2026 manufacturing cost profile placing raw materials at roughly 60%–70% of total cost, which means even a 3%–5% planning error in commodity assumptions can materially distort gross-margin expectations.
FAO data in 2026 also show cereal prices and sugar prices moving differently month to month, while cocoa remained highly volatile through 2025–2026, creating cross-input mismatch rather than a single-direction inflation story. The challenge is ongoing because manufacturers must lock promotions with retailers weeks in advance, yet procurement visibility is shorter than merchandising visibility, forcing heavier use of hedging, safety stock, and conservative trade-spend assumptions that protect cash flow but suppress upside conversion.
Challenges Impact Analysis
| Challenge | (~) % CAGR Friction Drag | Geographic Relevance | Mitigation Horizon |
|---|---|---|---|
| Forecasting amid input swings | -1.1% | North America, EU, APAC importers | Medium term (2-4 years) |
| Packaging format complexity | -0.9% | North America, Europe, developed APAC | Medium term (2-4 years) |
| Retail shelf productivity pressure | -0.8% | U.S., Canada, U.K., EU-5 | Short term (≤ 2 years) |
| Processing labor shortages | -1.0% | U.S., EU, Australia, Canada | Long term (≥ 4 years) |
| Multi-origin logistics disruption | -0.9% | Europe-Asia corridors, MENA, global importers | Medium term (2-4 years) |
| Reformulation execution strain | -0.8% | U.K., EU regulatory hubs, North America | Medium term (2-4 years) |
Geopolitical Impact Analysis
Geopolitical Realignment and Supply Chain Fragmentation Reshape the Breakfast Cereals Market.
Geopolitical conflicts are altering the global production of breakfast cereals through interference in agriculture supply chains and dependency on sourcing raw materials. The industry is still very centralized, as only ten countries hold approximately 80% of the world’s total wheat export capacity, making the industry dependent in its upstream supply chain, milling facilities, and fertilizers.
Logistical interruptions in grain exporting areas like the Black Sea region have interfered with transportation and destroyed grain storage facilities. This has made it necessary for manufacturers to move sourcing away from conventional suppliers in Europe to other sources, including domestic sources.
Trade barriers and tariff hikes are adding additional pressure on cost considerations within the entire value chain. In many instances, tariffs on agricultural inputs and anti-dumping policies have become high enough at an effective rate of up to 160%, thereby inflating the cost of importing grains and fertilizers.
While these problems have been encouraging regionalization efforts, with both North America and Europe stepping up efforts in the localized production of crops, the centralization of global crop production is still leaving cereal producers vulnerable to price fluctuations, longer lead times, and supply uncertainties.
Regional Analysis
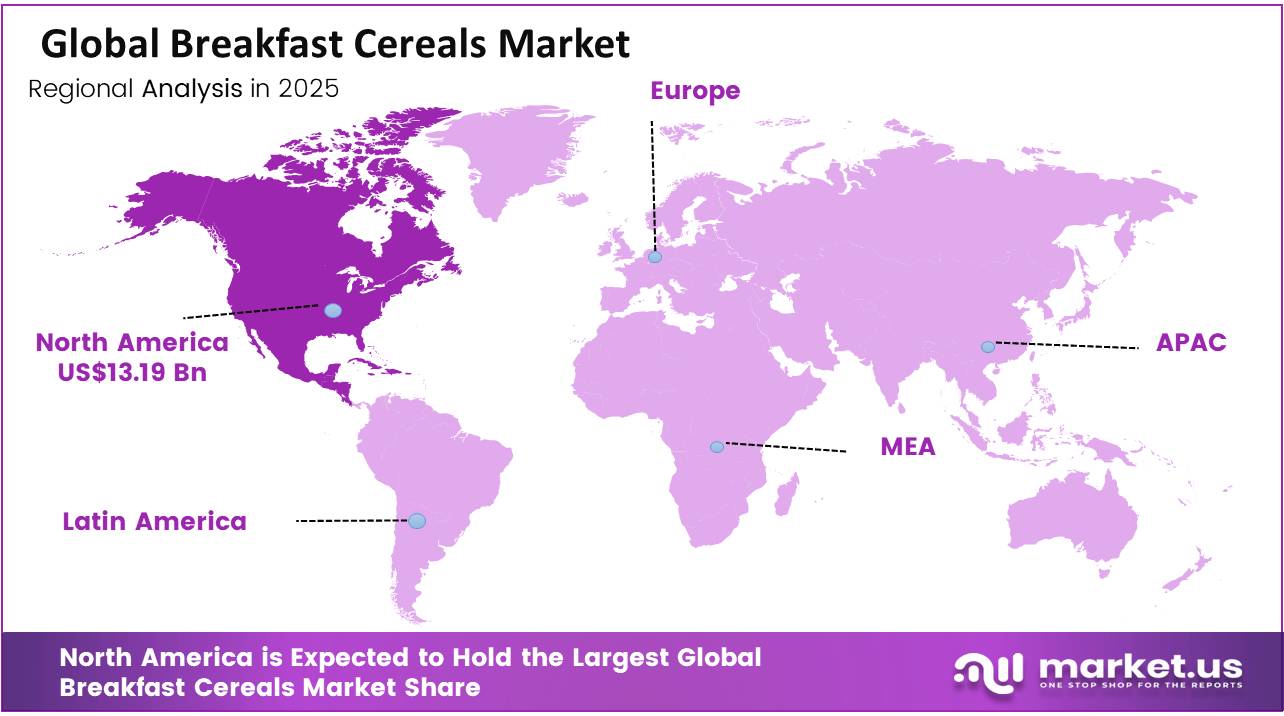
North America Held the Largest Share of the Breakfast Cereals Market.
North America dominates the global solar powered cars market with its 32.50% share in revenues by 2025, supported by rising premiumization, evolving health regulations, and ongoing supply chain improvements. Consumer preferences are increasingly shifting toward healthier and more functional breakfast options, with stronger demand for products rich in fiber, protein, and essential nutrients. This has also encouraged greater interest in gluten-free, organic, and other clean-label formulations across the region.The market is also being reshaped by a clear move toward premium and nutrition-focused offerings.
Asia-Pacific is the fastest-growing region, driven by rapid urbanization, rising incomes, and shifting dietary habits toward quick and convenient breakfast options. Growth is further supported by expanding convenience retail networks and strong e-commerce adoption. Large markets such as China and India are leading demand, prompting global brands to localize production and adapt formulations to regional preferences.
Key Regions and Countries Covered
- North America
- The US
- Canada
- Europe
- Germany
- France
- The UK
- Spain
- Italy
- Russia & CIS
- Rest of Europe
- APAC
- China
- Japan
- South Korea
- India
- ASEAN
- Rest of APAC
- Latin America
- Brazil
- Mexico
- Rest of Latin America
- Middle East & Africa
- GCC
- South Africa
- Rest of MEA
Key Players Analysis
It must be noted that the global market of breakfast cereals enjoys an oligopoly nature. High levels of market concentration characterize developed countries, while fragmentation occurs in developing economies. Although a wide range of different branded products can be found in supermarkets’ shelves, the lion’s share of the market is occupied by only several multinational firms producing CPG.
Specifically, the leading four companies hold around 80%–85% of all sales in developed economies such as North America and Western Europe. The companies’ success is determined by their good retail presence, well-developed facilities, and marketing activities. Instead of fighting with each other over prices, which is unprofitable for businesses and consumers alike, they concentrate on innovating their products and flavoring.
The Major Players In The Industry
- Kellogg Co
- General Mills, Inc.
- Post Holdings, Inc.
- Nestlé S.A.
- PepsiCo, Inc.
- Nature’s Path Foods Inc.
- Calbee, Inc.
- B&G Foods, Inc.
- Bob’s Red Mill Natural Foods, Inc.
- Marico Limited
- Gluten-Free Prairie, LLC
- Avena Foods Limited
- The Quaker Oats Company
- Other Key Players
Key Development
- In February 2026, Nestlé S.A. expanded its European breakfast cereal range by rolling out protein-fortified variants of its iconic chocolate lines, launching Chocapic Protein and Lion Protein to capture the rapidly growing demand for high-protein breakfast items.
- In March 2026, General Mills Inc. unveiled a comprehensive U.S. clean-label infrastructure initiative, confirming the finalization of new production lines to launch naturally-colored breakfast cereals ahead of its scheduled summer 2026 removal of all certified synthetic colors
Report Scope
| Report Features | Description |
|---|---|
| Market Value (2025) | US$49.20 Bn |
| Forecast Revenue (2035) | US$84.76 Bn |
| CAGR (2026-2035) | 5.6% |
| Base Year for Estimation | 2025 |
| Historic Period | 2020-2025 |
| Forecast Period | 2026-2035 |
| Report Coverage | Revenue Forecast, Market Dynamics, Competitive Landscape, Recent Developments |
| Segments Covered | By Type (Ready-to-Eat Cereals, Hot Cereals), By Nature (Conventional, Organic, Gluten-Free), By Ingredient (Wheat-Based, Corn-Based, Rice-Based, Oat-Based, Multi-Grain, Others), By Packaging (Boxes/Cartons, Pouches/Bags, Single-Serve Packs, Others), By Distribution Channel (Supermarkets & Hypermarkets, Convenience Stores, Online Retail, Specialty Health Stores, Others) |
| Regional Analysis | North America – The US & Canada; Europe – Germany, France, The UK, Spain, Italy, Russia & CIS, Rest of Europe; APAC– China, Japan, South Korea, India, ASEAN & Rest of APAC; Latin America– Brazil, Mexico & Rest of Latin America; Middle East & Africa– GCC, South Africa, & Rest of MEA |
| Competitive Landscape | Kellogg Co ,General Mills, Inc. , Post Holdings, Inc. , Nestlé S.A. ,PepsiCo, Inc. , Nature’s Path Foods Inc. , Calbee, Inc. , B&G Foods, Inc. , Bob’s Red Mill Natural Foods, Inc. , Marico Limited , Gluten-Free Prairie, LLC, Avena Foods Limited , The Quaker Oats Company ,Other Key Players |
| Customization Scope | Customization for segments, region/country-level will be provided. Moreover, additional customization can be done based on the requirements. |
| Purchase Options | We have three licenses to opt for: Single User License, Multi-User License (Up to 5 Users), Corporate Use License (Unlimited Users and Printable PDF) |


