


Report Overview
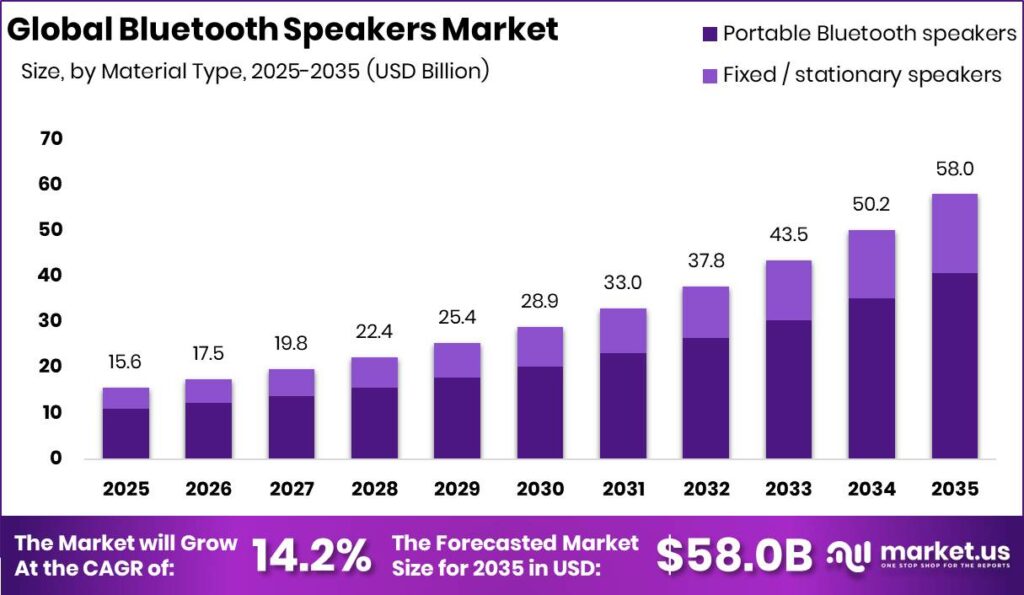
Global Bluetooth Speakers Market size is expected to be worth around USD 58.0 Billion by 2035 from USD 15.6 Billion in 2025, growing at a CAGR of 14.2% during the forecast period 2026 to 2035. This trajectory reflects steady replacement cycles and rising wireless audio adoption. Vendors who scale distribution early will capture the widening consumer base before pricing pressure intensifies.
The Bluetooth Speakers Market covers wireless audio devices that stream sound from phones, tablets, and computers over short-range radio. Manufacturers structure the market across product type, connectivity type, price range, and distribution channel. This layered structure lets brands target distinct buyers, from budget outdoor users to premium home listeners. Companies that map products to clear segment needs sharpen positioning and defend margin against commodity entrants.
Key Takeaways
- Global market value reaches USD 58.0 Billion by 2035 from USD 15.6 Billion in 2025 at a CAGR of 14.2%.
- Portable Bluetooth speakers lead the product type segment with a 70.1% share.
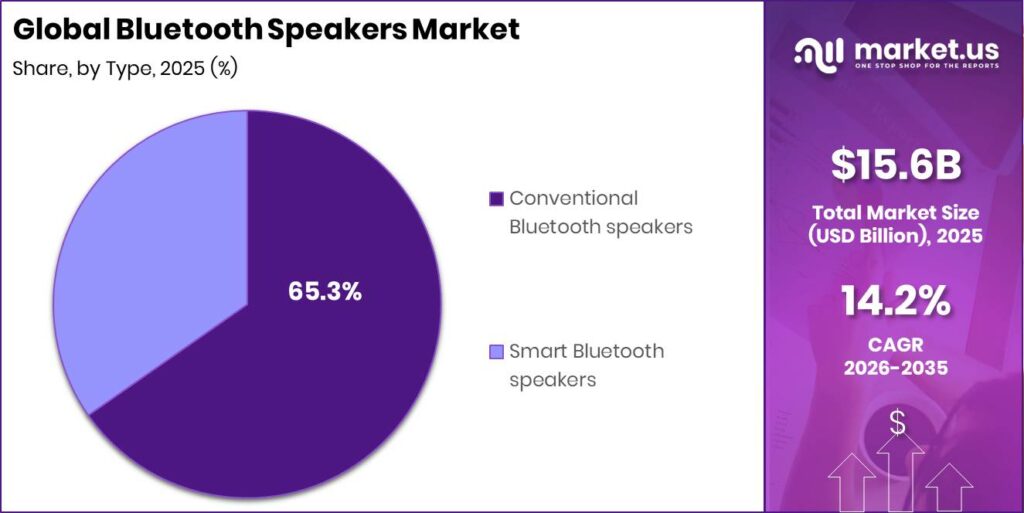
- Conventional Bluetooth speakers dominate the type segment with a 65.3% share.
- Low and budget speakers hold the largest price range share at 45.3%.
- Offline channels command 55.1% of distribution.
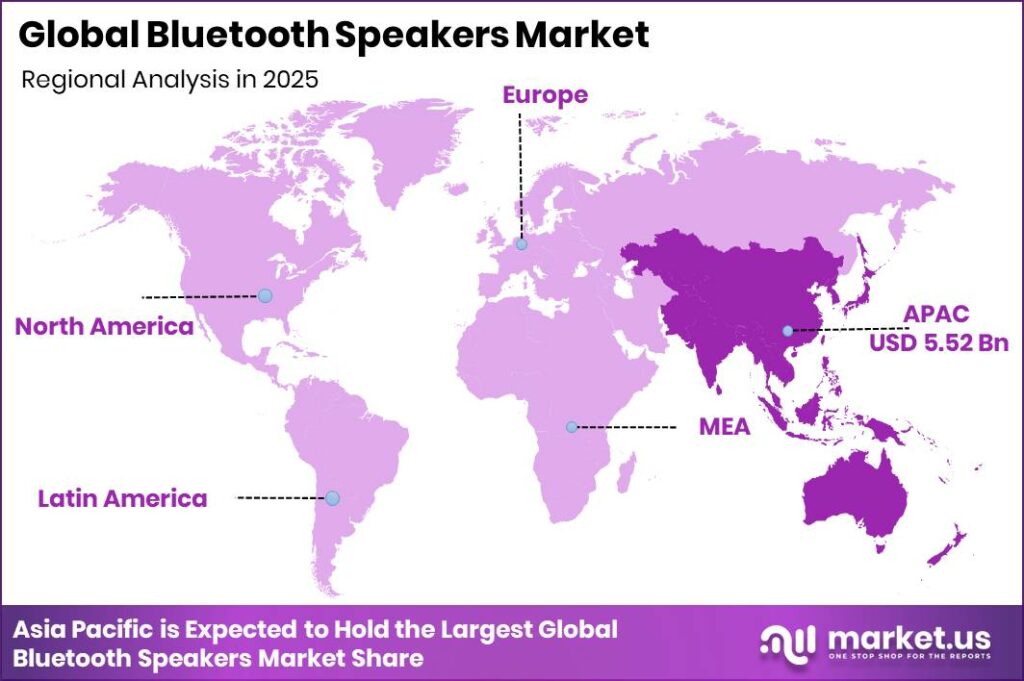
- Asia Pacific leads regionally with a 35.3% share, valued at USD 5.52 Billion.
Government spectrum policy shapes this market directly. Regulators worldwide license the 2.4 GHz band that Bluetooth relies on, and radio equipment rules in the EU and other regions set testing and compliance standards for every speaker sold. This means brands must certify products before market entry. Companies that build compliance into design early avoid costly redesigns and reach shelves faster than reactive rivals.
As reported by the Sonos fiscal 2025 10-K filing, Sonos reached roughly 17.1 million registered households globally by September 27, 2025. This installed base shows how ecosystem lock-in builds recurring hardware demand. Brands that cultivate loyal multi-device households secure repeat sales and reduce their exposure to price-driven switching.
Data from the Sonos fiscal 2025 10-K filing shows 61% of Sonos households owned more than one product in fiscal 2025. This attachment pattern proves that satisfied buyers expand their setups over time. This signals a clear revenue path for vendors who design speakers to pair and grow within one connected home system.
Product Type Analysis
Portable Bluetooth speakers dominate with 70.1% due to strong outdoor and travel demand.
In 2025, Portable Bluetooth speakers held a dominant market position in the By Product Type segment of Bluetooth Speakers Market, with a 70.1% share. Global Bluetooth device shipments reached 5 billion units in 2025, per Bluetooth SIG data, expanding the pool of source devices that pair with portable units. This scale rewards brands that prioritize compact, rugged designs. Companies leading in portability will keep capturing the largest volume tier.
Fixed and stationary speakers serve home listening rooms where users value larger drivers and constant power. Marshall commercially released the Kilburn III in July 2025, offering up to 50 hours of playback and Bluetooth LE Audio readiness. Bluetooth SIG projects shipments rising to 8 billion units by 2029. This creates durable demand for premium stationary units that anchor connected home audio.
Type Analysis
Conventional Bluetooth speakers dominate with 65.3% due to lower cost and simpler design.
In 2025, Conventional Bluetooth speakers held a dominant market position in the By Type segment of Bluetooth Speakers Market, with a 65.3% share. GSMA Intelligence reported active smartphone connections surpassing 6.9 billion by end 2024, giving nearly every buyer a device that pairs with basic speakers. This mass compatibility keeps conventional units affordable and widely stocked. Brands that keep costs low will hold this large tier.
Smart Bluetooth speakers add voice assistants and network connectivity for hands-free control. Sonos reported nearly 53.4 million registered products across its households by September 27, 2025, showing appetite for connected audio. This growing installed base rewards vendors who layer smart features onto reliable hardware. Companies investing in assistant integration position for the higher-margin connected segment.
Price Range Analysis
Low and budget speakers dominate with 45.3% due to first-time and price-sensitive buyers.
In 2025, Low and budget speakers held a dominant market position in the By Price Range segment of Bluetooth Speakers Market, with a 45.3% share. Bluetooth SIG forecasts annual device shipments growing at an 8% compound rate through 2029, widening the entry-level buyer pool. This volume favors brands that compete on price and availability. Companies with efficient supply chains will defend this dominant tier.
Medium and premium tiers attract buyers seeking better sound and durable builds. GSMA data shows smartphone penetration exceeding 6.9 billion connections, feeding steady upgrade demand across income levels. This creates room for brands to move loyal budget buyers upmarket. Vendors offering clear performance steps between tiers capture higher lifetime value per customer.
Distribution Channel Analysis
Offline channels dominate with 55.1% due to hands-on audio testing before purchase.
In 2025, Offline channels held a dominant market position in the By Distribution Channel segment of Bluetooth Speakers Market, with a 55.1% share. Bluetooth SIG data shows 5 billion devices shipped in 2025, much of it moving through physical electronics retail. Buyers still want to hear speakers in store. Brands with strong retail placement will keep this channel lead.
Online channels grow as buyers trust reviews and specifications over in-store demos. Sonos maintained roughly 17.1 million registered households by September 27, 2025, many acquired through direct and e-commerce sales. This shift rewards brands that build strong digital storefronts and review presence. Companies investing in online experience will convert the fastest-growing channel.
Key Market Segments
By Product Type
- Portable Bluetooth speakers
- Fixed / stationary speakers
By Type
- Conventional Bluetooth speakers
- Smart Bluetooth speakers
By Price Range
- Low / budget
- Medium
- High / premium
By Distribution Channel
- Offline
- Online
Regional Analysis
Asia Pacific Dominates the Bluetooth Speakers Market with a Market Share of 35.3%, Valued at USD 5.52 Billion
Asia Pacific leads the Bluetooth Speakers Market with a 35.3% share, valued at USD 5.52 Billion. Large manufacturing bases and fast-rising disposable income drive both supply and demand across the region. This dual strength lets local and global brands scale quickly and price competitively. Companies that build regional distribution now will hold ground as the consumer base expands.
North America ranks as a fast-growing region built on premium and outdoor audio demand. JBL launched the Charge 6 in March 2025 with AI Sound Boost, Auracast connectivity, and USB-C lossless audio for rugged outdoor use. This product push signals strong replacement appetite among active lifestyle buyers. Brands targeting durable premium features will win share in this high-value region.
Key Regions and Countries
North America
- US
- Canada
Europe
- Germany
- France
- The UK
- Spain
- Italy
- Rest of Europe
Asia Pacific
- China
- Japan
- South Korea
- India
- Australia
- Rest of APAC
Latin America
- Brazil
- Mexico
- Rest of Latin America
Middle East and Africa
- GCC
- South Africa
- Rest of MEA
Market Dynamics
Market Opportunity Analysis - Underserved price tiers, connected types, and online channels open entry points for focused players
Smart Bluetooth speakers remain underexploited within the type segment, where conventional units hold 65.3% and smart models take the smaller remainder. Most brands still default to simple hardware. This leaves connected, assistant-ready speakers open to specialists. New entrants who focus on smart features can carve defensible share before large players fully commit to the connected tier.
The medium and premium price tiers stay underweight against the 45.3% low and budget lead. Buyers ready to spend more find fewer distinct choices. This gap rewards entrants who build clear step-up value between tiers. Investors backing brands with disciplined premium positioning can capture margin that the crowded budget tier cannot deliver.
Online distribution trails offline at 55.1%, leaving digital share open to capture. Many established brands still lean on retail shelves. This creates room for digital-native challengers to win review-driven buyers. Companies that master e-commerce presence and direct sales can grow faster than rivals anchored to physical retail.
Technology and Innovation Landscape - Connectivity upgrades, AI audio, and durability engineering reshape competitive edges
Bluetooth 5.3 and 5.4 adoption reshapes product design by enabling multi-speaker pairing and low-latency audio across premium and mid-range units. This upgrade lets brands sell paired stereo and multi-room experiences. Manufacturers that adopt the latest connectivity early differentiate their lineups. Buyers gain smoother performance, which supports higher price points on connected products.
AI audio processing marks the next innovation frontier, since fewer than 5 to 8% of shipments carried on-device AI beyond basic equalization by 2025 to 2026. Personalized sound and room correction remain rare in speakers. This creates a clear technical lead for early developers. Manufacturers who invest in AI audio platforms secure a premium moat before the feature diffuses downward.
Durability engineering advances competitive positioning through IP67 and IP68 ratings and extended battery life across new outdoor models. Rugged, long-playing designs meet active lifestyle demand directly. This lets brands justify premiums on portable units. Companies that lead in durability and battery performance defend share in the fast-moving portable tier that dominates volume.
Drivers
Smartphone ubiquity anchors market growth. As reported by GSMA Intelligence, active smartphone connections surpassed 6.9 billion by end 2024, creating a Bluetooth-capable installed base that spans nearly the entire adult consumer population. Buyers who upgrade to phones with Bluetooth 5.0 or above show a 40 to 55% higher chance of buying a speaker within 12 months. This co-adoption pattern hands manufacturers a large, ready pool of first-time buyers.
Streaming platforms deepen the pull. Spotify paid subscribers grew from about 220 million in early 2023 to over 260 million by 2025, and combined paid subscribers across major services topped 700 million globally. Certified-partner distribution lifts premium unit conversion by an estimated 18 to 28% and cuts acquisition cost by 25 to 40%. This means brands that secure ecosystem partnerships gain a durable cost and conversion edge.
| Driver | (~) % Impact on CAGR Forecast | Geographic Relevance | Impact Timeline |
|---|---|---|---|
| Smartphone Ubiquity & Wireless Audio Ecosystem Expansion Driving Mass Adoption | +4.10% | Global — led by Asia Pacific, North America, Europe | Short term (≤ 2 years) |
| Outdoor & On-the-Go Lifestyle Trends Accelerating Portable Speaker Replacement Cycles | +3.20% | North America, Europe, Australia, GCC | Short term (≤ 2 years) |
| Smart Home Integration & Voice Assistant Ecosystem Embedding Bluetooth Speakers as Hubs | +2.40% | United States, Europe, China, Japan, South Korea | Medium term (2–4 years) |
| Rising Disposable Income & Consumer Electronics Premiumization in Emerging Markets | +1.85% | India, Southeast Asia, Latin America, Middle East, Africa | Short term (≤ 2 years) |
| Bluetooth 5.3 & 5.4 Adoption Enabling Multi-Speaker Pairing & Low-Latency Audio | +1.30% | Global — concentrated in premium & mid-range segments | Short term (≤ 2 years) |
| Social Media & Creator Economy Driving Gift & Personal Audio Spending | +0.85% | North America, Europe, Asia Pacific, Latin America | Short term (≤ 2 years) |
Restraints
US tariffs on Chinese components raise production costs sharply. Section 301 duties of 25% and 7.5%, combined with a 10% baseline tariff on imports, hit components that make up an estimated 70 to 80% of supply chain value. Guangdong province alone produces over 60% of finished units. This concentration pushes China-origin landed costs up 32 to 48%, forcing hard pricing choices on brands.
Margin pressure follows directly. A mid-range unit with a China ex-factory cost of USD 22 to 28 now lands in the US at USD 30 to 42, compressing gross margin from 45 to 55% down to 28 to 38%. Shifting to Vietnam or India carries a 15 to 22% cost premium and 12 to 24 month ramp times. This means relief from diversification lags the tariff hit by several quarters.
| Restraint | (~) % Impact on CAGR Forecast | Geographic Relevance | Impact Timeline |
|---|---|---|---|
| US Tariffs on Chinese Consumer Electronics Components Inflating Production Costs | -2.10% | United States, and globally via cost pass-through | Short term (≤ 2 years) |
| Market Saturation in Premium Segments Compressing ASP Growth in Mature Markets | -1.40% | North America, Western Europe, Japan, South Korea | Short term (≤ 2 years) |
| Aggressive Low-Cost Chinese Brands Suppressing Global ASPs & Mid-Tier Margins | -1.10% | Global — most acute in Southeast Asia, India, Latin America | Short term (≤ 2 years) |
| EU Radio Equipment Directive & Ecodesign Regulation Compliance Costs | -0.65% | European Union, United Kingdom | Short term (≤ 2 years) |
| Consumer Upgrade Cycle Elongation Reducing Annual Replacement Demand | -0.42% | North America, Europe, Japan | Medium term (2–4 years) |
Challenges
Commoditization erodes acoustic differentiation. The USD 20 to 80 band now represents an estimated 55 to 65% of global unit volume, as ODM makers push commodity specs to levels once reserved for higher prices. A USD 25 to 35 speaker now delivers 10W output and IPX5 resistance. This erases the acoustic case for mid-tier premiums and squeezes brand pricing power.
The margin damage runs deep. Mid-range gross margins fell from 42 to 52% at USD 59 to 79 retail in 2022 to 28 to 36% by 2025. Each new non-acoustic feature demands USD 2 to 8 million in R&D and 12 to 18 months of development. This means brands must bifurcate toward sub USD 30 volume or above USD 150 premium tiers to defend margin.
| Challenge | (~) % CAGR Friction Drag | Geographic Relevance | Mitigation Horizon |
|---|---|---|---|
| Audio Quality Differentiation & Commoditization Pressure | -1.80% | Global — most acute in USD 20–80 price band | Long term (≥ 4 years) |
| Battery Life & Charging Standard Fragmentation | -1.20% | Global — EU regulatory pressure most acute | Medium term (2–4 years) |
| E-Waste & Repairability Regulation Compliance | -0.95% | European Union, United Kingdom, India | Medium term (2–4 years) |
| Counterfeit & IP Infringement in Online Channels | -0.75% | Southeast Asia, India, Latin America, Middle East | Long term (≥ 4 years) |
| Supply Chain Concentration & Component Lead-Time Volatility | -0.55% | Global — Bluetooth SoC dependency on Qualcomm, MediaTek | Medium term (2–4 years) |
Opportunities
AI-powered spatial audio opens clear white space. As of 2025 to 2026, fewer than 5 to 8% of global speaker shipments carried on-device AI audio processing beyond basic equalization. Premium headphone platforms already trained consumers to expect personalized spatial sound. This gap gives early movers a fresh premium category with little direct competition in the speaker segment.
The unit economics reward action. An AI audio speaker can command a retail ASP of USD 180 to 350 versus USD 60 to 120 for a non-AI equal, lifting gross margin to 48 to 58%. Building the platform needs 18 to 30 months and USD 15 to 35 million, which fewer than 10 to 12 brands had committed by 2025. This preserves first-mover margin capture for a 2 to 4 year window.
| Opportunity | (~) % Potential CAGR Upside | Geographic Relevance | Execution Window |
|---|---|---|---|
| AI-Powered Spatial Audio & Personalised Sound Profile Premiumization | +2.50% | North America, Europe, Japan, South Korea, China | Medium term (2–4 years) |
| Enterprise & Hospitality B2B Channel Expansion | +1.60% | North America, Europe, GCC, Asia Pacific | Medium term (2–4 years) |
| India & Sub-Saharan Africa First-Time Buyer Segment Penetration | +1.25% | India, Nigeria, Kenya, Ethiopia, Ghana | Short term (≤ 2 years) |
| Modular & Repairable Speaker Design for Circular Economy Compliance | +0.80% | European Union, United Kingdom, Australia | Long term (≥ 4 years) |
| Solar-Powered & Energy-Harvesting Speaker for Off-Grid Markets | +0.55% | Sub-Saharan Africa, South Asia, Latin America, Pacific Islands | Long term (≥ 4 years) |
Key Company Insights
JBL anchors its position through a broad portable lineup that targets the outdoor and lifestyle buyer where volume concentrates. The brand pushes rapid feature cycles, adding AI Sound Boost, Auracast broadcasting, and IP68 durability across new models. This cadence keeps JBL visible in retail and review channels. However, heavy reliance on the crowded mid-price band exposes JBL to the commoditization squeezing margins across that tier.
Sony Corporation competes through audio engineering depth and a premium brand that spans headphones and speakers. As reported by the Logitech fiscal 2025 results, rivals in adjacent audio posted US$4.55 billion in net sales, showing the scale Sony must match. Sony’s cross-category R&D lets it move spatial audio features into speakers early. This strength positions Sony to capture premium buyers, though it risks slower volume growth in budget tiers.
Key Players
- JBL
- Bose Corporation
- Sony Corporation
- Apple Inc. (Beats Electronics)
- Samsung Electronics Co., Ltd.
- Sonos Inc.
- Marshall Group AB
- Bang & Olufsen (B&O)
- Ultimate Ears
- Anker Innovations
- boAt
- LG Electronics Inc.
- Panasonic Corporation
- Edifier International Limited
- Sennheiser electronic SE & Co. KG
- Others
Recent Developments
- January 2025: TRIBIT launched the StormBox Lava portable Bluetooth speaker featuring 80W output, XBass technology, Bluetooth 5.4, IP67 protection, and up to 24 hour battery life, targeting the outdoor audio segment.
- March 2025: JBL (Harman) introduced the Flip 7 with AI Sound Boost, Auracast multi-speaker broadcasting, Bluetooth 5.4, USB-C lossless audio playback, and an IP68 rated waterproof and dustproof design.
- June 2025: Bose introduced the SoundLink Plus portable Bluetooth speaker, positioned between the SoundLink Flex and SoundLink Max, featuring one subwoofer, one tweeter, four passive radiators, IP67 durability, and Snapdragon Sound support.
Report Scope
| Report Features | Description |
|---|---|
| Market Value (2025) | USD 15.6 Billion |
| Forecast Revenue (2035) | USD 58.0 Billion |
| CAGR (2026-2035) | 14.2% |
| Base Year for Estimation | 2025 |
| Historic Period | 2020-2024 |
| Forecast Period | 2026-2035 |
| Report Coverage | Revenue Forecast, Market Dynamics, Market Opportunity Analysis, Technology and Innovation Landscape, Competitive Landscape, Recent Developments |
| Segments Covered | By Product Type (Portable Bluetooth speakers, Fixed / stationary speakers), By Type (Conventional Bluetooth speakers, Smart Bluetooth speakers), By Price Range (Low / budget, Medium, High / premium), By Distribution Channel (Offline, Online) |
| Regional Analysis | North America (US and Canada), Europe (Germany, France, The UK, Spain, Italy, and Rest of Europe), Asia Pacific (China, Japan, South Korea, India, Australia, and Rest of APAC), Latin America (Brazil, Mexico, and Rest of Latin America), Middle East and Africa (GCC, South Africa, and Rest of MEA) |
| Competitive Landscape | JBL, Bose Corporation, Sony Corporation, Apple Inc. (Beats Electronics), Samsung Electronics Co., Ltd., Sonos Inc., Marshall Group AB, Bang & Olufsen (B&O), Ultimate Ears, Anker Innovations, boAt, LG Electronics Inc., Panasonic Corporation, Edifier International Limited, Sennheiser electronic SE & Co. KG, Others |
| Customization Scope | Customization for segments, region / country-level will be provided. Additional customization can be done based on requirements. |
| Purchase Options | We have three licenses to opt for: Single User License | Multi-User License (Up to 5 Users) | Corporate Use License (Unlimited User and Printable PDF) |





































