


Report Overview
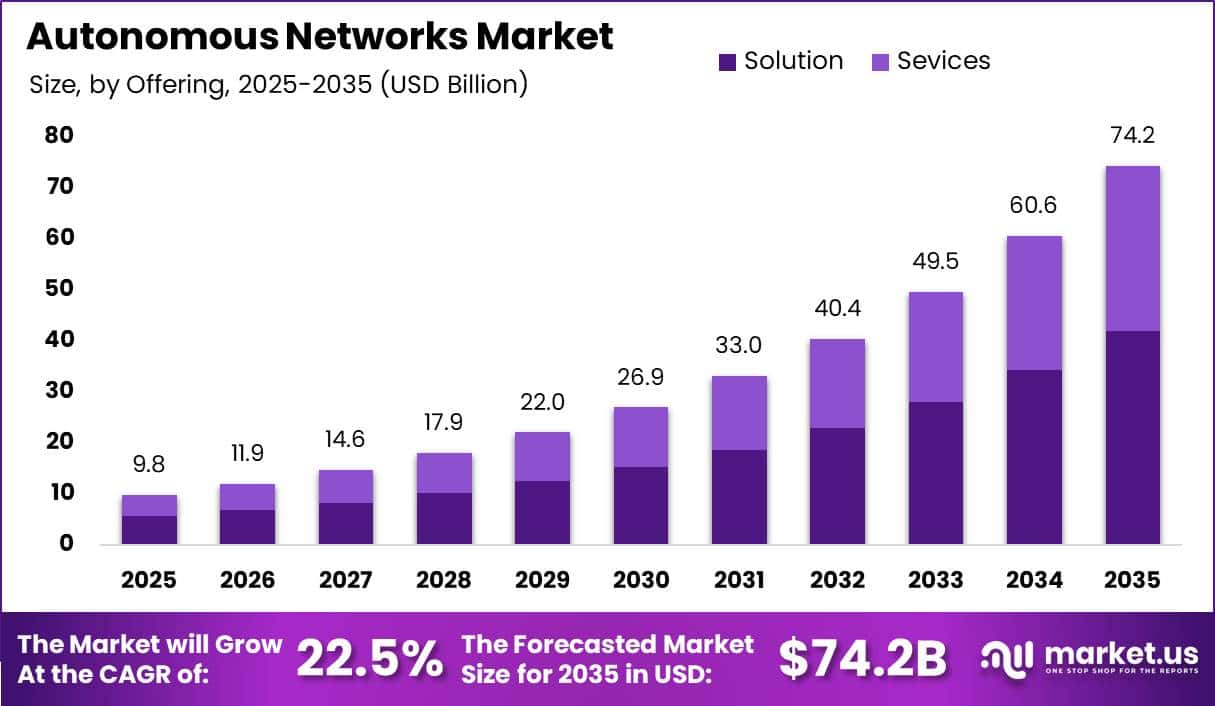
In 2025, the Global Autonomous Networks Market was valued at USD 9.8 billion. The market is projected to grow at a CAGR of 22.5% during 2026–2035, reaching approximately USD 74.2 billion by 2035. North America dominated the global market in 2025, accounting for more than 38.7% of the total market share and generating approximately USD 3.7 billion in revenue.
This growth is supported by the rapid expansion of digital traffic, connected devices, and 5G-based services, which are becoming difficult to manage through manual network operations. In 2025, global 5G connections exceeded 2.7 billion and are expected to contribute nearly USD 1 trillion to the global economy by 2030.
Total IoT connections are forecast to increase from 26.1 billion in 2025 to 38.5 billion by 2030, adding more than 12.4 billion connected endpoints. These devices generate continuous data and require networks with self-configuring, self-healing, and automated monitoring capabilities. Mobile technologies are expected to contribute USD 11 trillion to global GDP by 2030, while mid-band 5G could add around USD 610 billion.
North America region benefits from strong investment in 5G, cloud computing, fintech, and advanced manufacturing. By 2030, more than 50% of global mobile connections are expected to use 5G, while smartphones will represent 91% of connections. Rising traffic, security threats, private 5G networks, fixed wireless access, and industrial IoT deployments are increasing demand for AI-based traffic management, automated security response, and closed-loop network assurance.
Key Takeaway
- The Autonomous Networks Market is valued at USD 9.8 billion in 2025, projected to reach USD 74.2 billion by 2035, and expected to grow at a CAGR of 22.5% during 2026–2035.
- The Solution segment led the offering category with a 56.5% share.
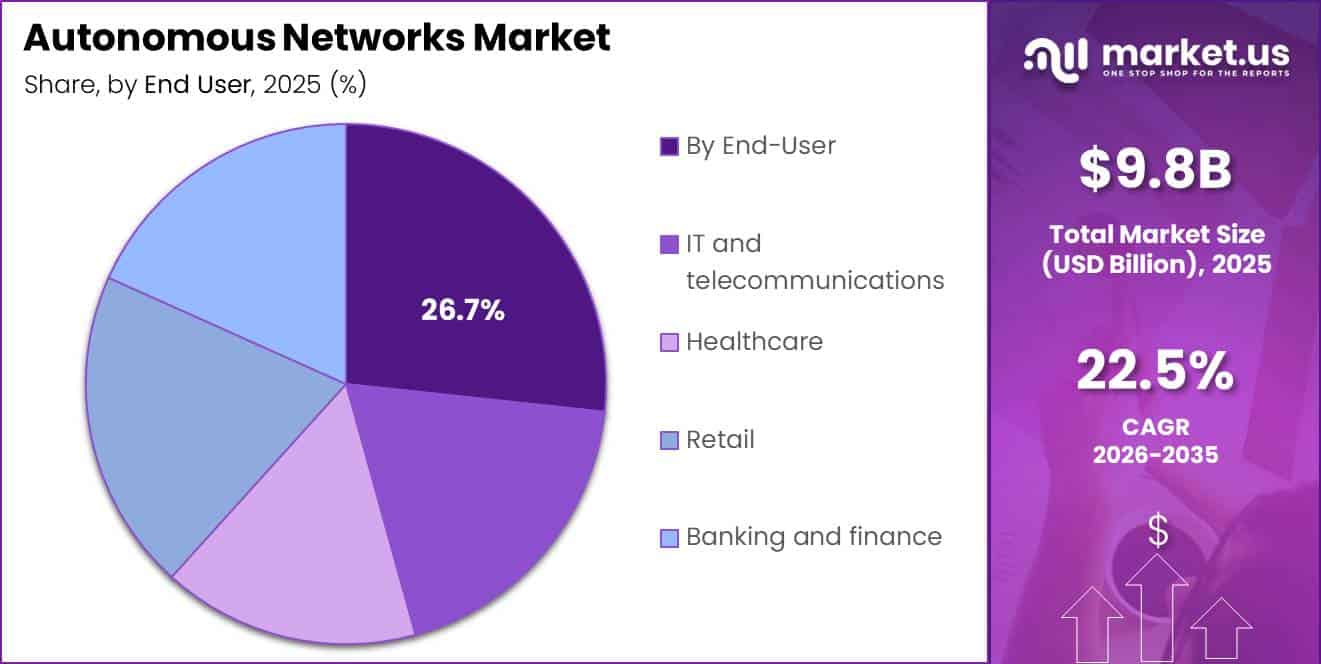
- IT and telecommunications led the end-user category with a 26.7% share.
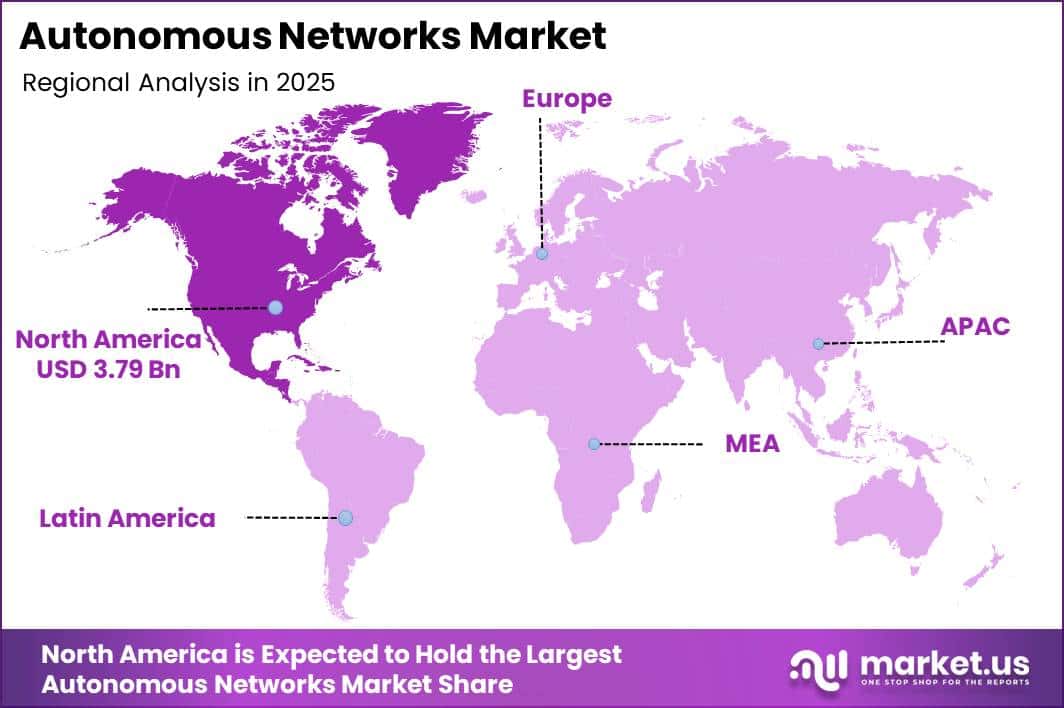
- North America led the market in 2025 with a 38.7% share, worth USD 3.7 billion.
Market Statistics and Data Insights
- GSMA Intelligence forecasts global IoT connections will reach 38.7 billion by 2030, supported by enterprise IoT, smart manufacturing, and connected infrastructure deployments.
- Tata Elxsi’s NEURON platform deployment with Sky improved autonomous network operational efficiency by up to 30%, reduced network change lead times by up to 50%, and lowered network change failure rates by up to 30% in 2026.
- Swisscom’s autonomous operational transformation using Open Digital Architecture achieved 30% cost savings and reduced service extension time from 9 months to 2 weeks in 2025.
- Chunghwa Telecom’s autonomous operations initiative reduced digital service launch time by 7.5 times, cutting deployment duration from 4 months to 9 days, while reducing autonomous transport network operation time by 5 times and lowering CapEx by 16% annually.
- China Mobile’s Level 4 autonomous network operations centre replaced the equivalent workload of 5,500 full-time manual roles through intelligent agents and automated operations by 2025.
- China Mobile’s multi-agent autonomous network project reduced cross-domain fault handling time from hours to minutes, lowered dispatch volume by 22.4%, increased scheduling efficiency by 91%, and shortened recovery time by 16.45%.
- A 2026 research study on agentic AI-based RAN automation achieved 88.5% accuracy in identifying performance-degrading operator intents and recovered 90% of previous network performance after disruptions through self-healing mechanisms.
- Capgemini research on autonomous networks reported that telecom operators achieved a 20% improvement in operational efficiency and an 18% reduction in network operation expenditure through autonomous network initiatives.
- AT&T’s AI-powered incident management system prevented 3.1 million unnecessary technician dispatches and reduced customer downtime by more than 12 million hours through predictive network operations.
- Capgemini reported that 71% of operators reduced energy consumption through autonomous network initiatives and expected a 30% reduction in greenhouse gas emissions over the following five years.
By Offering
The Solution segment held a leading position in the autonomous networks market, accounting for a 56.5% share. Its dominance is supported by the shift in spending from traditional network hardware to intelligent software platforms that can manage complex and multi-vendor networks at scale.
In 2025, global software spending is expected to exceed USD 1.3 trillion, supported by total IT spending of more than USD 5.6 trillion. A growing portion of this investment is directed towards network management, data analytics, artificial intelligence, and automation tools.
Telecom operators and enterprises increasingly require software platforms that can configure millions of connected devices, apply network policies, identify faults, and restore services within seconds instead of hours. These systems use automated orchestration, AI-based performance assurance, and closed-loop controls to reduce manual work and improve network reliability.
By End-User
The IT and Telecommunications segment led the autonomous networks market with a 26.7% share, supported by its large and complex global network infrastructure. Around 8.9 billion mobile-cellular subscriptions are active worldwide, exceeding the global population and creating continuous traffic that requires fast and reliable network management.
Telecommunications operators also invest hundreds of billions of dollars in network development each year. In 2023, global telecom capital expenditure was estimated at nearly USD 315–330 billion, with about 61% directed towards network infrastructure, including radio access networks, transport systems, and core networks. These systems are becoming increasingly software-defined, cloud-based, and virtualised.
Key Market Segments
By Offering
- Solution
- Services
By End-User
- IT and telecommunications
- Healthcare
- Retail
- Banking and finance
- Others
Geopolitical Impact Analysis
Geopolitical tensions are increasing the cost and delivery time of autonomous network hardware and software by disrupting semiconductor supplies, telecom equipment trade, data-centre energy, and global shipping routes. Average applied tariffs on non-agricultural products, including ICT equipment and electronic components, generally range from 3% to 6% across major economies.
However, targeted trade measures on high-technology products have raised effective duties on certain semiconductor-related goods to more than 10%. This directly increases the cost of routers, baseband units, processors, and specialised accelerators used in autonomous network systems.
Energy price volatility is also affecting operating expenses. Industrial electricity prices increased by approximately 20% to 30% between 2021 and 2022 in several OECD markets, while natural gas prices more than doubled during some periods.
Shipping disruptions have created further pressure on supply chains. Rerouting container vessels around the Cape of Good Hope due to Red Sea security concerns can add 10 to 15 days to transit times between Asia and Europe. It can also increase fuel costs per voyage by around 40%. As a result, telecom operators face longer lead times for base stations, switches, edge servers, and replacement parts.
The combined impact of 5% to 10% tariff surcharges, double-digit energy inflation, and 2-week logistics delays is reducing vendor margins. This environment is encouraging operators to adopt software-led autonomous systems that improve energy efficiency, network capacity, and asset utilisation.
Regional Analysis
North America held a dominant position in the autonomous networks market, accounting for 38.7% of global revenue and approximately USD 3.7 billion in 2025. The region’s leadership is supported by early adoption of standalone 5G networks, widespread cloud and data-centre infrastructure, and strong investment in AI-based network automation.
Asia Pacific is expected to be the fastest-growing regional market, supported by increasing mobile broadband use, rapid urbanisation, and large-scale 5G and fibre deployments across China, South Korea, Japan, and India. Expanding subscriber bases and rising data use are creating network traffic levels that are difficult to manage manually.
The growth of private 5G, industrial IoT, and smart-city projects is increasing demand for self-optimising networks, automated network slicing, and AI-based security systems. Although Asia Pacific currently holds a smaller share than North America’s 38.7%, its double-digit growth rate is expected to reduce the regional gap over the next decade.
Key Regions and Countries
- North America
- US
- Canada
- Europe
- Germany
- France
- The UK
- Spain
- Italy
- Rest of Europe
- Asia Pacific
- China
- Japan
- South Korea
- India
- Australia
- Rest of APAC
- Latin America
- Brazil
- Mexico
- Rest of Latin America
- Middle East & Africa
- GCC
- South Africa
- Rest of MEA
Market Dynamics
Drivers
| Driver | (~) % CAGR | Geographic Relevance | Impact Timeline |
|---|---|---|---|
| 5G Standalone Core Rollouts | +4.2% | Global, led by North America and Asia Pacific | Short term (2 years or less) |
| TM Forum Autonomous Networks Manifesto Adoption | +3.5% | Global, strongest in Europe and Asia Pacific | Short term (2 years or less) |
| Cloud-Native OSS/BSS Migration | +3.0% | North America, Europe | Medium term (2 to 4 years) |
| Generative AI Copilot Integration in NOC Operations | +2.8% | Global | Short term (2 years or less) |
| Rising IoT Endpoint Density | +2.4% | Asia Pacific, North America | Medium term (2 to 4 years) |
| Operator OPEX Reduction Mandates | +2.1% | Global | Short term (2 years or less) |
5G Standalone Core Rollouts
The main driver is the rapid shift from non-standalone to standalone 5G core networks. 3GPP release milestones tracked during 2024 and 2025 require operators to use cloud-native and containerised network functions, which are difficult to manage through traditional manual network operations centres.
TM Forum’s Autonomous Networks benchmark survey of 141 communication service providers found that 23% were following a roadmap to achieve Autonomous Network Level 4 by 2026, showing a clear move towards closed-loop automation.
This transition is also changing operator spending priorities from incremental hardware upgrades to automation software. Operator disclosures from 2024 and 2025 indicate that automated network domains reduced fault-resolution times by around 30% to 40%, helping lower operating costs per subscriber.
Restraints
| Restraint | (~) % CAGR | Geographic Relevance | Impact Timeline |
|---|---|---|---|
| High Interest Rate Environment Limiting Network CapEx | -2.6% | Global, acute in emerging markets | Short term (2 years or less) |
| Legacy OSS/BSS Lock-In Contracts | -1.8% | Europe, North America | Short term (2 years or less) |
| Data Sovereignty and Cross-Border AI Restrictions | -1.5% | European Union, China | Short term (2 years or less) |
| Multi-Vendor Interoperability Certification Delays | -1.2% | Global | Medium term (2 to 4 years) |
| Telecom Operator Margin Compression | -1.0% | Global | Short term (2 years or less) |
High Interest Rate Environment Limiting Network CapEx
The main challenge comes from high borrowing costs that remained elevated throughout 2024 and 2025. Central banks kept policy rates near multi-decade highs before beginning gradual reductions, increasing the discount rates used by telecom operators to evaluate multi-year automation investments.
Debt-servicing costs for infrastructure-heavy operators increased by an estimated 150 to 250 basis points compared with pre-2022 levels. This encouraged companies to prioritise maintenance expenditure over new autonomous network platform licences. As a result, vendors faced delayed contract approvals, longer sales cycles of around 6 to 12 months, and short-term pressure on profit margins where earlier forecasts had assumed faster enterprise-wide deployment.
Challenges
| Challenge | (~) % CAGR | Geographic Relevance | Mitigation Horizon |
|---|---|---|---|
| AI and Network Automation Talent Shortage | -1.9% | Global, acute in North America and Europe | Long-term (4 years or more) |
| Cross-Domain Data Silos | -1.4% | Global | Medium term (2 to 4 years) |
| Semiconductor and Component Lead-Time Volatility | -1.1% | Asia Pacific, North America | Medium term (2 to 4 years) |
| Explainability Gaps in AI Decision Loops | -0.9% | Global | Long term (4 years or more) |
| Legacy Workforce Reskilling Backlog | -0.7% | Global | Long term (4 years or more) |
AI and Network Automation Talent Shortage
The structural challenge is caused by a continuing gap between demand for network AI engineers and the availability of skilled workers. Industry workforce surveys conducted during 2024 and 2025 indicate a global shortage of tens of thousands of specialists in closed-loop automation and intent modelling.
TM Forum collaboration reports also show that only a portion of the more than 77 organisations that signed its Autonomous Networks Manifesto have developed enough internal expertise to move beyond Level 3 autonomy. National labour statistics indicate that the average time required to fill senior network AI positions increased by approximately 20% to 30% year over year.
This can extend project implementation schedules by several months and force operators to spend more on employee training. Reskilling existing network operations teams may account for around 5% to 8% of total automation project costs, reducing the amount available for new technology procurement. This skills shortage is therefore slowing the practical adoption of Level 4 autonomous networks, although it is not stopping ongoing deployments.
Opportunities
| Opportunity | (~) % CAGR | Geographic Relevance | Execution Window |
|---|---|---|---|
| Level 4 Autonomy Monetization in Enterprise Private Networks | +2.9% | North America, Asia Pacific | Medium term (2 to 4 years) |
| Cross-Border Multi-Operator Automation Marketplaces | +2.2% | Europe, Middle East | Long term (4 years or more) |
| AI-Driven Energy Optimization Monetization | +1.8% | Global | Medium term (2 to 4 years) |
| Emerging Market Greenfield Autonomous Deployments | +1.5% | Africa, Latin America, Southeast Asia | Long term (4 years or more) |
| Autonomous Network-as-a-Service Licensing Models | +1.3% | Global | Medium term (2 to 4 years) |
Level 4 Autonomy Monetization in Enterprise Private Networks
This is classified as untapped white space rather than a current driver because, according to TM Forum’s regional progress survey, most communication service providers remain below Autonomous Network Level 4. Only a minority are targeting full closed-loop deployment by 2026, while most others expect to reach this stage by 2030.
National industrial policy filings supporting private 5G deployments in manufacturing and logistics zones show that operators testing Level 4 scenarios have achieved operational cost reductions of approximately 30% to 40% in fault management. If these capabilities are extended to enterprise private-network licensing, vendors could increase gross margins by an estimated 5 to 8 percentage points compared with current managed-service models.
Key Players Analysis
Tier-1 companies in the autonomous networks market include Cisco Systems, Huawei Technologies, Nokia, Ericsson, IBM, and Hewlett Packard Enterprise. Their leadership is supported by strong positions in IP networking, mobile infrastructure, cloud computing, and AI-based operations. Cisco recently generated around USD 56–58 billion in total revenue, while its Secure, Agile Networks, and Internet for the Future businesses contributed more than USD 30 billion.
Huawei reported CNY 880.9 billion, or approximately USD 120 billion, in 2025 revenue. The company continues to invest in 5G cores, cloud-native network functions, and autonomous driving network solutions. Its research and development spending has generally exceeded 20% of annual revenue, representing more than CNY 170 billion over recent years.
Nokia and Ericsson operate multi-billion-euro mobile network businesses and are estimated to hold a combined 20–25% share of automation solutions linked to mobile infrastructure. IBM and HPE generate annual revenues of around USD 30–60 billion and provide hybrid-cloud, AI, and edge-network automation platforms.
Tier-2 companies include Juniper Networks, Arista Networks, Ciena, NEC, Fujitsu, and Extreme Networks. Juniper generated approximately USD 5.4 billion in trailing-12-month revenue, including quarterly product revenue of USD 755 million and service revenue of USD 525 million. Arista operates a multi-billion-dollar cloud-networking business, while Ciena generates more than USD 1 billion from optical and packet-networking activities.
Top Key Players in the Market
- Cisco Systems, Inc.
- Juniper Networks, Inc.
- Huawei Technologies Co., Ltd.
- Nokia Corporation
- Ericsson AB
- Ciena Corporation
- NEC Corporation
- Extreme Networks, Inc.
- Hewlett Packard Enterprise Development LP
- Arista Networks, Inc.
- Fujitsu Limited
- IBM Corporation
Recent Developments
- In March 2026, Ericsson and Nokia announced a collaboration to improve compatibility between their network automation platforms. Ericsson joined Nokia’s SMO Marketplace, while Nokia became a member of Ericsson’s rApp Ecosystem. The collaboration supports open standards, multivendor networks, Cloud RAN, Open RAN, and the industry’s transition towards Level 4 autonomous network operations.
- In June 2025, Huawei and China Mobile received the TM Forum Excellence Award for their end-to-end autonomous Network Operations Centre solution. It improved maintenance efficiency by 30% and reduced average mean time to repair by 30%, while supporting services used by tens of millions of customers.
- In March 2025, ZTE released its Autonomous Networks White Paper 2025 and introduced an upgraded AIR Net solution at MWC Barcelona. AIR Net uses 3 major engines covering data, large AI models, and digital twins. The RMB 280 billion metaverse figure was not confirmed in ZTE’s official announcement.
Report Scope
| Report Features | Description |
|---|---|
| Market Value (2025) | USD 9.8 Billion |
| Forecast Revenue (2035) | USD 74.2 Billion |
| CAGR (2026-2035) | 22.5% |
| Base Year for Estimation | 2025 |
| Historic Period | 2020-2024 |
| Forecast Period | 2026-2035 |
| Report Coverage | Revenue Forecast, Market Dynamics, Competitive Landscape, Recent Developments |
| Segments Covered | By Offering (Solution, Services), By End-User (IT and telecommunications, Healthcare, Retail, Banking and finance, Others) |
| Regional Analysis | North America – US, Canada; Europe – Germany, France, The UK, Spain, Italy, Rest of Europe; Asia Pacific – China, Japan, South Korea, India, Australia, Singapore, Rest of APAC; Latin America – Brazil, Mexico, Rest of Latin America; Middle East & Africa – GCC, South Africa, Rest of MEA |
| Competitive Landscape | Cisco Systems, Inc.; Juniper Networks, Inc.; Huawei Technologies Co., Ltd.; Nokia Corporation; Ericsson AB; Ciena Corporation; NEC Corporation; Extreme Networks, Inc.; Hewlett Packard Enterprise Development LP; Arista Networks, Inc.; Fujitsu Limited; IBM Corporation |
| Customization Scope | Customization for segments, region/country-level will be provided. Moreover, additional customization can be done based on the requirements. |
| Purchase Options | We have three licenses to opt for: Single User License, Multi-User License (Up to 5 Users), Corporate Use License (Unlimited Users and Printable PDF) |





























