


Report Overview
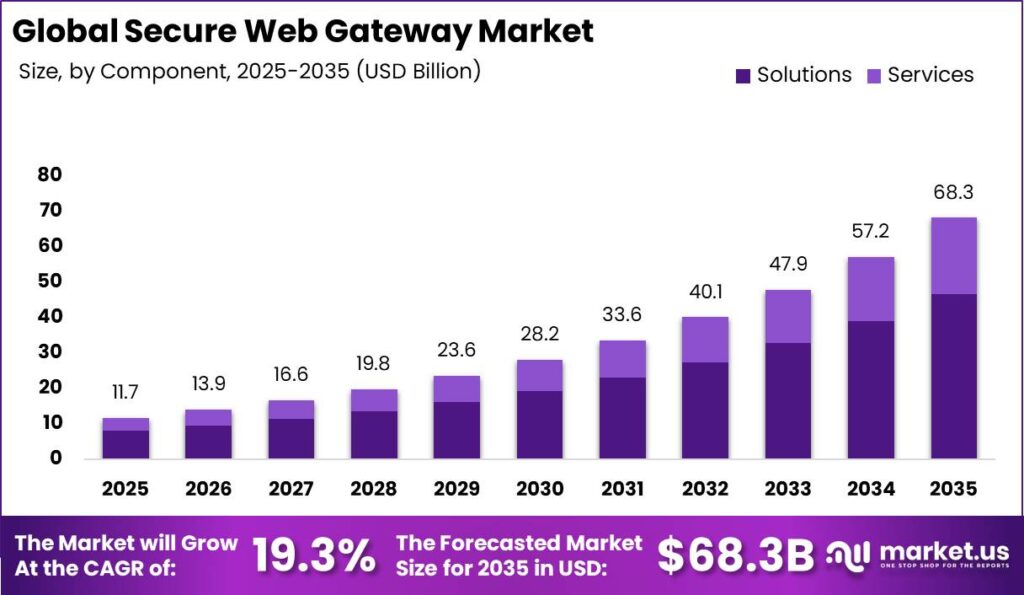
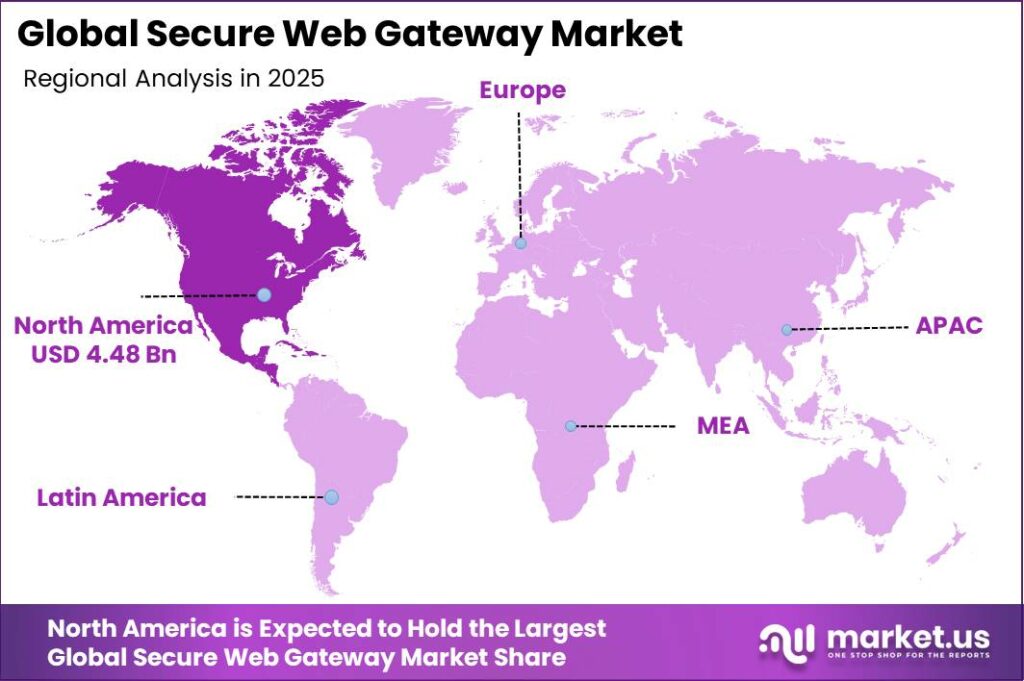
In 2025, the Global Secure Web Gateway Market was valued at USD 11.7 billion. The market is projected to grow at a CAGR of 19.3% during 2026–2035, reaching approximately USD 68.3 billion by 2035. North America dominated the global market in 2025, accounting for more than 38.34% of the total market share.
The rapid growth of the Secure Web Gateway (SWG) market is driven by the increasing use of the internet and the rising number of cyber threats. According to the International Telecommunication Union (ITU) Facts and Figures 2025, global internet users reached 6 billion in 2025, an increase of over 240 million in one year. As a result, nearly 75% of the world’s population now generates web traffic that requires secure filtering, monitoring, and threat inspection.
The ENISA Threat Landscape 2025, which analyzed 4,875 cybersecurity incidents between July 2024 and June 2025, found that phishing accounted for around 60% of initial intrusion cases, while web-based threats represented 27.3% of all observed threat categories. The WEF Global Cybersecurity Outlook 2026 reported that 87% of organizations identified AI-related vulnerabilities as the fastest-growing cyber risk.
The report also found that 77% of organizations had adopted AI-enabled security tools, with phishing detection (52%) and intrusion detection (46%) being the leading use cases. These trends are increasing the need for Secure Web Gateways, which inspect and protect web traffic in real time, supporting continued market growth.
North America accounted for the largest share of the Secure Web Gateway (SWG) market. The region’s leadership is driven by high enterprise cloud adoption, strong cybersecurity investments, and widespread Zero Trust implementation. According to the World Bank’s Digital Progress and Trends Report 2025, U.S. exports of cloud computing and data storage services increased by 23% annually, creating a growing volume of encrypted web traffic that requires Secure Web Gateway inspection and protection.
The U.S. Office of Management and Budget (OMB) reported that federal civilian IT spending reached USD 75.1 billion in FY2025, including approximately USD 12.5 billion allocated to cybersecurity, with all federal agencies required to implement Zero Trust Architecture. The Cisco Cybersecurity Readiness Index 2025, based on a survey of 8,000 business leaders across 30 countries, found that only 4% of organizations had achieved a “Mature” level of cybersecurity readiness.
Key Takeaways
- In 2025, the global Secure Web Gateway market was valued at USD 11.7 billion and is expected to witness strong long-term growth over the forecast period.
- The market is projected to expand at a CAGR of 19.3% during 2026–2035, reaching approximately USD 68.3 billion by 2035.
- By component, the Solutions segment led the market with a 68.45% share in 2025.
- By deployment, the On-premises segment accounted for the largest market share of 64.78% in 2025.
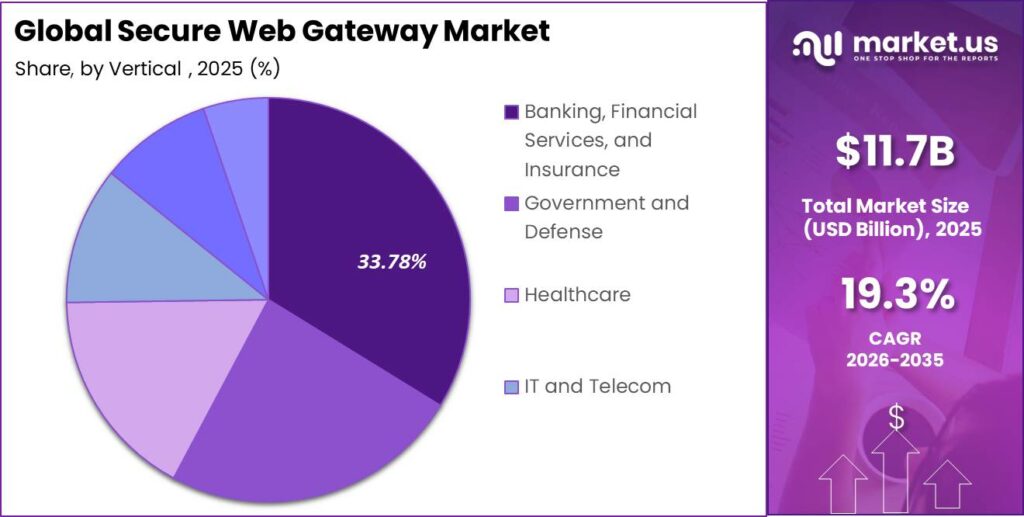
- By vertical, the Banking, Financial Services, and Insurance (BFSI) segment held the leading position with a 33.78% market share in 2025.
- North America dominated the global market in 2025, accounting for more than 38.34% of the total market share.
By Component
The Solutions segment held the largest share of the Secure Web Gateway market, accounting for 68.45% in 2025. Its leadership is driven by the need for organizations to deploy core security technologies such as URL filtering, SSL/TLS inspection, malware sandboxing, and data loss prevention (DLP) before managed services can be implemented. The scale of modern cyber threats further supports this demand.
According to CISA’s 2025 Year in Review, the agency blocked 2.62 billion malicious connections across U.S. federal civilian networks and 371 million across critical infrastructure during 2025. Such threat volumes require continuous, automated gateway protection, making SWG solutions the foundation of enterprise web security.
The Services segment is projected to register the fastest CAGR during the forecast period. Growth is supported by the shortage of skilled cybersecurity professionals and the increasing cost of cyberattacks. According to the ISC2 2025 Cybersecurity Workforce Study, 59% of organizations reported critical or significant cybersecurity skills shortages, up from 44% in 2024.
The biggest capability gaps were in AI security (41%) and cloud security (36%). In addition, the research Reports estimated the global average data breach cost at USD 4.44 million, while the U.S. average reached USD 10.22 million per incident. These factors are encouraging many organizations, particularly SMEs, to rely on managed SWG service providers for deployment, monitoring, and ongoing security management.
By Deployment
The On-Premises segment accounted for 64.78% of the Secure Web Gateway market in 2025, maintaining its leading position due to the continued reliance of large enterprises on in-house IT infrastructure. Industries such as banking, healthcare, defense, and critical infrastructure prefer on-premises deployments to meet strict data security, privacy, and regulatory compliance requirements.
According to the International Energy Agency (IEA), global data centers consumed approximately 415 TWh of electricity in 2024, growing by around 12% annually over the past five years. In addition, the United States and China are expected to contribute nearly 80% of global data center growth through 2030, further supporting demand for locally deployed gateway infrastructure.
According to Gallup (February 2026), 52% of remote-capable employees globally work in hybrid arrangements. Additionally, 80% of public-sector cloud decision-makers reported using hybrid cloud environments in 2025, while 34% identified security as a key reason for cloud adoption.
By Vertical
The Banking, Financial Services, and Insurance (BFSI) segment dominated the Secure Web Gateway market in 2025, accounting for 33.78% of the total market share. The segment’s leadership is driven by the large volume of sensitive online transactions, including digital banking, payment systems, insurance platforms, and financial trading services, which require continuous web traffic monitoring and protection.
According to the International Monetary Fund (IMF), nearly 20% of reported cyber incidents over the past two decades have targeted the global financial sector, resulting in approximately USD 12 billion in direct losses, including USD 2.5 billion since 2020. The IMF also highlighted in 2026 that AI-powered cyberattacks have become a major financial risk, encouraging stronger cybersecurity measures.
The Healthcare segment is expected to register the fastest CAGR during the forecast period. According to the U.S. Department of Health and Human Services (HHS) Office for Civil Rights, 311 healthcare data breaches were reported during the first half of 2025, affecting 23.1 million individuals, with 59% of incidents linked to hacking and IT-related attacks.
By the end of 2025, healthcare data breaches had affected 57 million individuals, making it the worst year on record and exceeding the previous 2023 record by 3.49%. In addition, IBM (2025) estimated the average cost of a healthcare data breach at USD 7.42 million per incident.
Key Market Segments
By Component
- Solutions
- Threat Protection
- Access Control
- Data Protection
- Services
- Professional Services
- Managed Services
By Deployment
- Cloud
- On-premises
By Vertical
- Banking, Financial Services, and Insurance
- Government and Defense
- Healthcare
- IT and Telecom
- Education
- Others
Market Dynamics
Drivers
| Driver | (~) % CAGR | Geographic Relevance | Impact Timeline |
|---|---|---|---|
| Zero Trust-aligned SWG adoption | +3.0% | North America, Europe, Asia-Pacific | Short term (≤ 2 years) |
| Secure hybrid work traffic growth | +2.3% | Global urban enterprises | Short term (≤ 2 years) |
| Cloud-delivered SWG and security edge convergence | +2.0% | Global, strongest in developed markets | Medium term (2–4 years) |
| Intensifying web-borne threat volume | +1.8% | Global | Short term (≤ 2 years) |
| Regulatory pressure on web access controls | +1.5% | Europe, North America, selected Asia-Pacific | Medium term (2–4 years) |
| SME security stack modernization | +1.2% | Global small and midsize enterprises | Long term (≥ 4 years) |
Zero Trust-aligned SWG adoption
Zero Trust programs launched since 2022 have accelerated the redesign of network security architectures, making policy-centric, identity-aware secure web gateways a default control instead of perimeter firewalls alone in enterprises with more than 1,000 employees, as reflected in recent Zero Trust security adoption studies and industry guidance.
As organizations migrate traffic from branch appliances into cloud SWG nodes, they typically convert capital-heavy hardware refresh cycles of around 4–5 years into recurring service contracts with per-user pricing bands that drive strong double-digit annual increases in web security spend, supporting an incremental SWG market uplift of roughly +3.0% on top of the baseline CAGR of 19.30% while remaining consistent with observed broader Zero Trust security growth.
This shift changes vendor business models toward multi-year subscriptions with attach rates for advanced threat protection and data protection often exceeding 40% of the installed base, improves gross margins by several percentage points due to reduced logistics and on-site deployment cost per node, and raises customer lifetime value by extending average contract terms from about 2 years to nearly 3–4 years in large accounts.
Restraints
| Restraint | (~) % CAGR | Geographic Relevance | Impact Timeline |
|---|---|---|---|
| Cybersecurity skills and operations shortage | -2.7% | Global, acute in emerging markets | Medium term (2–4 years) |
| Budget stickiness under elevated financing costs | -2.1% | North America, Europe | Short term (≤ 2 years) |
| Legacy web security platform lock-in | -1.8% | Global installed base | Short term (≤ 2 years) |
| Data residency and sovereignty constraints | -1.5% | Europe, Middle East, Asia-Pacific | Medium term (2–4 years) |
| Complex multi-vendor integration risk | -1.3% | Global large enterprises | Medium term (2–4 years) |
| Procurement delays in highly regulated sectors | -1.0% | Public sector and critical industries | Long term (≥ 4 years) |
Cybersecurity skills and operations shortage
The global cybersecurity talent gap, with workforce studies indicating about 5.5 million professionals against a shortfall of roughly 4.8 million roles by 2024, creates an immediate operational constraint on secure web gateway deployment capacity in both service providers and enterprises.
Many organizations report months-long delays in rolling out new web security controls because existing security operations centers already process tens of thousands of alerts per day and lack at least around 10%–20% of the analysts and engineers required to operationalize additional SWG policies and integrations, effectively shaving close to 2.7% from the realizable CAGR versus the theoretical demand curve.
This bottleneck compresses vendor margins as they invest in managed services, automation platforms, and training that can increase per-customer onboarding costs by low double-digit percentages, while also pushing some buyers to defer SWG upgrades and associated spending commitments by roughly 12–18 months, thereby dampening near-term revenue recognition.
Challenges
| Challenge | (~) % CAGR | Geographic Relevance | Mitigation Horizon |
|---|---|---|---|
| Performance-sensitive cloud security routing | -2.4% | Global, bandwidth-intensive sectors | Medium term (2–4 years) |
| Fragmented SWG and edge policy management | -2.0% | Global enterprises | Medium term (2–4 years) |
| Encrypted traffic inspection scalability | -1.9% | Global | Long term (≥ 4 years) |
| Continuous threat intelligence refresh | -1.6% | Global SWG providers | Short term (≤ 2 years) |
| Client device diversity and posture gaps | -1.4% | Global, especially flexible-workplace firms | Medium term (2–4 years) |
| Complex reporting and compliance mapping | -1.2% | Regulated industries worldwide | Long term (≥ 4 years) |
Performance-sensitive cloud security routing
Routing all web traffic through cloud-based secure web gateways introduces latency and jitter that can reduce application performance by several tens of milliseconds per transaction for high-bandwidth workloads, which at large scale translates into user productivity losses and customer experience degradation that enterprises must actively manage.
To mitigate this, organizations deploy more points of presence, optimize peering, and invest in local breakouts, raising network and security infrastructure costs per user by mid-single-digit percentages and creating a friction drag estimated around -2.4% on the maximum attainable CAGR because some latency-sensitive workloads remain partially or temporarily excluded from full SWG enforcement.
Over the next 2–4 years, providers and customers adjust architectures toward more distributed SWG nodes, selective traffic steering, and application-aware policies, which require ongoing capital and operating expenditure rebalancing and multi-year contracts with connectivity partners to secure bandwidth and peering improvements, thereby constraining how fast SWG penetration can approach its theoretical ceiling.
Opportunities
| Opportunity | (~) % CAGR | Geographic Relevance | Execution Window |
|---|---|---|---|
| SWG-driven data protection and DLP monetization | +2.8% | Global regulated industries | Medium term (2–4 years) |
| AI-powered web threat analytics services | +2.3% | Global enterprises | Short term (≤ 2 years) |
| Emerging market cloud SWG rollouts | +2.0% | Asia-Pacific, Latin America, Middle East and Africa | Long term (≥ 4 years) |
| Verticalized SWG offerings for critical sectors | +1.7% | Financial services, healthcare, public sector | Medium term (2–4 years) |
| Managed SWG and Zero Trust service bundles | +1.5% | Global mid-market and upper-SME segment | Short term (≤ 2 years) |
| API-first SWG integration ecosystems | +1.3% | Global software and service providers | Long term (≥ 4 years) |
SWG-driven data protection and DLP monetization
This opportunity is future-oriented because most current secure web gateway deployments focus on URL filtering and malware defense, while deeper web-native data loss prevention, content classification, and policy-based data controls across regulated industries remain underpenetrated and typically activated only for a minority of traffic flows today.
As data protection regulations tighten, enterprises subject to financial, health, or critical infrastructure oversight can justify premium SWG modules that raise per-user or per-GB pricing by double-digit percentages, potentially driving an incremental upside of about +2.8% above the baseline CAGR of 19.30% without requiring a proportional increase in infrastructure cost because data inspection features mainly leverage existing SWG points of presence and cloud architectures.
For providers, attaching advanced data protection to at least roughly 30%–40% of their SWG customer base over the next 2–4 years could expand gross margins by several percentage points and improve unit economics via higher average revenue per user, while customers gain lower expected loss from data breaches per incident and reduced compliance audit remediation effort measured in hundreds of staff hours annually per large organization.
Geopolitical Impact Analysis
The Secure Web Gateway market is being influenced by rising trade tensions, higher hardware costs, and changes in global supply chains. Secure Web Gateway appliances depend on semiconductors, network processors, ASICs, and x86 server hardware, all of which have become more expensive due to recent trade policies. According to the Yale Budget Lab, the average effective U.S. tariff rate increased to 21.9% in 2025, the highest level since 1909, while tariffs on Chinese legacy semiconductor imports reached 50%.
These higher import costs are increasing manufacturing expenses for Secure Web Gateway vendors, forcing many companies to either reduce profit margins or pass the additional costs on to enterprise customers. At the same time, the World Trade Organization (WTO) projected global merchandise trade to decline by 0.2% in 2025, with a potential decline of 1.5% under a higher tariff scenario.
The cloud-based Secure Web Gateway market is also being affected by rising energy demand and increasing investments in AI infrastructure. According to the International Energy Agency (IEA), data center electricity consumption increased by 17% in 2025, more than five times the global electricity demand growth rate of 3%. Technology companies invested more than USD 400 billion in AI infrastructure during 2025, with investments expected to increase by another 75% in 2026.
UNCTAD reported that global digital services trade grew by 9% in 2024, supporting continued demand for cloud-based Secure Web Gateway services. However, stricter internet regulations and national firewall policies in countries such as China, Russia, and parts of Southeast Asia, along with uncertainty surrounding WTO rules on digital trade, continue to create challenges for cross-border cloud security services and multinational enterprise deployments.
Regional Analysis
North America dominated the Secure Web Gateway market in 2025, accounting for 38.34% of the global market share. The region’s leadership is supported by high enterprise IT spending, strong cybersecurity investments, and strict regulatory requirements. The U.S. White House proposed USD 75 billion in civilian federal IT spending for FY2025, while the U.S. Department of Defense allocated USD 14.5 billion for cybersecurity initiatives, including Zero Trust Architecture, network modernization, and advanced threat detection.
These investments continue to drive the adoption of Secure Web Gateway solutions across both government and private organizations. In addition, GSMA reported that mobile technologies contributed USD 7.6 trillion to the global economy in 2025, representing 6.4% of global GDP, with North America generating the highest value per mobile connection.
Asia-Pacific is projected to register the fastest CAGR in the Secure Web Gateway market during the forecast period. This growth is driven by the region’s expanding internet user base, rapid digital transformation, and large-scale investments in 5G infrastructure. According to the ITU Facts and Figures 2025, internet penetration in Asia-Pacific reached 77% in 2025, while internet users in low- and middle-income economies increased by 7.4% annually, compared with the global average of 3.3%.
This steady rise in connected users, devices, and enterprise endpoints is increasing the need for secure web traffic inspection. In addition, the GSMA Mobile Economy Asia Pacific 2025 reported that mobile operators invested USD 220 billion in 5G networks between 2019 and 2025, with a further USD 254 billion planned through 2030.
According to the Australian Government’s Southeast Asia Economic Strategy 2040, Southeast Asia’s digital economy reached USD 330 billion in 2025, growing at nearly twice the pace of the region’s overall GDP, further strengthening demand for advanced web security solutions across enterprises.
Key Regions and Countries
- North America
- The US
- Canada
- Europe
- Germany
- France
- The UK
- Spain
- Italy
- Russia & CIS
- Rest of Europe
- APAC
- China
- Japan
- South Korea
- India
- ASEAN
- Rest of APAC
- Latin America
- Brazil
- Mexico
- Rest of Latin America
- Middle East & Africa
- GCC
- South Africa
- Rest of MEA
Key Players Analysis
The Secure Web Gateway market is highly competitive and is led by a few global cybersecurity companies that provide Secure Web Gateway (SWG), Secure Service Edge (SSE), and Zero Trust solutions as part of broader security platforms. Zscaler remains the leading pure-play cloud SWG provider. The company reported USD 2.67 billion in revenue in FY2025, representing 23% year-over-year growth, while its Annual Recurring Revenue (ARR) reached USD 3.2 billion in Q1 FY2026.
Its Zero Trust Exchange processes more than 500 trillion security signals daily, and its ThreatLabz team analyzed 989.3 billion AI and machine learning transactions during 2025, strengthening its threat detection capabilities. Cisco continues to be one of the largest security vendors, reporting USD 56.7 billion in total revenue in FY2025, up 5% from the previous year.
Following its USD 28 billion acquisition of Splunk, Cisco’s security business grew by 59.5%, while its security pipeline reached USD 2.5 billion in early 2026. Check Point Software also strengthened its position, generating USD 2.73 billion in revenue in 2025, with security subscription revenue growing by 10%–11%. The company increased its research and development spending to USD 457 million, up 15.6% from 2024, supporting continued investment in its Infinity Platform and Harmony security portfolio.
Competition is also increasing among fast-growing cloud security providers. Trend Micro reported Annual Recurring Revenue (ARR) of more than USD 1.7 billion in FY2025, while enterprise ARR exceeded USD 1.3 billion. Revenue from its Trend Vision One platform grew by 94% during the first half of 2025, reflecting strong enterprise adoption. Netskope continued to expand rapidly, reaching USD 707 million ARR by mid-2025, a 33% increase from USD 531 million a year earlier.
The company also filed for a Nasdaq IPO in August 2025, targeting a valuation of up to USD 6.5 billion. At the same time, the market is becoming more consolidated as major vendors expand their integrated security platforms. Cisco’s integration of Splunk, Check Point’s unified Infinity Platform, and Zscaler’s expansion into data protection are encouraging enterprises to adopt complete cybersecurity platforms instead of standalone Secure Web Gateway products.
The Major Players in the Industry
- Trend Micro Incorporated
- Check Point Software Technologies
- Zscaler
- NortonLifeLock
- Sophos Group PLC
- McAfee LLC
- Cisco
- Content keeper
- Comodo group
- Netskope
- The Claro Company
- Check Point Software Technologies Ltd.
- Brivo, Inc.
- Other Key Players
Key Development
- In August 2025, Zscaler acquired Red Canary, a leading Managed Detection and Response (MDR) provider, for USD 675 million in cash, along with employee equity. The transaction, completed on August 1, 2025, expanded Zscaler’s security portfolio by integrating Red Canary’s threat detection and response capabilities into the Zero Trust Exchange platform.
- In September 2025, Cloud-based SWG and Security Service Edge (SSE) provider Netskope launched its initial public offering (IPO), pricing shares at USD 19 each. The company raised USD 908.2 million by offering approximately 47.8 million shares and began trading on Nasdaq under the ticker “NTSK” on September 18, 2025. The IPO valued the company at USD 7.26 billion. As of July 2025, Netskope reported USD 707 million in annual recurring revenue (ARR), reflecting 33% year-over-year growth, with 4,317 enterprise customers across 90 countries.
- In September 2025, Check Point Software announced a definitive agreement to acquire Lakera, a Swiss AI-native cybersecurity company specializing in agentic AI application protection, in a deal valued at approximately USD 300 million.
- In November 2025, Zscaler acquired SPLX, an AI security startup focused on automated red teaming, AI asset discovery, and governance for generative AI and agentic AI environments. The acquisition followed Zscaler’s USD 675 million Red Canary deal earlier in the year.
Report Scope
| Report Features | Description |
|---|---|
| Market Value (2025) | USD 11.7 Billion |
| Forecast Revenue (2035) | USD 68.3 Billion |
| CAGR (2026-2035) | 19.3% |
| Base Year for Estimation | 2025 |
| Historic Period | 2020-2024 |
| Forecast Period | 2026-2035 |
| Report Coverage | Revenue Forecast, Market Dynamics, Competitive Landscape, Recent Developments |
| Segments Covered | By Component [Solutions (Threat Protection, Access Control and Data Protection), Services (Professional Services and Managed Services), By Deployment (Cloud and On-premises), By Vertical [(Banking, Financial Services, and Insurance), Government and Defense, Healthcare, IT and Telecom, Education and Others] |
| Regional Analysis | North America – The US & Canada; Europe – Germany, France, The UK, Spain, Italy, Russia & CIS, Rest of Europe; APAC- China, Japan, South Korea, India, ASEAN & Rest of APAC; Latin America- Brazil, Mexico & Rest of Latin America; Middle East & Africa- GCC, South Africa, & Rest of MEA |
| Competitive Landscape | Trend Micro Incorporated, Checkpoint Software Technologies, Zscaler, NortonLifeLock, Sophos Group PLC, McAfee LLC, Cisco, Content Keeper, Comodo Group, Netskope, The Claro Company, Check Point Software Technologies Ltd., Brivo, Inc. and Other Key Players |
| Customization Scope | Customization for segments and region/country-level will be provided. Moreover, customization can be tailored to the requirements. |
| Purchase Options | We have three licenses to opt for: Single User License, Multi-User License (Up to 5 Users), Corporate Use License (Unlimited Users and Printable PDF) |





























