


Report Overview
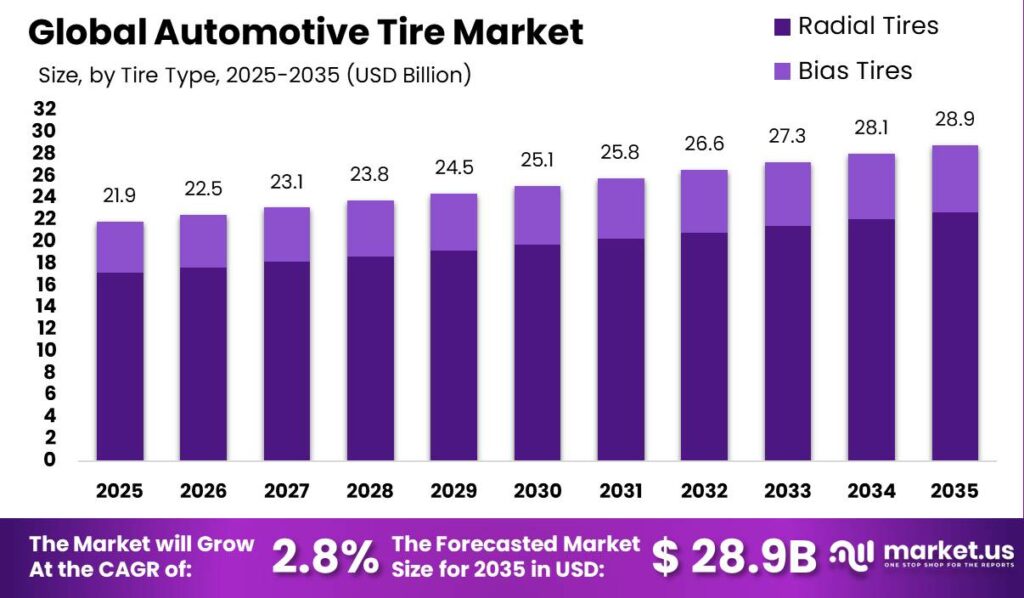
Global Automotive Tire Market size is expected to be worth around USD 28.9 Billion by 2035 from USD 21.9 Billion in 2025, growing at a CAGR of 2.8% during the forecast period 2026 to 2035. This steady climb reflects durable replacement demand rather than a demand spike. Investors should read the market as a resilient, volume-driven sector where scale and distribution reach matter more than short bursts of growth.
Therefore, buyers must understand how this market is built. The Automotive Tire Market groups products by tire construction, vehicle type, season, distribution channel, rim size, sales channel, technology, and propulsion type. Each layer serves a different buyer, from OEM assembly lines to individual car owners. This structure means a single manufacturer must serve many demand pools at once, which rewards broad product lines and penalizes narrow specialists.
Key Takeaways
- Automotive Tire Market size will reach USD 28.9 Billion by 2035, up from USD 21.9 Billion in 2025, at a CAGR of 2.8%.
- Radial Tires lead the By Tire Type segment with a 78.60% share.
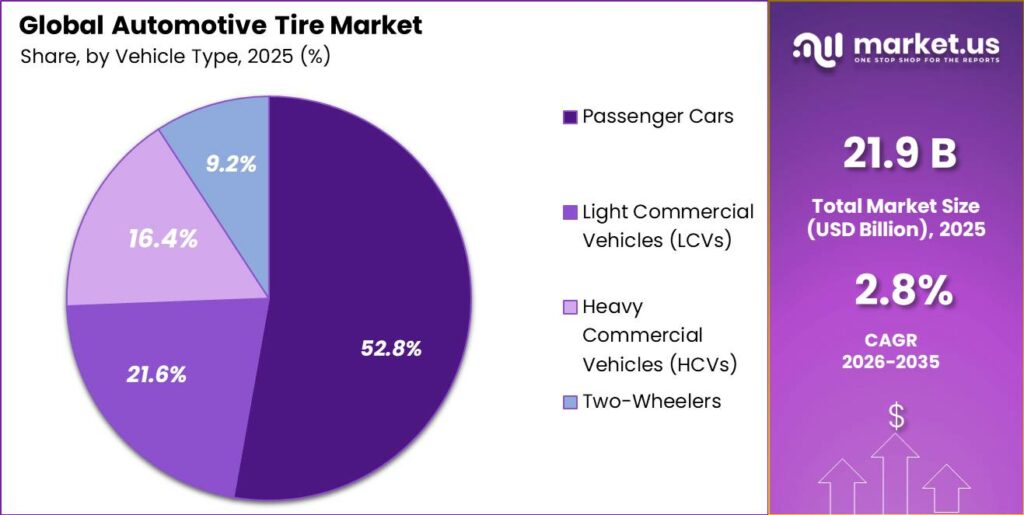
- Passenger Cars hold the By Vehicle Type segment with a 52.80% share.
- All-Season Tires lead the By Season Type segment with a 48.30% share.
- Replacement/Aftermarket leads the By Distribution Channel segment with a 67.20% share.
- 16 to 18 Inches leads the By Rim Size segment with a 36.70% share.
- Tire Dealers and Retailers lead the By Sales Channel segment with a 43.60% share.
- Conventional Tires lead the By Technology segment with a 63.80% share.
- Internal Combustion Engine Vehicles lead the By Propulsion Type segment with a 76.40% share.
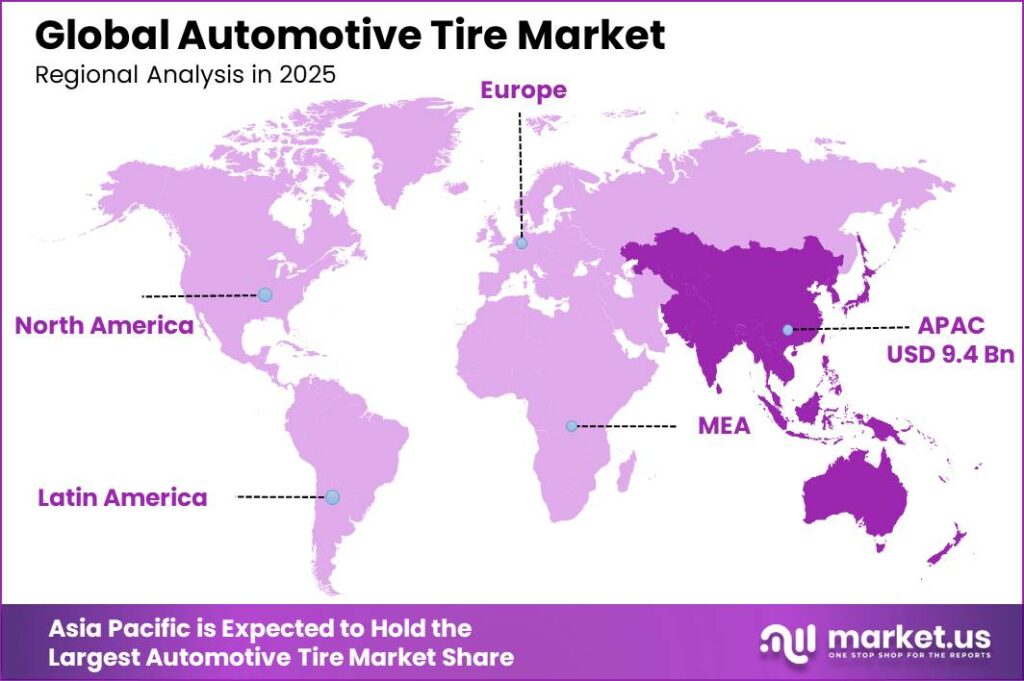
- Asia-Pacific dominates globally with a 42.70% share, valued at USD 9.4 Billion.
Governments now shape tire demand through safety and inspection rules that force earlier replacement. As per our research, tire tread wears at about 0.2/32 of an inch per 1,000 miles, so an average U.S. driver logging 10,000 miles loses roughly 2/32 of an inch yearly. This wear rate creates a predictable, recurring replacement cycle. Sellers who track fleet mileage can forecast reorder timing and lock in aftermarket revenue before competitors reach the customer.
Regulatory inspection gaps also expand the addressable market. As per our research, roughly 15% of passenger cars carry unsafe tires before their next inspection, signaling a large pool of overdue replacements. This means retailers gain a ready audience for safety-led upselling. Consequently, dealers who pair inspections with instant replacement offers convert compliance pressure into immediate sales and stronger customer retention.
Manufacturer output confirms the scale of this replacement engine. Data from Goodyear shows the company sold 158.7 million tires across full-year 2025, with 42.3 million units in the fourth quarter alone. High absolute volumes like these prove that unit throughput, not price, drives revenue here. As a result, producers that defend factory utilization and channel access protect margins better than those chasing premium niches.
Tire Type Analysis
Radial Tires dominate with 78.60% due to superior fuel efficiency and durability.
In 2025, Radial Tires held a dominant market position in the By Tire Type segment of Automotive Tire Market, with a 78.60% share. Global vehicle production reached 96.4 million units in 2025 according to OICA data, and nearly all new passenger and commercial vehicles now ship on radial construction. This near-total OEM standardization locks radial demand into every production cycle. Manufacturers that scale radial output capture the widest, most stable buyer base in the market.
Bias Tires serve niche roles in agricultural, off-road, and low-speed industrial vehicles where sidewall strength matters more than fuel economy. OICA figures show commercial and specialty vehicle output remains a meaningful slice of the 96.4 million global units built in 2025, sustaining bias demand in developing regions. This means bias tires hold the remaining 21.40% share as a defensive, application-specific product. Producers should treat bias lines as margin plays in underserved rural and industrial channels rather than growth engines.
Bridgestone reinforced radial capacity in emerging markets through direct plant investment. The company committed about US$85 million across 2024 to early 2025 to expand premium passenger car tire production at its Pune and Indore plants in India, adding a satellite technology center at Pune. This localizes radial supply near the fastest-growing vehicle base. As a result, regional producers cut freight exposure and shorten lead times against import-reliant rivals.
Vehicle Type Analysis
Passenger Cars dominate with 52.80% due to the largest global vehicle parc.
In 2025, Passenger Cars held a dominant market position in the By Vehicle Type segment of Automotive Tire Market, with a 52.80% share. OICA data shows passenger vehicles made up the majority of the 96.4 million units produced globally in 2025. This vast installed base drives both OEM fitment and repeat replacement demand. Manufacturers that anchor product portfolios to passenger fitments secure the deepest, most reliable revenue pool in the sector.
Light Commercial Vehicles carry delivery and last-mile logistics fleets that run high daily mileage and wear tires faster. National statistical offices report commercial vehicle registrations rising alongside e-commerce logistics volumes across major markets. This means LCVs hold a 21.60% share with above-average replacement frequency. Sellers targeting fleet contracts here gain recurring, predictable reorder volumes that individual buyers rarely match.
Heavy Commercial Vehicles operate long-haul freight and construction duty that demands high-load radial tires with retreadable casings. Trade association data links HCV tire demand directly to freight ton-kilometer growth in industrialized economies. This structural link gives HCVs a 16.40% share tied to macroeconomic freight activity. Producers offering casing durability and retread programs win total-cost-of-ownership arguments with fleet buyers.
Two-Wheelers rank as the fastest growing vehicle type, powered by urban mobility demand across South and Southeast Asia. India’s two-wheeler tire market alone is projected to reach 253.9 million units by 2032 per industry registration data. This growth leaves Two-Wheelers at a 9.20% share today with strong upward momentum. Early movers formalizing this fragmented segment capture volume before organized players consolidate it.
Season Type Analysis
All-Season Tires dominate with 48.30% due to year-round versatility and lower buyer cost.
In 2025, All-Season Tires held a dominant market position in the By Season Type segment of Automotive Tire Market, with a 48.30% share. UN Comtrade trade flows show all-season fitments dominate cross-border passenger tire shipments in temperate markets. This single-purchase convenience removes the need for seasonal swaps and storage. Retailers stocking all-season inventory reduce SKU complexity while meeting mainstream buyer needs at scale.
Summer Tires deliver dry and wet grip for warm climates and performance-oriented drivers. Customs databases record steady summer tire flows into southern European and Middle Eastern markets where winter fitments hold little value. This gives summer tires a stable, geography-linked demand base within the remaining share. Sellers should align summer inventory to regional climate zones rather than uniform national distribution.
Winter Tires serve cold-climate regions where regulation and safety drive mandatory seasonal fitment. Regulatory filings in Nordic and Alpine markets require winter-rated tires during defined months, creating fixed annual demand. This structural mandate protects winter tire volume regardless of price cycles. Producers holding certified winter lines capture compliance-driven reorders that competitors cannot substitute.
Performance Tires rank as the fastest growing season type, lifted by rising premium and electric vehicle adoption. Patent database filings show accelerating innovation in high-grip and low-noise performance compounds. Performance and remaining seasonal fitments together hold the residual share, with performance the clear momentum leader. Manufacturers investing in performance compounds position for the premium margins that mainstream tires cannot deliver.
Distribution Channel Analysis
Replacement/Aftermarket dominates with 67.20% due to recurring wear-driven repurchase cycles.
In 2025, Replacement/Aftermarket held a dominant market position in the By Distribution Channel segment of Automotive Tire Market, with a 67.20% share. The global vehicle parc built on OICA’s cumulative 96.4 million annual additions generates constant wear-based replacement demand. This installed base repurchases far more often than new vehicles roll off assembly lines. Producers prioritizing aftermarket distribution capture the market’s largest and most repeatable revenue stream.
OEM channels supply tires directly to vehicle assembly lines under long-term supplier contracts. OICA production data ties OEM tire volume directly to the 96.4 million units manufactured in 2025. This makes OEM demand stable but capped by new vehicle output within the remaining share. Suppliers use OEM fitment mainly to build brand familiarity that later converts into higher-margin aftermarket repurchases.
Rim Size Analysis
16 to 18 Inches dominates with 36.70% due to mainstream passenger car fitment standards.
In 2025, 16 to 18 Inches held a dominant market position in the By Rim Size segment of Automotive Tire Market, with a 36.70% share. This range matches the majority of passenger vehicles within OICA’s 96.4 million 2025 output. Its alignment with mainstream car design makes it the default high-volume rim class. Producers optimizing production around this range maximize compatibility across the broadest vehicle population.
The 13 to 15 Inches class serves compact and economy cars common in cost-sensitive emerging markets. Customs data shows continued strong flows of small-rim tires into South Asian and African markets. This sustains a value-focused demand base within the remaining share. Sellers treat this class as a volume entry point in price-driven regions.
The 19 to 21 Inches class ranks as the fastest growing rim size, driven by SUV and premium vehicle adoption. Patent filings reveal rising development of larger-diameter, low-profile tire designs. This class holds part of the residual share with clear upward momentum. Manufacturers scaling large-rim capacity capture the premium SUV wave ahead of rivals. Above 21 Inches serves ultra-premium and specialty vehicles, holding the smallest remaining share as a niche high-margin category.
Sales Channel Analysis
Tire Dealers and Retailers dominate with 43.60% due to trusted fitment and service networks.
In 2025, Tire Dealers and Retailers held a dominant market position in the By Sales Channel segment of Automotive Tire Market, with a 43.60% share. Trade association benchmarks confirm dealer networks handle the bulk of fitment-dependent tire sales. Buyers rely on dealers for installation, balancing, and warranty support. Producers with strong dealer relationships control the most influential path to end customers.
Independent Service Centers combine tire sales with broader vehicle maintenance for convenience-seeking buyers. Trade association surveys show multi-service garages capturing steady tire attachment revenue. This gives them a solid position within the remaining share. Sellers supplying these centers benefit from bundled-service demand that pure tire outlets cannot match.
OEM Dealerships sell branded replacement tires tied to specific vehicle makes during scheduled servicing. Regulatory filings show franchised dealers channeling warranty and fleet tire orders through official networks. This locks in a captive, brand-loyal share of replacement demand. Manufacturers use OEM dealership channels to defend premium positioning against discount rivals. Online Sales ranks as the fastest growing sales channel, as digital tire retail and mobile fitment models expand buyer reach beyond physical stores.
Technology Analysis
Conventional Tires dominate with 63.80% due to proven reliability and low unit cost.
In 2025, Conventional Tires held a dominant market position in the By Technology segment of Automotive Tire Market, with a 63.80% share. These mature designs equip most of the global parc built on OICA’s 96.4 million annual production. Their low cost and known performance keep them the default choice for mainstream buyers. Producers rely on conventional lines for the stable cash flow that funds newer technology bets.
Run-Flat Tires let vehicles keep moving after pressure loss, serving safety-focused premium fitments. Patent databases show sustained run-flat innovation among European premium OEM suppliers. This secures a defined position within the remaining share. Sellers position run-flats as safety upgrades that command higher margins in premium channels.
Smart Tires rank as the fastest growing technology, driven by embedded sensors and fleet telematics demand. Patent filing counts for connected tire systems are rising sharply across major manufacturers. This gives smart tires strong momentum despite a small current base. Early movers building sensor and data capabilities position for recurring service revenue. Airless Tires stand as an emerging segment, offering puncture-proof designs for future last-mile and autonomous fleets.
Propulsion Type Analysis
ICE Vehicles dominate with 76.40% due to the vast existing combustion vehicle parc.
In 2025, Internal Combustion Engine Vehicles held a dominant market position in the By Propulsion Type segment of Automotive Tire Market, with a 76.40% share. ICE vehicles still make up the large majority of OICA’s 96.4 million units produced in 2025. This entrenched base sustains overwhelming tire demand across both OEM and replacement channels. Producers cannot ignore ICE fitments even as electrification accelerates in specific regions.
Electric Vehicles rank as the fastest growing propulsion type, requiring specialized tires for higher torque and battery weight. National statistical offices report EV registration growth outpacing overall vehicle sales in China and Europe. This gives EVs the remaining share with the strongest forward trajectory. Manufacturers developing EV-specific low-noise, high-load tires capture premium fitment demand before the segment scales.
Key Market Segments
By Tire Type
- Radial Tires
- Bias Tires
By Vehicle Type
- Passenger Cars
- Light Commercial Vehicles (LCVs)
- Heavy Commercial Vehicles (HCVs)
- Two-Wheelers
By Season Type
- All-Season Tires
- Summer Tires
- Winter Tires
- Performance Tires
By Distribution Channel
- Replacement/Aftermarket
- OEM
By Rim Size
- 13 to 15 Inches
- 16 to 18 Inches
- 19 to 21 Inches
- Above 21 Inches
By Sales Channel
- Tire Dealers and Retailers
- Independent Service Centers
- OEM Dealerships
- Online Sales
By Technology
- Conventional Tires
- Run-Flat Tires
- Smart Tires
- Airless Tires
By Propulsion Type
- Internal Combustion Engine (ICE) Vehicles
- Electric Vehicles (EVs)
Regional Analysis
Asia-Pacific Dominates the Automotive Tire Market with a Market Share of 42.70%, Valued at USD 9.4 Billion
Asia-Pacific leads the Automotive Tire Market with a 42.70% share worth USD 9.4 Billion in 2025. As per our research, the region hosts the largest concentration of vehicle production and the fastest-expanding vehicle fleets. This scale gives regional producers cost advantages in both raw material access and distribution. Consequently, global manufacturers must build local capacity to compete on price and delivery speed in this pivotal region.
North America and Europe rank as the next-largest regions, anchored by aging fleets and strong replacement demand. As per our research, mature vehicle parcs in these regions drive high aftermarket repurchase rates rather than new-fitment growth. This shifts value toward premium and performance products. Pirelli reinforced its premium standing when its Cyber Tyre won V2X Innovation of the Year at the Autotech Breakthrough Awards 2025, securing 27 podium finishes across 34 comparative tests. As a result, technology leadership becomes the primary competitive lever in these developed markets.
Key Regions and Countries
North America
- US
- Canada
Europe
- Germany
- France
- The UK
- Spain
- Italy
- Rest of Europe
Asia Pacific
- China
- Japan
- South Korea
- India
- Australia
- Rest of APAC
Latin America
- Brazil
- Mexico
- Rest of Latin America
Middle East and Africa
- GCC
- South Africa
- Rest of MEA
Market Dynamics
Market Opportunity Analysis - Underexploited two-wheeler segments and retread channels open entry points for new players
The Two-Wheelers segment holds only a 9.20% share yet ranks as the fastest growing vehicle type across South and Southeast Asia. This gap exists because much of the region’s two-wheeler tire demand still flows through informal, unbranded channels. Therefore, organized players who formalize distribution and warranty support capture volume before consolidation. New entrants gain first-mover trust in a market where brand loyalty is still forming.
The Replacement/Aftermarket channel commands a 67.20% share, yet retread economics remain underused as a value play. As per our research, a retread tire typically costs 30% to 50% of a comparable new tire, since most cost sits in the casing. This means fleet operators seeking cost control represent a large untapped audience. Consequently, entrants building retread capacity capture margin in a channel dominated by new-tire sellers.
The Electric Vehicles propulsion segment holds the smallest share behind ICE’s 76.40%, yet it grows fastest. This imbalance exists because few manufacturers offer EV-specific tires tuned for torque and battery weight. Instead of chasing crowded ICE fitments, entrants can specialize in EV-optimized designs. As a result, early specialists lock in premium OEM relationships before larger rivals retool their lines.
Technology and Innovation Landscape - Rolling resistance gains, connected sensing, and material science redefine competitive edges
Continental cut rolling resistance across its passenger-car tire portfolio by an average of 15% over the past decade, as stated in December 2025. Lower rolling resistance directly improves vehicle fuel economy and EV range. This creates a measurable buying reason for cost-conscious fleets and range-anxious EV owners. Therefore, producers advancing rolling-resistance technology win specification battles against efficiency-focused OEMs.
Regulatory frameworks now push innovation through transparent performance grading. The EU tyre label, in force through 2025, rates fuel efficiency and wet grip on a 5-class scale from A to E, while external rolling noise spans 3 classes from A to C. This standardized scoring lets buyers compare products directly. As a result, manufacturers that engineer toward top label grades gain a visible marketing edge at the point of sale.
Environmental research is reshaping compound development priorities. A peer-reviewed study found abraded front-tire material ranging from 33 to 260 mg/g, giving a quantified basis for measuring tire wear particle emissions. This data intensifies pressure to develop low-abrasion compounds. Consequently, producers investing early in wear-reducing materials position ahead of tightening emissions rules and capture sustainability-driven demand.
Drivers
Global vehicle production rose to 96.4 million units in 2025, up 3.9% year-on-year, with Asia-Pacific accounting for 61% of output at 59.2 million vehicles, a 7.6% regional increase according to Market.us. India led this shift with passenger vehicle production of 6.49 million units and record sales above 4.6 million passenger vehicles. Every new vehicle creates an inelastic order of four to six tires. This means OEM fitment demand expands directly with each production surge.
India’s aftermarket cycle strengthens this driver further, since the average passenger car tire is replaced every 40,000 to 50,000 km. Therefore, each production wave feeds replacement demand within two to four years. This driver adds an estimated +1.2% to baseline CAGR, as the region’s tire demand share crossed 39%. Regionally integrated manufacturers gain lower per-unit logistics costs while import-reliant rivals absorb 15% to 25% higher freight baselines.
| Driver | (~) % Impact on CAGR Forecast | Geographic Relevance | Impact Timeline |
|---|---|---|---|
| Rising Vehicle Production & Fleet Expansion in Asia-Pacific | +1.2% | China, India, Southeast Asia, Middle East | Short term (≤ 2 years) |
| Replacement Tire Demand from Aging Global Vehicle Fleets | +0.7% | North America, Europe, Latin America | Short term (≤ 2 years) |
| EV-Specific Tire Adoption Driving Premium OEM Demand | +0.5% | China, Europe, North America | Medium term (2–4 years) |
| Mandatory Safety & Fuel-Efficiency Labeling Regulations | +0.3% | European Union, South Korea, Japan | Short term (≤ 2 years) |
| Expanding Commercial Vehicle & Logistics Fleet Utilization | +0.2% | India, China, Sub-Saharan Africa, GCC | Medium term (2–4 years) |
Restraints
Rubber input scarcity is the sharpest brake on tire market expansion today. Global natural rubber production in 2025 reached about 14.9 million tons against demand of 15.6 million tons, creating a structural deficit of 600,000 to 800,000 tons expected to persist through 2028. RSS4 benchmark prices hit an all-time high of 815 USD cents per kg in February 2025. Select synthetic grades rose 50% to 100%. This squeezes producer margins hard.
Since natural rubber makes up about 62% of tire-grade rubber use and tire making drives roughly 70% of carbon black demand, per-unit input baskets inflated sharply. This compressed mid-tier producer EBITDA margins by an estimated 300 to 500 basis points year-on-year. Manufacturers in price-sensitive markets like India cannot fully pass costs through. As a result, they defer CapEx on capacity, stalling new lines and capping revenue growth.
| Restraint | (~) % Impact on CAGR Forecast | Geographic Relevance | Impact Timeline |
|---|---|---|---|
| Natural & Synthetic Rubber Price Surge & Structural Supply Deficit | -1.1% | Global, concentrated in Asia-Pacific sourcing | Short term (≤ 2 years) |
| Protectionist Import Tariffs & Trade Policy Disruptions | -0.6% | United States, EU trade corridors, Mexico | Short term (≤ 2 years) |
| Extended Producer Responsibility Mandates Raising Compliance Costs | -0.4% | European Union | Medium term (2–4 years) |
| High Capital Intensity of EV-Grade & Performance Tire Manufacturing Retooling | -0.3% | North America, Europe | Medium term (2–4 years) |
| Carbon Black Supply Tightness from Energy & Regulatory Pressure | -0.2% | China, India, United States | Short term (≤ 2 years) |
Challenges
The tire supply chain runs on multi-leg, cross-continental logistics. Natural rubber from Thailand, Indonesia, and Vietnam, which supply over 70% of global output, must be refined, compounded, and shipped to distant consumption markets. Throughout 2024 to 2025, container freight rates spiked 200% to 300% on Asia-Europe lanes. This inflated delivered cost per unit by an estimated 8% to 14% and added 4 to 6 weeks of lead time.
This challenge operates as continuous friction rather than a hard stop. Manufacturers absorb spot-rate volatility into working capital, tying up an extra 12% to 18% of annual logistics budgets during peak disruption. Dealers face stockouts and margin erosion. Therefore, firms pivot toward nearshore sourcing and buffer inventory that consumes 5% to 8% more warehouse capacity. This raises the structural cost base but secures supply continuity.
| Challenge | (~) % CAGR Friction Drag | Geographic Relevance | Mitigation Horizon |
|---|---|---|---|
| Logistics & Freight Network Volatility | -0.5% | Global, acute in Asia-Europe corridors | Short term (≤ 2 years) |
| EV Tire R&D Talent & Tooling Gaps | -0.4% | North America, Europe, South Korea | Medium term (2–4 years) |
| Sustainability Compliance Complexity | -0.3% | European Union, Japan, California (US) | Medium term (2–4 years) |
| Fragmented Aftermarket Counterfeit Penetration | -0.3% | India, Southeast Asia, Middle East, Africa | Long term (≥ 4 years) |
| Geopolitical Supply Chain Concentration Risk | -0.2% | Global, particularly Thailand, Indonesia, Vietnam sourcing | Long term (≥ 4 years) |
Opportunities
Smart and connected tires remain structurally untapped because most sensor revenue is booked as a one-time hardware sale. This model misses the recurring value of pressure, temperature, and tread-wear data generated across a tire’s 40,000 to 60,000 km life. The connected tire market expands at roughly 58.5% CAGR, yet smart tire penetration in India’s commercial fleet stays under 2% against more than 30 million registered commercial vehicles. This gap signals vast unrealized value.
The white space lies in shifting from hardware margin of 15% to 22% to a platform margin model. Fleet operators, insurers, and telematics providers will pay per-vehicle monthly fees for predictive maintenance and blowout risk scoring. This shift can expand per-tire revenue by an estimated 30% to 45% over asset life. As a result, early movers pairing TPMS mandates with a data services layer convert compliance costs into recurring revenue.
| Opportunity | (~) % Potential CAGR Upside | Geographic Relevance | Execution Window |
|---|---|---|---|
| Smart & Connected Tire Monetization via Subscription Data Models | +1.0% | North America, Europe, China | Medium term (2–4 years) |
| Circular Economy: Retreading & Recycled-Content Tire Scale-Up | +0.6% | European Union, United States, India | Medium term (2–4 years) |
| Underpenetrated Two & Three-Wheeler Tire Formalization in South & Southeast Asia | +0.5% | India, Indonesia, Vietnam, Bangladesh | Short term (≤ 2 years) |
| Africa & GCC Fleet Expansion as Greenfield Aftermarket White Space | +0.4% | Sub-Saharan Africa, Saudi Arabia, UAE | Long term (≥ 4 years) |
| Bio-Based & Sustainable Feedstock Tire Premium Segment Development | +0.3% | European Union, Japan, North America | Long term (≥ 4 years) |
Key Company Insights
Michelin anchors its strategy on sustainability leadership, reporting 32% renewable and recycled materials, 68% renewable electricity, and an 11% cut in Scope 1 and 2 emissions in 2025. In January 2026 it agreed to acquire Cooley Group and Tex Tech Industries to expand beyond tires. However, 2025 sales volumes fell 4.7%, with over 80% of the decline in specific segments, exposing demand-cycle risk.
Continental AG builds its edge on material innovation, averaging 26% renewable and recycled content in 2024 with a target above 40% by 2030. This positions it well against tightening EU sustainability rules. As per our research, about 30% of vehicles risk running unsafe tires between inspections, giving Continental a large safety-led replacement audience. Its focused tire strategy sharpens execution but concentrates exposure to raw material cost swings.
Key Players
- Michelin
- Bridgestone Corporation
- Goodyear Tire & Rubber Company
- Continental AG
- Pirelli & C. S.p.A.
- Sumitomo Rubber Industries
- Yokohama Rubber Company
- Hankook Tire & Technology
- Kumho Tire
- Toyo Tire Corporation
- Zhongce Rubber Group (ZC Rubber)
- Apollo Tyres Ltd.
- MRF Limited
- Maxxis International
- Nokian Tyres
Recent Developments
- February 2025: Yokohama Rubber completed its acquisition of Goodyear’s off-the-road tire business for US$905 million, closing on February 4 and consolidating into Yokohama’s results from Q1 2025.
- April 2025: Bridgestone unveiled its M870 demonstration tire supporting 70% recycled and renewable materials, split as 37% renewable and 33% recycled, the first commercially available tire to reach that milestone.
- September 2025: Continental completed the spin-off of its Automotive group sector as an independent company named AUMOVIO, listed on the Frankfurt Stock Exchange on September 18, leaving Continental AG to focus exclusively on its global tire business.
- July 2026: Continental Tire launched the TerrainContact A/T2 all-terrain tire, following the earlier release of its SecureContact AW premium all-weather touring tire.
Geopolitical Impact Analysis
Trade policy shifts are reshaping tire manufacturing and pricing across major corridors. According to the WTO, tariff escalations on imported tires and rubber intermediates raised landed costs in key markets, with some duties exceeding 25% on specific origins. UNCTAD data shows global container freight rates climbing over 200% on disrupted lanes during 2024 to 2025. This means producers reliant on cross-border rubber sourcing face compounding cost pressure that squeezes per-unit margins.
Energy and commodity volatility further strain the tire supply base. As reported by the IEA, oil price swings during 2025 lifted synthetic rubber and carbon black feedstock costs, since both derive from petroleum inputs. World Bank commodity data recorded natural rubber prices rising above 40% year-on-year amid Southeast Asian supply concentration. Therefore, manufacturers accelerate nearshore sourcing and dual-supplier strategies to shield production from single-region shocks and stabilize delivered pricing.
Report Scope
| Report Features | Description |
|---|---|
| Market Value (2025) | USD 21.9 Billion |
| Forecast Revenue (2035) | USD 28.9 Billion |
| CAGR (2026-2035) | 2.8% |
| Base Year for Estimation | 2025 |
| Historic Period | 2020-2024 |
| Forecast Period | 2026-2035 |
| Report Coverage | Revenue Forecast, Market Dynamics, Market Opportunity Analysis, Technology and Innovation Landscape, Competitive Landscape, Recent Developments |
| Segments Covered | By Tire Type (Radial Tires, Bias Tires), By Vehicle Type (Passenger Cars, Light Commercial Vehicles, Heavy Commercial Vehicles, Two-Wheelers), By Season Type (All-Season Tires, Summer Tires, Winter Tires, Performance Tires), By Distribution Channel (Replacement/Aftermarket, OEM), By Rim Size (13 to 15 Inches, 16 to 18 Inches, 19 to 21 Inches, Above 21 Inches), By Sales Channel (Tire Dealers and Retailers, Independent Service Centers, OEM Dealerships, Online Sales), By Technology (Conventional Tires, Run-Flat Tires, Smart Tires, Airless Tires), By Propulsion Type (ICE Vehicles, Electric Vehicles) |
| Regional Analysis | North America (US and Canada), Europe (Germany, France, The UK, Spain, Italy, and Rest of Europe), Asia Pacific (China, Japan, South Korea, India, Australia, and Rest of APAC), Latin America (Brazil, Mexico, and Rest of Latin America), Middle East and Africa (GCC, South Africa, and Rest of MEA) |
| Competitive Landscape | Michelin, Bridgestone Corporation, Goodyear Tire & Rubber Company, Continental AG, Pirelli & C. S.p.A., Sumitomo Rubber Industries, Yokohama Rubber Company, Hankook Tire & Technology, Kumho Tire, Toyo Tire Corporation, Zhongce Rubber Group (ZC Rubber), Apollo Tyres Ltd., MRF Limited, Maxxis International, Nokian Tyres |
| Customization Scope | Customization for segments, region / country-level will be provided. Additional customization can be done based on requirements. |
| Purchase Options | We have three licenses to opt for: Single User License | Multi-User License (Up to 5 Users) | Corporate Use License (Unlimited User and Printable PDF) |





































