Report Overview
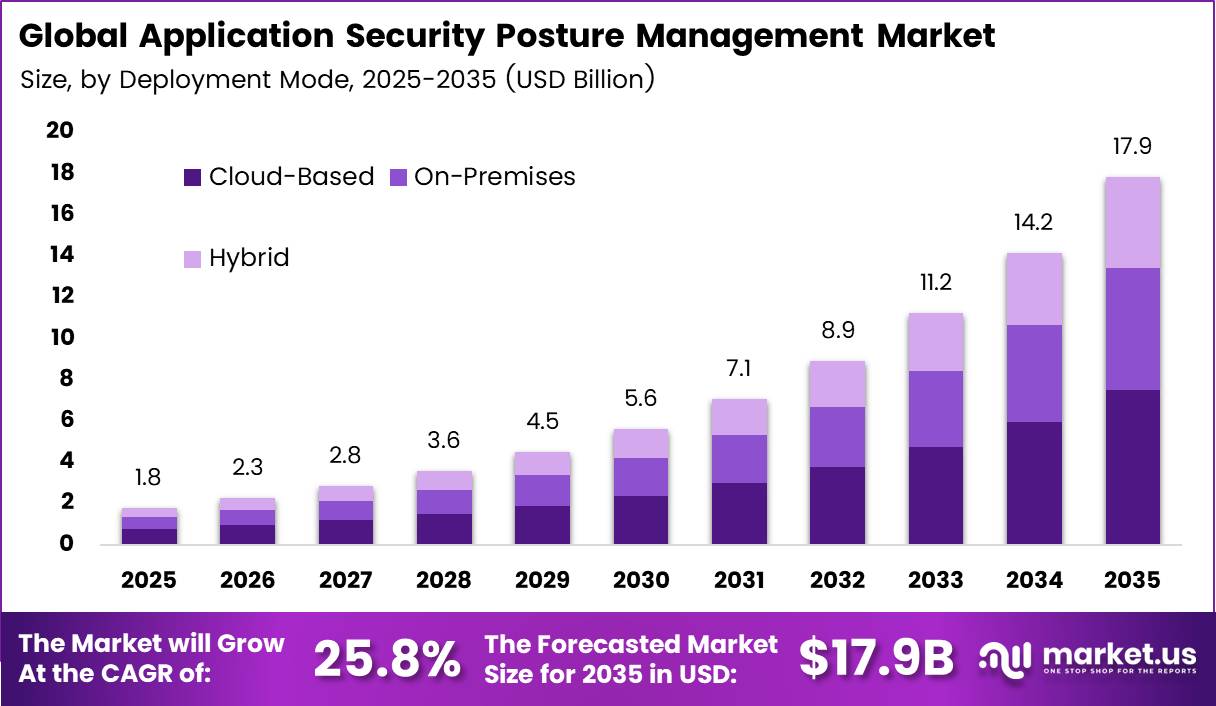
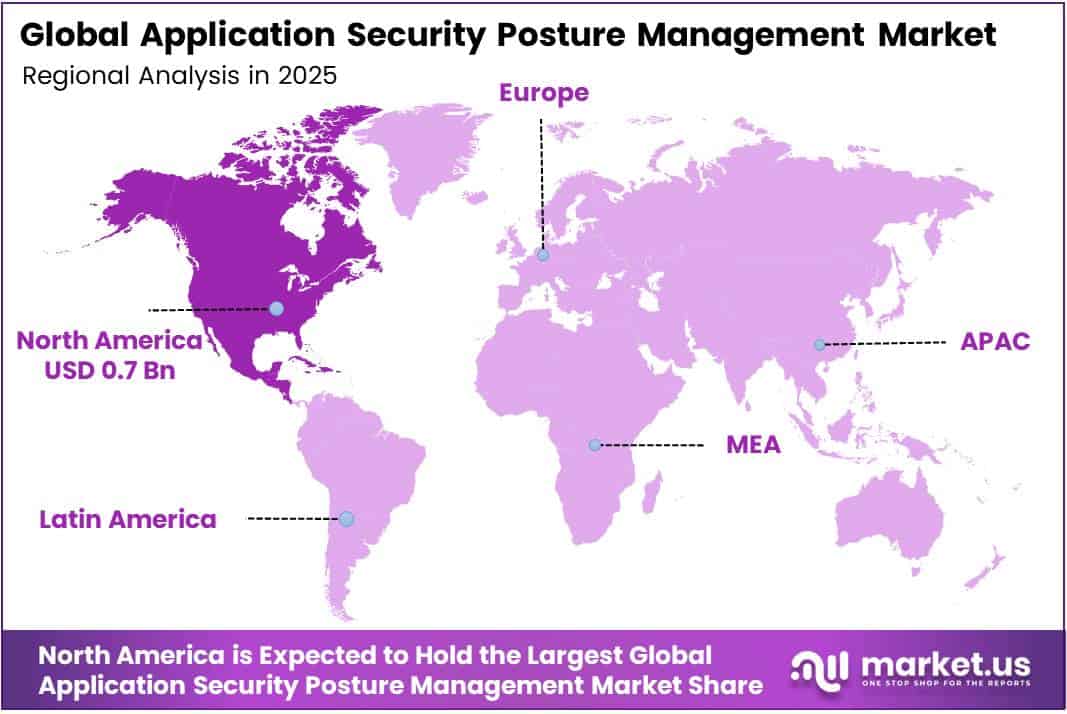
In 2025, the Global Application Security Posture Management Market was valued at USD 1.8 billion. The market is projected to grow at a CAGR of 25.8% during 2026–2035, reaching approximately USD 17.9 billion by 2035. North America dominated the global market in 2025, accounting for more than 39.0% of the total market share and generating approximately USD 0.7 billion in revenue.
Cyber losses keep rising, and this drives growth. The FBI Internet Crime Complaint Center reported 16.6 billion dollars in losses in 2024, a 33% rise from 2023. Businesses now run more of their work through web and cloud apps. The ITU estimates that 5.5 billion people used the internet in 2024, so the attack surface keeps getting bigger.
The North America region has the deepest base of cloud-first software firms and security buyers. The US Bureau of Labor Statistics projects 33% job growth for information security analysts from 2023 to 2033, which points to strong and lasting demand for security work. Federal rules also drive spending.
Key Takeaways
- The Application Security Posture Management Market reached USD 1.8 Billion in 2025 and will reach USD 17.9 Billion by 2035. at a CAGR of 25.8% from 2026 to 2035.
- By Component, Software / Platforms leads with a 72.0% share.
- By Deployment Mode, Cloud-Based leads with a 58.0% share.
- By Organization Size, Large Enterprises lead with a 65.0% share.
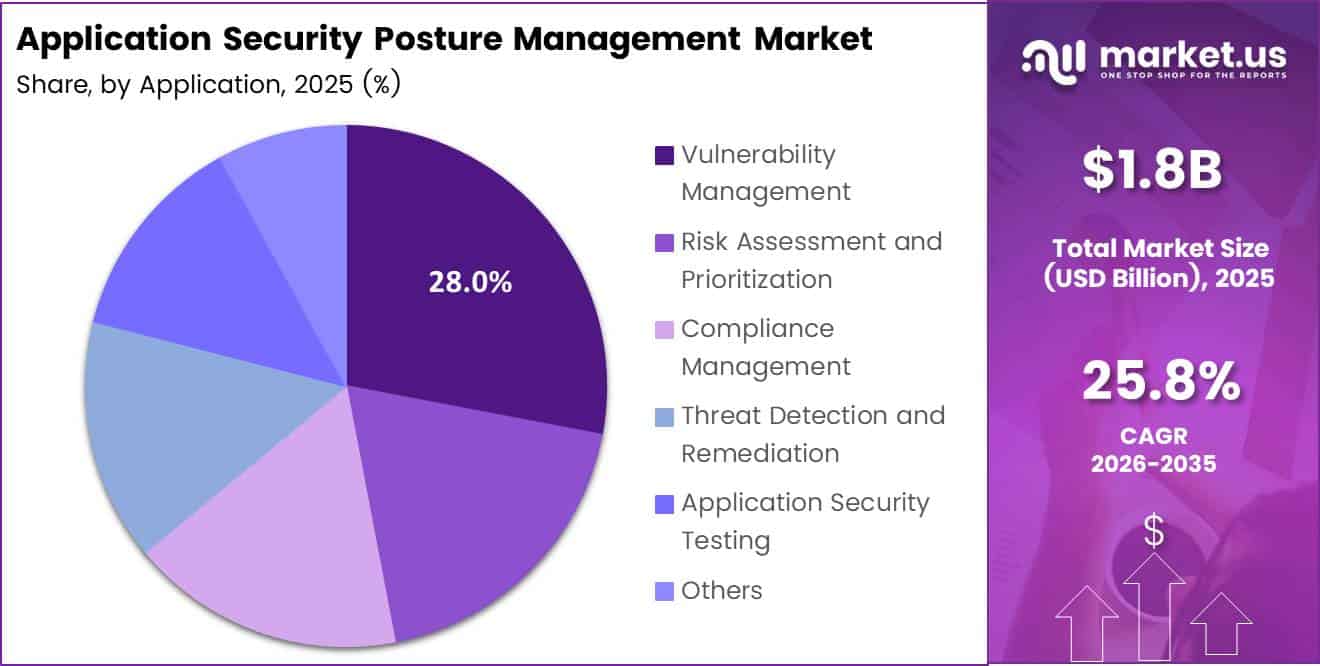
- By Application, Vulnerability Management leads with a 28.0% share.
- By End-Use Industry, BFSI leads with a 24.0% share.
- North America leads the market with a 39.0% share and USD 0.7 billion in revenue.
By Component
Software / Platforms dominates with 72.0% due to automated, always-on code risk visibility.
Software platforms lead because security teams can no longer track flaws by hand. The U.S. National Vulnerability Database logged more than 40,000 new CVEs in 2024. Only automated tools can sort, score, and link that many flaws to live code. Platforms pull data from scanners, code stores, and cloud consoles into one view, so leaders can act fast.
Services grow fastest because buyers lack skilled staff to run these tools well. The U.S. Bureau of Labor Statistics expects jobs for information security analysts to rise 33% from 2023 to 2033. That is far above the average for all jobs. It also expects about 17,300 openings each year, and many firms cannot fill them.
By Deployment Mode
Cloud-Based dominates with 58.0% due to fast setup across cloud-native apps.
Cloud-based tools lead because business software now lives in the cloud. Eurostat reports that 52.74% of EU enterprises used paid cloud services in 2025. That share rose 7.42 percentage points from 2023. Cloud ASPM tools connect to these systems in hours, need no hardware, and update their rules on their own.
Developers also build more apps directly in the cloud. Eurostat found that 13.76% of enterprises bought hosted platforms to develop, test, or deploy software. Each of these platforms adds new code paths, settings, and access keys that security teams must watch. Cloud-based posture tools track this growth best.
By Organization Size
Large Enterprises dominate with 65.0% due to vast app portfolios and budgets.
Large enterprises lead because they run thousands of apps across many teams, clouds, and regions. Eurostat shows that 84.67% of large EU enterprises used paid cloud services in 2025. This creates a huge attack surface that needs constant, central oversight. Big firms also have security budgets, compliance teams, and board-level pressure to fund full platforms.
SMEs grow fastest as they move to the cloud and face the same attacks as large firms. Cloud use among medium-sized EU firms climbed to 66.78% in 2025, up from 59.09% in 2023. Smaller firms rarely have security staff, so they want simple, low-cost tools. Vendors now offer usage-based pricing and preset policies, which lowers the entry cost for this group.
By Application
Vulnerability Management dominates with 28.0% due to the rising volume of known flaws.
Vulnerability management leads because it is the first job every security team must do well. Government rules raise the stakes. CISA Binding Operational Directive 22-01 tells U.S. federal agencies to fix listed exploited flaws within 2 weeks for newer CVEs and 6 months for older ones.
Threat detection and remediation grows fastest because attackers now strike live systems faster than teams can patch them. The FBI received 4,878 complaints from critical infrastructure groups hit by cyber threats in 2024. Ransomware complaints in these sectors rose 9% from the year before.
By End-Use Industry
BFSI dominates with 24.0% due to high-value payment apps facing fraud.
Banks, insurers, and financial firms lead because their apps move money every second, which makes them top targets. The FBI logged 21,442 business email compromise cases in 2024. Those cases caused about $2.79 billion in reported U.S. losses. Cyber-enabled fraud drove 83% of all losses reported to IC3 that year.
Healthcare grows fastest as hospitals connect patient records, billing, and medical devices through new apps and cloud links. Many care providers run old systems and small security teams, and ransomware groups target them often. Federal health privacy rules and growing breach reports now push health systems to fund app security tools that map risk across every patient-facing service.
Key Market Segments
By Component
- Software / Platforms
- Services
By Deployment Mode
- Cloud-Based
- On-Premises
- Hybrid
By Organization Size
- Small and Medium-Sized Enterprises (SMEs)
- Large Enterprises
By Application
- Vulnerability Management
- Risk Assessment and Prioritization
- Compliance Management
- Threat Detection and Remediation
- Application Security Testing
By End-Use Industry
- Banking, Financial Services, and Insurance (BFSI)
- IT and Telecommunications
- Healthcare
- Government and Public Sector
- Retail and E-commerce
- Manufacturing
- Others
Geopolitical Impact Analysis
ASPM is software, but it runs on hardware that faces trade pressure. Cloud servers, GPUs, and security appliances all need chips. In January 2025, the US raised Section 301 tariffs on Chinese semiconductors from 25% to 50%. This raises the cost of the data center capacity that cloud ASPM tools use.
Shipping problems in the Red Sea add more cost. UNCTAD reported that Suez Canal transits fell by about 42% in early 2024. Ships that go around the Cape of Good Hope add 10 to 14 days to their trips. These delays slow the delivery of servers and network gear to data centers in Europe and Asia.
Energy prices also affect what cloud services cost. The IEA expects data center power use to roughly double to about 945 TWh by 2030. When power prices swing, cloud providers pass the cost on in their pricing. ASPM vendors that host their platforms on public clouds then face higher operating costs.
Rules on where data can be stored split the market further. The WTO notes that global trade growth slowed under new tariff measures in 2025. Countries such as China and India also tighten data localization rules. Vendors must build regional instances, which raises costs and favors hybrid and local deployments.
Regional Analysis
North America dominates the Application Security Posture Management Market, holding a 39.0% share and generating USD 0.7 billion in revenue. The US drives most of this demand. It is home to the largest cloud providers and many of the top security vendors.
Firms in the region adopt DevSecOps early and fold ASPM tools into their CI/CD pipelines. Federal policy adds strong pull. Executive Order 14028 requires software suppliers to the US government to attest to secure development practices and to provide a software bill of materials.
Asia Pacific is the fastest-growing region in the market. India, China, Japan and South Korea are building digital economies at speed. India’s UPI handled more than 13 billion transactions a month in 2024, and that volume raises the stakes for app security. India’s DPDP Act and China’s data laws push firms to secure their apps. Australia adds demand through its 2023 to 2030 Cyber Security Strategy.
Europe holds a strong second position. The NIS2 Directive covers 18 sectors and sets fines of up to 10 million euros or 2% of global turnover. The EU Cyber Resilience Act adds security duties for software products. Germany, France and the UK lead regional spending. Firms in these countries use ASPM tools to show proof of compliance to regulators and to manage software supply chain risk across borders.
Key Regions and Countries
North America
- US
- Canada
Europe
- Germany
- France
- The UK
- Spain
- Italy
- Rest of Europe
Asia Pacific
- China
- Japan
- South Korea
- India
- Australia
- Rest of APAC
Latin America
- Brazil
- Mexico
- Rest of Latin America
Middle East and Africa
- GCC
- South Africa
- Rest of MEA
Market Dynamics
Drivers
| Driver | (~) % Impact on CAGR Forecast | Geographic Relevance | Impact Timeline |
|---|---|---|---|
| AI-Accelerated Code Velocity and Vulnerability Sprawl | +3.2% | Global, led by North America | Short term (2 years or less) |
| Software Supply Chain and SBOM Mandates | +2.6% | North America, Europe | Short term (2 years or less) |
| AppSec Tool Consolidation into Unified Platforms | +2.1% | North America, Europe, APAC | Medium term (2 to 4 years) |
| Cloud-Native and Microservices Adoption | +1.8% | Global | Medium term (2 to 4 years) |
| Board-Level Cyber Disclosure Obligations | +1.4% | United States, EU | Short term (2 years or less) |
| DevSecOps Shift-Left Institutionalization | +1.1% | Global | Medium term (2 to 4 years) |
AI-Accelerated Code Velocity and Vulnerability Sprawl
The root cause is that generative coding assistants have greatly increased how fast code gets written. GitHub’s developer surveys indicated that more than 90% of US-based developers were using AI coding tools by 2024, and Microsoft earnings calls reported GitHub Copilot passing 1.3 million paid subscribers in early 2024. Google’s earnings commentary said that over 25% of new internal code was AI-generated by late 2024.
The quantitative effect follows from that growth. The NIST National Vulnerability Database logged roughly 40,000 CVEs in 2024, about 38% more than in 2023, while CISA’s Known Exploited Vulnerabilities catalog continued to add entries every week. Enterprises running separate SAST, DAST, SCA, and secrets scanners now face finding volumes that can no longer be triaged by hand.
Disclosures from public security vendors such as CrowdStrike and Palo Alto Networks in SEC filings show platform ARR growing faster than point-product revenue, and correlation-led triage cutting remediation backlog by an estimated 30% to 50% lowers customer acquisition cost through land-and-expand motions.
Restraints
| Restraint | (~) % Impact on CAGR Forecast | Geographic Relevance | Impact Timeline |
|---|---|---|---|
| Security Budget Freezes and Spend Rationalization | -1.9% | North America, Europe | Short term (2 years or less) |
| Data Residency and Code Sovereignty Prohibitions | -1.4% | EU, China, India, Middle East | Medium term (2 to 4 years) |
| Sunk-Cost Lock-In to Legacy Scanner Contracts | -1.1% | Global | Short term (2 years or less) |
| Procurement Barriers in Public Sector Certification | -0.8% | United States, EU, APAC | Medium term (2 to 4 years) |
| SMB Affordability Thresholds | -0.7% | Emerging Markets, APAC, LATAM | Long term (4 years or more) |
Security Budget Freezes and Spend Rationalization
The root cause is a high cost of capital. The Federal Reserve held its policy rate above 5% through much of 2024, and the European Central Bank kept its deposit rate elevated over the same period, which pushed CFOs to require proof of payback before approving any new security line item.
That creates a measurable bottleneck. IANS Research and Artico security budget benchmarks show budget growth slowing to around 8% in 2024, down from 17% in 2022. Company earnings calls from Okta, SentinelOne and Rapid7 described longer deal cycles, with extra approval layers adding roughly 1 to 2 quarters to enterprise sales.
The strategic impact is that new ASPM deals are frozen until existing tools are retired. Vendors respond by discounting multi-year contracts by an estimated 15% to 25%, which squeezes gross margins, while buyers push back the CapEx needed to integrate ASPM into CI/CD pipelines.
Challenges
| Challenge | (~) % CAGR Friction Drag | Geographic Relevance | Mitigation Horizon |
|---|---|---|---|
| AppSec Talent Deficit | -1.6% | Global | Long term (4 years or more) |
| Alert Fatigue and False Positives | -1.2% | Global | Medium term (2 to 4 years) |
| Fragmented Toolchain Data Normalization | -1.0% | North America, Europe | Medium term (2 to 4 years) |
| Developer Adoption Resistance | -0.7% | Global | Short term (2 years or less) |
| Securing AI-Generated Code Provenance | -0.6% | North America, APAC | Long term (4 years or more) |
AppSec Talent Deficit
The structural weakness is a severe shortage of security specialists who also understand software development. The ISC2 Cybersecurity Workforce Study put the global workforce gap at about 4.8 million professionals in 2024, and NIST’s CyberSeek data showed roughly 450,000 open US cybersecurity roles.
The friction is easy to quantify. Developers outnumber security engineers by an estimated 100 to 1 in typical enterprises, and US Bureau of Labor Statistics wage data shows information security analyst pay rising faster than general IT pay. Many ASPM deployments therefore remain only partly configured, and organizations capture perhaps 40% to 60% of the platform’s potential value.
Opportunities
| Opportunity | (~) % Potential CAGR Upside | Geographic Relevance | Execution Window |
|---|---|---|---|
| Agentic AI Auto-Remediation Monetization | +2.4% | Global, led by North America | Medium term (2 to 4 years) |
| EU Cyber Resilience Act Compliance Tooling | +1.7% | Europe | Medium term (2 to 4 years) |
| MSSP-Delivered ASPM for Mid-Market | +1.3% | APAC, LATAM, Middle East | Medium term (2 to 4 years) |
| Convergence with CNAPP via M&A Roll-Ups | +1.1% | North America, Israel, Europe | Short term (2 years or less) |
| AI Model and LLM Application Posture | +0.9% | Global | Long term (4 years or more) |
Agentic AI Auto-Remediation Monetization
The white space is a new way of charging customers. Vendors could shift from per-seat pricing to outcome-based pricing per verified fix, turning remediation labor, which consumes a significant portion of the addressable market, into software revenue.
Using US Bureau of Labor Statistics engineering wage data, a fix costing about $300 to $600 in manual effort could drop by an estimated 70% to 85% when an AI agent generates and validates it. The margin effect is significant.
Cloud inference pricing disclosed in Microsoft, Google, and Amazon earnings calls keeps falling, which could lift gross margins on remediation SKUs toward 80% or more. Vendors that set auditable fix-acceptance standards first, aligned with NIST Secure Software Development Framework guidance, are best positioned to capture this upside.
Key Players Analysis
Tier 1 leaders combine large revenue with full security platforms. Palo Alto Networks posted fiscal 2025 revenue of USD 9.2 billion, up 15%. Its Next-Generation Security ARR grew 32% to USD 5.6 billion. The company spent USD 986.1 million on R&D in the first half of fiscal 2025 alone.
Fortinet grew revenue 14% to USD 6.80 billion in 2025. Product revenue rose 16% to USD 2.22 billion, and free cash flow reached USD 2.21 billion. Its Unified SASE and SecOps billings grew 24%. That growth shows strong pull for platforms that bring network and app security together.
Check Point Software Technologies posted 2025 revenue of USD 2,725 million, up 6%, with billings of USD 2,906 million. It paid about USD 190 million in net cash for Lakera AI to secure agentic AI apps. It also raised USD 2 billion through convertible notes, which gives it funds for more acquisitions. Cisco rounds out Tier 1 and builds on its USD 28 billion Splunk purchase.
Tier 2 challengers include Sophos, Trend Micro, SonicWall, WatchGuard, Barracuda, Juniper, Huawei, HPE, ESET, Avast and Hillstone Networks. These firms hold strong regional or mid-market positions. HPE completed its USD 14 billion acquisition of Juniper in July 2025 to strengthen its secure networking business. Huawei and Hillstone lead in China. Sophos and WatchGuard focus on SMEs through partner channels.
Top Key Players in the Market
- Fortinet, Inc.
- Cisco Systems, Inc.
- Sophos Limited
- Check Point Software Technologies Ltd.
- WatchGuard Technologies, Inc.
- SonicWall, Inc.
- Palo Alto Networks, Inc.
- Barracuda Networks, Inc.
- Juniper Networks, Inc.
- Huawei Technologies Co., Ltd.
- Trend Micro Incorporated
- Hewlett Packard Enterprise (HPE)
- ESET, spol. s r.o.
- Avast Software s.r.o.
- Hillstone Networks
Recent Developments
- In February 2026, Check Point Software Technologies reported full-year 2025 revenue of USD 2,725 million. It also announced three new acquisitions to expand its AI security platform.
- In November 2025, Palo Alto Networks agreed to acquire Chronosphere, an observability platform, for USD 3.35 billion.
- In July 2025, Hewlett Packard Enterprise completed its acquisition of Juniper Networks for about USD 14 billion.
Report Scope
| Report Features | Description |
|---|---|
| Market Value (2025) | USD 1.8 Billion |
| Forecast Revenue (2035) | USD 17.9 Billion |
| CAGR (2026-2035) | 25.8% |
| Base Year for Estimation | 2025 |
| Historic Period | 2020-2024 |
| Forecast Period | 2026-2035 |
| Report Coverage | Revenue Forecast, Market Dynamics, Competitive Landscape, Recent Developments |
| Segments Covered | By Component (Software / Platforms, Services); By Deployment Mode (Cloud-Based, On-Premises, Hybrid); By Organization Size (Small and Medium-Sized Enterprises (SMEs), Large Enterprises); By Application (Vulnerability Management, Risk Assessment and Prioritization, Compliance Management, Threat Detection and Remediation, Application Security Testing); By End-Use Industry (Banking, Financial Services, and Insurance (BFSI), IT and Telecommunications, Healthcare, Government and Public Sector, Retail and E-commerce, Manufacturing, Others) |
| Regional Analysis | North America – US, Canada; Europe – Germany, France, The UK, Spain, Italy, Rest of Europe; Asia Pacific – China, Japan, South Korea, India, Australia, Singapore, Rest of APAC; Latin America – Brazil, Mexico, Rest of Latin America; Middle East & Africa – GCC, South Africa, Rest of MEA |
| Competitive Landscape | Fortinet, Inc., Cisco Systems, Inc., Sophos Limited, Check Point Software Technologies Ltd., WatchGuard Technologies, Inc., SonicWall, Inc., Palo Alto Networks, Inc., Barracuda Networks, Inc., Juniper Networks, Inc., Huawei Technologies Co., Ltd., Trend Micro Incorporated, Hewlett Packard Enterprise (HPE), ESET, spol. s r.o., Avast Software s.r.o., Hillstone Networks |
| Customization Scope | We will provide customization for segments and region/country levels. Moreover, additional customization can be done based on the requirements. |
| Purchase Options | We have three licenses to opt for: Single User License, Multi-User License (Up to 5 Users), Corporate Use License (Unlimited Users and Printable PDF) |