Report Overview
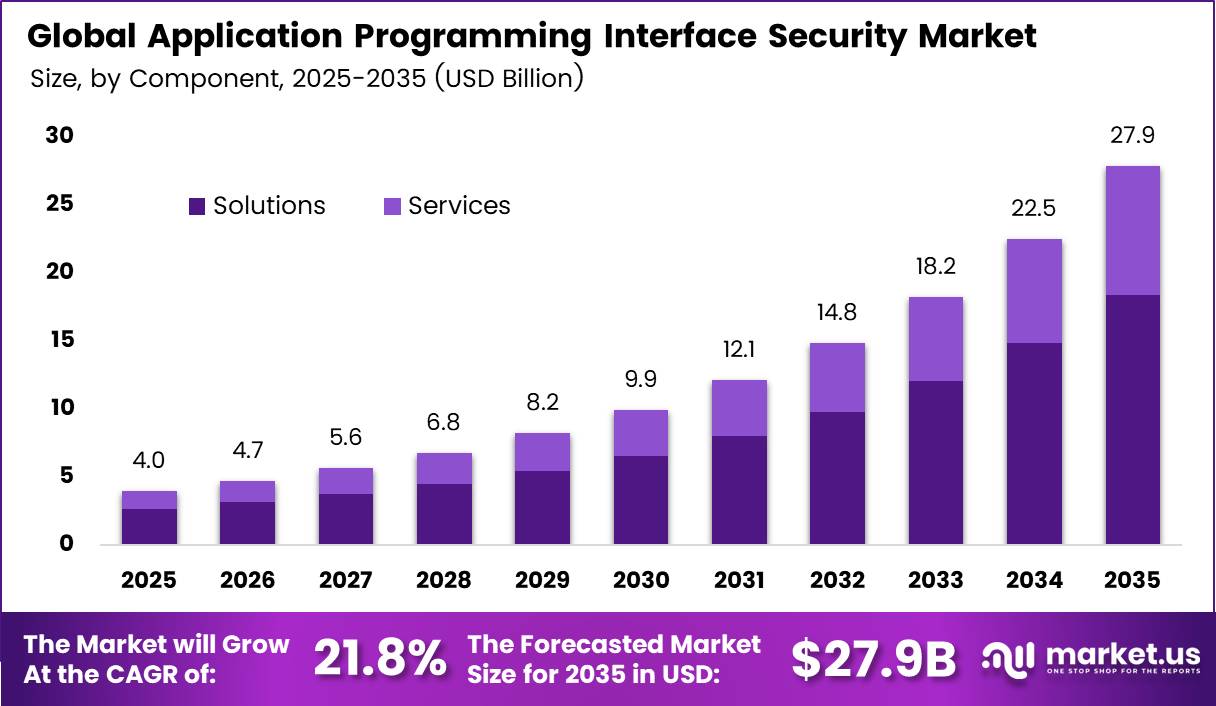
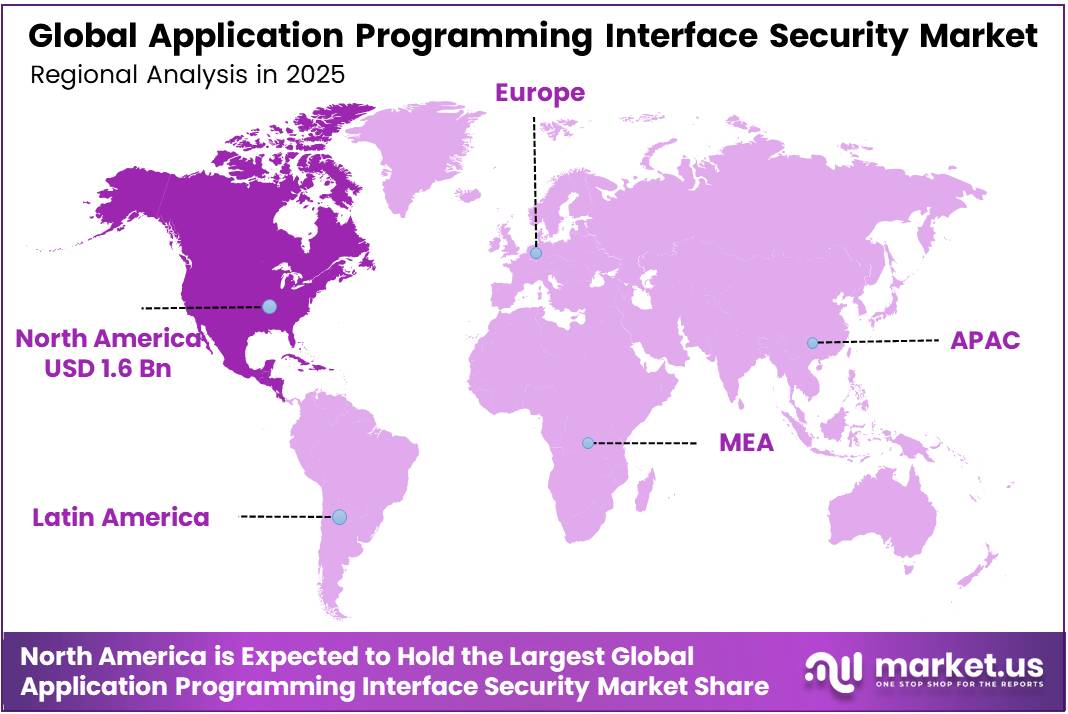
In 2025, the Global Application Programming Interface Security Market was valued at USD 4.0 billion. The market is projected to grow at a CAGR of 21.8% during 2026–2035, reaching approximately USD 27.9 billion by 2035. North America dominated the global market in 2025, accounting for more than 39.0% of the total market share and generating approximately USD 1.6 billion in revenue.
APIs now carry most digital business traffic. Cloudflare reported that APIs make up 57% of the dynamic Internet traffic on its network, so every app, payment, and partner link now depends on API protection. Attacks keep growing too. The FBI Internet Crime Complaint Center logged 859,532 complaints in 2024, with losses of USD 16.6 billion. That marks a 33% jump from 2023.
The ITU counts about 5.5 billion people online, and each new user adds API calls through mobile banking, shopping, and healthcare apps. Banks, insurers, and hospitals must now protect machine-to-machine traffic at scale. This pushes firms to buy authentication, threat detection, and API monitoring tools.
The North America region has the largest base of cloud and security vendors. According to the World Bank, the US economy produced about USD 27.7 trillion in GDP in 2023, the largest in the world. A digital economy that big creates heavy API use across finance, retail, and government. The OECD reports that ICT investment in the US stays among the highest of its member countries.
Key Takeaways
- The API Security Market is valued at USD 4.0 Billion in 2025 and should reach USD 27.9 Billion by 2035. grow at a 21.8% CAGR from 2026 to 2035.
- By Component, Solutions lead with a 68.0% share.
- By Deployment Mode, Cloud-Based leads with a 55.0% share.
- By Organization Size, Large Enterprises lead with a 68.0% share.
- By Security Type, API Authentication and Authorization leads with a 25.0% share.
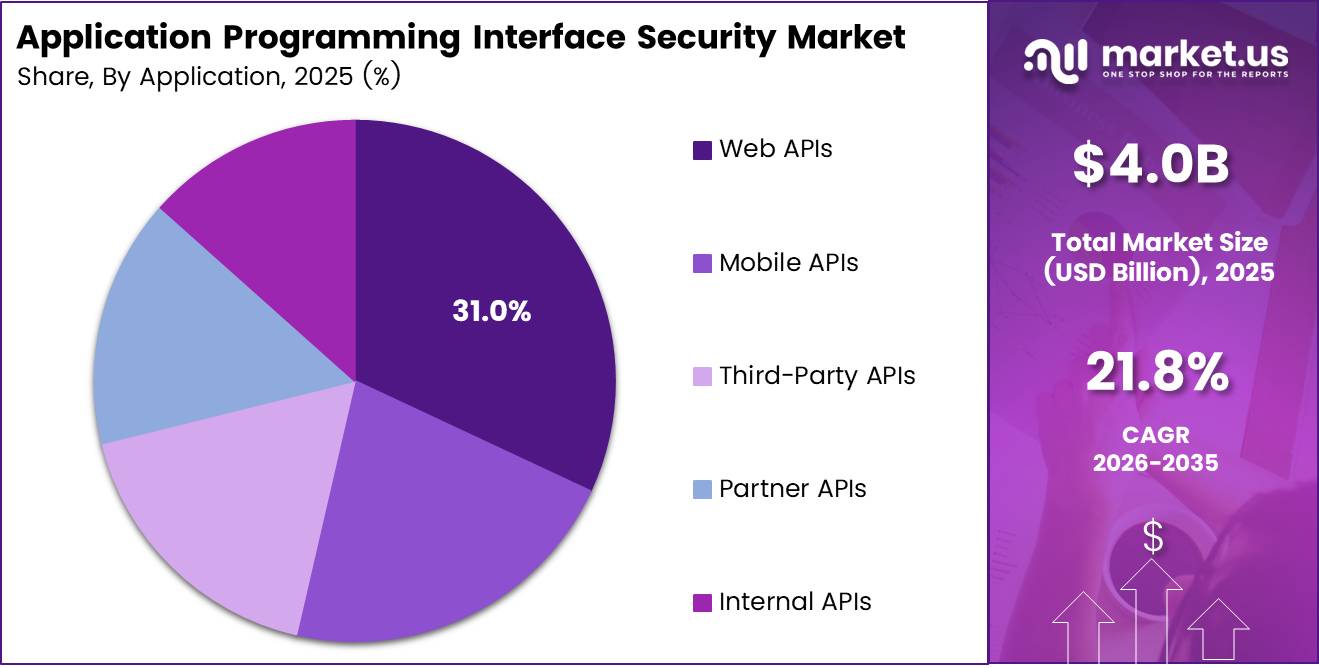
- By Application, Web APIs lead with a 31.0% share.
- By End-Use Industry, BFSI leads with a 24.0% share.
- North America leads with a 39.0% share, generating USD 1.6 billion in revenue.
By Component
Solutions dominate with 68.0% due to automated API discovery and runtime protection.
Solutions lead the market because firms need software that sees and blocks risky API calls in real time. APIs now carry 57% of the dynamic internet traffic that Cloudflare processes, so security teams cannot check this flow by hand.
Hidden APIs make this need even stronger. Cloudflare’s machine learning tools found 30.7% more API endpoints than companies reported themselves, and more than 15,000 customer accounts had endpoints that only machine learning could find.
Services form the fastest-growing part of this group. Nearly 60% of organizations allow write access to at least half of their APIs, which raises the risk of data changes and theft. Many firms lack staff who can fix these settings, so they hire consultants, managed security providers, and testing teams.
By Deployment Mode
Cloud-Based dominates with 55.0% due to fast rollout across distributed API gateways.
Cloud-based tools hold the top spot because most APIs now live in public clouds, and security works best close to the traffic. Eurostat reports that 52.74% of EU enterprises paid for cloud computing services in 2025, up from 45.2% in 2023.
Hybrid deployment is growing the fastest. Eurostat data shows cloud use rose by 7.42 percentage points in just two years, yet many banks, hospitals, and public bodies still keep core systems in their own data centers for legal and data residency reasons. These firms want one policy that covers both worlds.
By Organization Size
Large enterprises dominate with 68.0% due to thousands of APIs across business units.
Large enterprises lead spending because they run huge API estates that link payment, supply chain, and customer apps. Eurostat data shows that about 78% of large EU enterprises used cloud services in 2023, far above smaller peers, and each cloud workload adds new API connections to protect.
Small and medium-sized enterprises (SMEs) form the fastest-growing group. Cloud use among medium-sized EU firms climbed from 59.09% in 2023 to 66.78% in 2025, and this shift pushes more SMEs to expose APIs through online stores, payment links, and partner apps. Attackers often target smaller firms because they expect weak defenses.
By Security Type
API Authentication and Authorization dominates with 25.0% due to rising stolen credential and token abuse.
Authentication and authorization lead this group because every API call must prove who is asking and what it may do. The FBI’s Internet Crime Complaint Center logged 859,532 complaints in 2024, and phishing and spoofing topped the list with 193,407 cases. Phishing often steals passwords and tokens that attackers then reuse against APIs. Weak access rules let one stolen key unlock large data sets.
Threat detection and prevention is accelerating the fastest. The FBI recorded 263,455 cyberthreat complaints tied to ransomware, malware, data breaches, and denial-of-service attacks, with losses of $1.571 billion. Total reported losses rose 33% in one year to $16.6 billion. Attackers now use bots and logic abuse that pass login checks, so firms need tools that watch behavior in real time.
By Application
Web APIs dominate with 31.0% due to browser-based apps driving most traffic.
Web APIs hold the biggest share because websites, online portals, and software-as-a-service tools still run most daily business tasks. ITU estimates that almost three-quarters of the world’s people now go online, while 2.2 billion people remain offline and form the next wave of web users.
Mobile APIs grow the fastest. ITU counts 9.2 billion mobile-cellular subscriptions in 2025 and 99 mobile broadband subscriptions per 100 people. 5G now makes up 36% of mobile broadband subscriptions, which supports richer apps for banking, shopping, and ride booking. Each app talks to back-end servers through APIs, and attackers often take apps apart to find hidden keys.
By End-Use Industry
Banking, Financial Services, and Insurance (BFSI) dominates with 24.0% due to open banking and payment API mandates.
BFSI leads because banks, insurers, and payment firms expose more APIs than almost any other sector through open banking, mobile wallets, and partner lending. These APIs move real money, so attackers aim at them first.
The FBI reports that business email compromise alone caused $2.77 billion in losses in 2024, and investment fraud losses passed $6.5 billion. Real-time payments and digital lending apps add new endpoints every quarter.
Healthcare is the fastest-growing industry in this group. The U.S. Department of Health and Human Services recorded 663 large health data breaches in 2024, affecting about 242.9 million people. Hacking topped the list, and the largest single case hit about 192 million people. Hospitals now share records through electronic health record APIs, insurance links, and telehealth apps.
Key Market Segments
By Component
- Solutions
- Services
By Deployment Mode
- Cloud-Based
- On-Premises
- Hybrid
By Organization Size
- Small and Medium-Sized Enterprises (SMEs)
- Large Enterprises
By Security Type
- API Authentication and Authorization
- API Threat Detection and Prevention
- API Monitoring and Analytics
- API Vulnerability Management
- API Compliance and Governance
By Application
- Web APIs
- Mobile APIs
- Third-Party APIs
- Partner APIs
- Internal APIs
By End-Use Industry
- Banking, Financial Services, and Insurance (BFSI)
- IT and Telecommunications
- Healthcare
- Government and Public Sector
- Retail and E-commerce
- Manufacturing
- Others
Geopolitical Impact Analysis
API security runs mostly as software, but it still depends on hardware. Vendors need servers, GPUs, and network appliances to inspect traffic. In 2025, the US raised Section 301 tariffs on Chinese semiconductors to 50%, up from 25%. The WTO tracks how these moves raise costs for data center chips. Vendors that sell physical gateways and edge boxes, such as F5 and Fortinet, feel these costs most.
Shipping problems add delays. UNCTAD found that container tonnage through the Suez Canal fell by 82% by February 2024 for the largest ships. Rerouting around the Cape of Good Hope adds about 10 to 14 days per Asia-to-Europe voyage. The IMF measured a 50% drop in Suez trade volume in early 2024. Server and appliance shipments to European data centers took longer as a result.
Energy prices also shape costs. The IEA expects data center power use to reach about 945 TWh by 2030, more than double today. Gas price swings in Europe raise the cost of running the cloud capacity that hosts API traffic inspection. Prices for copper, used in data center cabling, rose more than 10% in 2025, according to World Bank commodity data.
Tensions also change who buys from whom. Data localization rules in the EU, China, and India force vendors to build local points of presence. This raises capital spending but creates regional demand for sovereign API gateways and compliance tools.
Regional Analysis
North America dominates the Application Programming Interface Security Market, holding a 39.0% share and generating USD 1.6 billion in revenue. The US hosts the headquarters of most leading vendors, including Google, Palo Alto Networks, Akamai, Cloudflare, Fortinet, F5, and Broadcom. These firms run large R&D programs close to their biggest buyers. US banks lead in open finance.
Healthcare adds more pressure. The US HHS reported that large health data breaches affected more than 275 million records in 2024. The CMS Interoperability rule also requires payers to run FHIR-based APIs. Government buyers follow the CISA Zero Trust Maturity Model, which pushes federal agencies to verify every API call.
Asia Pacific shows strong momentum from digital payments. India’s UPI handled over 170 billion transactions in 2024, according to NPCI, and each one runs on APIs. China, Japan, South Korea, and Australia invest heavily in cloud and 5G. Australia’s Consumer Data Right extends open APIs to banking and energy. Regional data rules, such as India’s DPDP Act, push firms toward API governance tools.
Europe holds the second position, driven by strict rules. The NIS2 Directive covers about 160,000 entities across the EU. The Digital Operational Resilience Act, live since January 2025, forces banks to test third-party API risk. PSD2 open banking already runs on APIs in Germany, France, the UK, Spain, and Italy. Eurostat data shows that about 45% of EU enterprises bought cloud services in 2023, which raises API exposure.
Key Regions and Countries
North America
- US
- Canada
Europe
- Germany
- France
- The UK
- Spain
- Italy
- Rest of Europe
Asia Pacific
- China
- Japan
- South Korea
- India
- Australia
- Rest of APAC
Latin America
- Brazil
- Mexico
- Rest of Latin America
Middle East and Africa
- GCC
- South Africa
- Rest of MEA
Market Dynamics
Drivers
| Driver | (~) % Impact on CAGR Forecast | Geographic Relevance | Impact Timeline |
|---|---|---|---|
| Surge in API-Targeted Attacks and Breaches | +3.2% | Global | Short term (2 years or less) |
| Mandatory Payment and Financial Resilience Compliance | +2.4% | North America, Europe | Short term (2 years or less) |
| Microservices and Cloud-Native Architecture Proliferation | +1.9% | North America, Asia Pacific | Medium term (2 to 4 years) |
| Open Banking and Embedded Finance API Expansion | +1.4% | Europe, Asia Pacific, Latin America | Medium term (2 to 4 years) |
| Platform Consolidation by Large Security Vendors | +1.1% | North America, Israel, Europe | Short term (2 years or less) |
Surge in API-Targeted Attacks and Breaches
APIs have become the main attack surface for digital businesses. Industry breach surveys run with the Ponemon Institute across 1,548 respondents in more than 100 countries show that 57% of organizations suffered an API-related data breach in the past two years. Of those, 73% had three or more incidents, and only 21% said they could reliably detect attacks at the API layer.
The pressure kept rising through 2025. Akamai’s State of the Internet telemetry reports that the average number of daily API attacks per organization rose 113% year over year, and 87% of surveyed organizations had an API-related incident.
Salt Security’s enterprise disclosures add that 99% of organizations ran into API security problems, 34% of those problems involved sensitive data exposure, and 55% of organizations delayed application rollouts because of them.
Restraints
| Restraint | (~) % Impact on CAGR Forecast | Geographic Relevance | Impact Timeline |
|---|---|---|---|
| Frozen Discretionary Security Budgets in Mid-Market | -1.6% | Global, Emerging Markets | Short term (2 years or less) |
| Data Residency and Sovereignty Procurement Bans | -1.1% | Europe, China, India, Middle East | Medium term (2 to 4 years) |
| Bundling Into Existing WAAP and CDN Contracts | -0.9% | North America, Europe | Short term (2 years or less) |
| Elevated Cost of Capital for Venture-Backed Vendors | -0.7% | North America, Israel | Short term (2 years or less) |
| Legacy Mainframe and Monolith API Incompatibility | -0.5% | Global BFSI and Public Sector | Long term (4 years or more) |
Frozen Discretionary Security Budgets in Mid-Market
The root cause is still high interest rates. Federal Reserve and RBI policy rate data show rates holding well above pre-2022 levels, which tightens operating budgets at mid-sized firms. IMF World Economic Outlook projections of global growth near 3% have pushed CFOs to treat standalone API security as optional spending rather than mandated spending.
This shows up as a measurable bottleneck in sales. Earnings calls from listed cybersecurity vendors describe deal-cycle lengthening of roughly 20–30% and more multi-signatory approvals for new line items. Mid-market renewals are often cut by 10–15% through narrower API inventory coverage.
The commercial result is direct revenue loss, not just slower growth. Vendors respond by discounting more heavily, which squeezes gross margins by around 3–5 percentage points. Customers, in turn, defer the CapEx tied to gateway modernization projects.
Challenges
| Challenge | (~) % CAGR Friction Drag | Geographic Relevance | Mitigation Horizon |
|---|---|---|---|
| Shadow and Zombie API Sprawl | -1.4% | Global | Medium term (2 to 4 years) |
| API Security Talent Shortage | -1.2% | Global, Asia Pacific | Long term (4 years or more) |
| Business Logic Attack Detection | -0.8% | North America, Europe | Medium term (2 to 4 years) |
| False Positive Alert Fatigue | -0.6% | Global | Short term (2 years or less) |
| Fragmented DevSecOps Toolchain Integration | -0.5% | North America, Europe | Medium term (2 to 4 years) |
Shadow and Zombie API Sprawl
The structural weakness is that APIs are created faster than anyone can govern them. CI/CD pipelines release new endpoints every week, while deprecated versions often stay live and reachable. CISA’s secure-by-design guidance names unmanaged interfaces as a recurring source of exposure.
Attack-surface assessments across about 10,000 organizations found that an average company exposes around 450 APIs. Roughly 38% of those are unknown to security teams, and 83% of organizations carry critical API vulnerabilities. OWASP’s API Security Top 10 lists improper inventory management as a core risk category for the same reason.
Opportunities
| Opportunity | (~) % Potential CAGR Upside | Geographic Relevance | Execution Window |
|---|---|---|---|
| Securing Agentic AI and LLM Tool-Calling APIs | +2.1% | North America, Europe, Asia Pacific | Short term (2 years or less) |
| API Security Bundled With Cyber Insurance Underwriting | +1.0% | North America, UK | Medium term (2 to 4 years) |
| Managed API Security Services for SMEs | +0.9% | India, Southeast Asia, Latin America | Medium term (2 to 4 years) |
| Public Digital Infrastructure and Government APIs | +0.8% | India, Middle East, Africa | Long term (4 years or more) |
| Connected Vehicle and IoT API Protection | +0.6% | Europe, Japan, China | Long term (4 years or more) |
Securing Agentic AI and LLM Tool-Calling APIs
This is still white space, not a current driver. Autonomous AI agents call APIs at machine speed using delegated credentials, and today’s API security products were built to analyze human-driven traffic. NIST’s AI Risk Management Framework and the EU AI Act timelines already recognize this agent-to-API risk, but no dedicated control category exists yet.
Early product moves point the way. A10 Networks acquired ThreatX Protect’s WAAP assets specifically to cover AI-driven use cases, and CrowdStrike’s 2025 acquisition of Pangea for about $260 million brought AI-focused API guardrails onto a larger platform.
Vendors that build agent identity, prompt-to-API policy enforcement, and token-level traffic metering could charge per agent or per inference call. That model could add 15–25% to average contract value. Automated policy generation could also lower the cost of protecting each API by about 30%, lifting gross margins toward 80%+, a level consistent with SEC filings from pure-play SaaS security vendors.
Key Players Analysis
Tier 1 leaders combine large revenue with broad platforms. Palo Alto Networks posted fiscal 2025 revenue of USD 9.2 billion, up 15%, and spent USD 1.98 billion on R&D, about 21.5% of revenue. It then closed its USD 25 billion purchase of CyberArk in February 2026 to add identity security for AI agents.
Akamai earned USD 4.21 billion in 2025, with security revenue of USD 2.243 billion, up 10%. Its Guardicore Segmentation and API Security line reached USD 293 million, up 43%, helped by its 2024 Noname Security deal. Google closed its USD 32 billion all-cash purchase of Wiz in March 2026, the largest deal in its history. This strengthens its cloud and Apigee API security offer.
Cloudflare, F5, Fortinet, and Broadcom also sit in Tier 1 through their gateway, WAF, and edge networks. F5 paid about USD 180 million for CalypsoAI in 2025 to secure AI traffic.
Tier 2 challengers focus on API-specific tools. Salt Security, Traceable, Wallarm, 42Crunch, Data Theorem, and Cequence Security lead in API discovery, posture management, and runtime protection. Imperva, now part of Thales, and Axway hold strong positions in banking and API management. These firms win deals through deep API testing and fast deployment, especially among mid-sized buyers.
Top Key Players in the Market
- Salt Security
- Akamai Technologies
- Imperva
- Traceable
- Data Theorem
- Axway
- Palo Alto Networks
- Fortinet
- Wallarm
- 42Crunch
- Cequence Security
- Cloudflare
- F5
- Broadcom
Recent Developments
- In March 2025, Google agreed to acquire cloud security firm Wiz for USD 32 billion in cash and completed the deal in March 2026.
- In July 2025, Palo Alto Networks announced its USD 25 billion acquisition of CyberArk, paying USD 45.00 in cash plus 2.2005 shares per CyberArk share, and closed it in February 2026.
- In September 2025, F5 agreed to acquire CalypsoAI for about USD 180 million to protect AI and API traffic.
- In February 2026, Akamai reported 2025 Guardicore Segmentation and API Security revenue of USD 293 million, up 43% year over year.
Report Scope
| Report Features | Description |
|---|---|
| Market Value (2025) | USD 4.0 Billion |
| Forecast Revenue (2035) | USD 27.9 Billion |
| CAGR (2026-2035) | 21.8% |
| Base Year for Estimation | 2025 |
| Historic Period | 2020-2024 |
| Forecast Period | 2026-2035 |
| Report Coverage | Revenue Forecast, Market Dynamics, Competitive Landscape, Recent Developments |
| Segments Covered | By Component (Solutions, Services); By Deployment Mode (Cloud-Based, On-Premises, Hybrid); By Organization Size (Small and Medium-Sized Enterprises (SMEs), Large Enterprises); By Security Type (API Authentication and Authorization, API Threat Detection and Prevention, API Monitoring and Analytics, API Vulnerability Management, API Compliance and Governance); By Application (Web APIs, Mobile APIs, Third-Party APIs, Partner APIs, Internal APIs); By End-Use Industry (Banking, Financial Services, and Insurance (BFSI), IT and Telecommunications, Healthcare, Government and Public Sector, Retail and E-commerce, Manufacturing, Others) |
| Regional Analysis | North America – US, Canada; Europe – Germany, France, The UK, Spain, Italy, Rest of Europe; Asia Pacific – China, Japan, South Korea, India, Australia, Singapore, Rest of APAC; Latin America – Brazil, Mexico, Rest of Latin America; Middle East & Africa – GCC, South Africa, Rest of MEA |
| Competitive Landscape | Google, Salt Security, Akamai Technologies, Imperva, Traceable, Data Theorem, Axway, Palo Alto Networks, Fortinet, Wallarm, 42Crunch, Cequence Security, Cloudflare, F5, Broadcom |
| Customization Scope | We will provide customization for segments and region/country levels. Moreover, additional customization can be done based on the requirements. |
| Purchase Options | We have three licenses to opt for: Single User License, Multi-User License (Up to 5 Users), Corporate Use License (Unlimited Users and Printable PDF) |