Report Overview
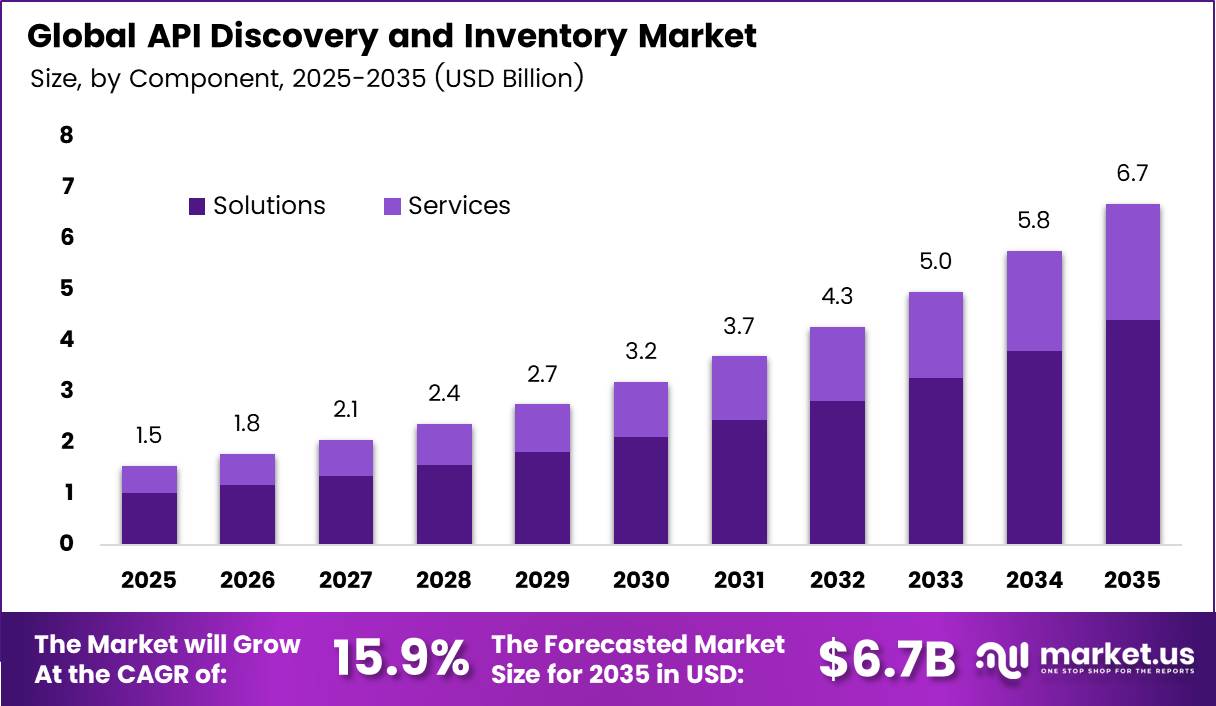
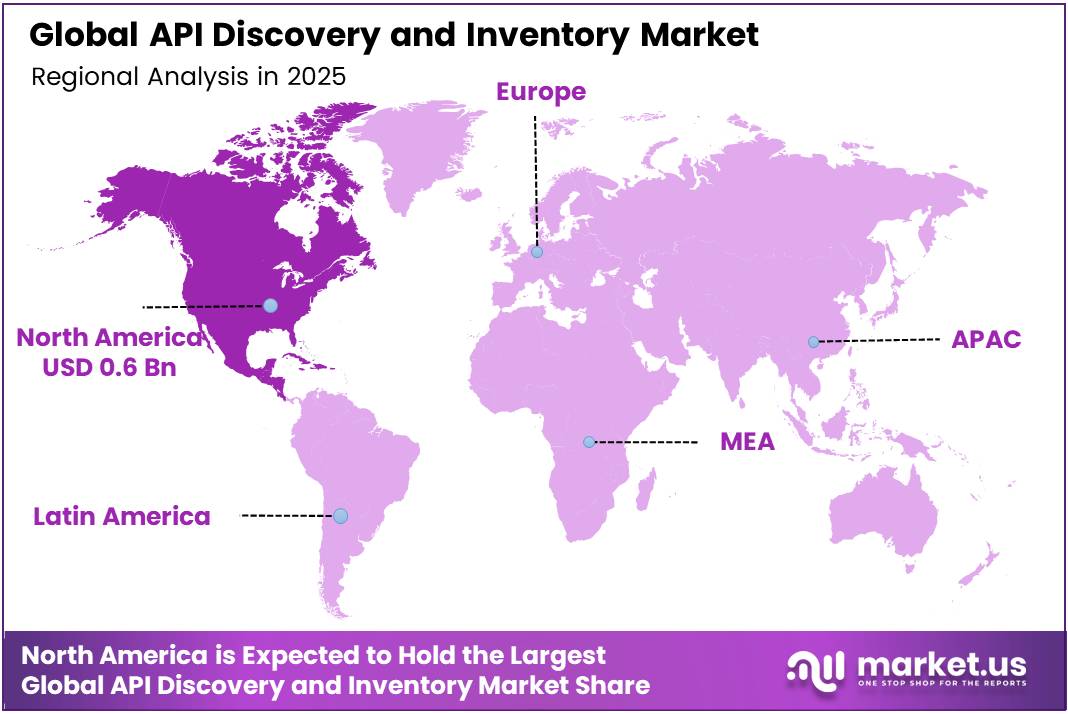
In 2025, the Global API Discovery And Inventory Market was valued at USD 1.5 billion. The market is projected to grow at a CAGR of 15.9% during 2026–2035, reaching approximately USD 6.7 billion by 2035. North America dominated the global market in 2025, accounting for more than 39.0% of the total market share and generating approximately USD 0.6 billion in revenue.
Growth comes from the fast rise of digital services that run on APIs. According to the ITU, about 6 billion people are online in 2025. Every app, payment, and cloud task they use calls many APIs in the background. The IEA reported that data centres used about 415 TWh of electricity in 2024, or 1.5% of global power use.
That demand grew 12% per year over five years, and the IEA expects it to reach about 945 TWh by 2030. More servers and cloud workloads create more APIs, and many of them go untracked. Firms buy discovery tools to find these APIs, list them, and close gaps before attackers find them.
The North America region holds the largest base of cloud and data centre capacity. The IEA estimates that the United States used about 45% of global data centre electricity in 2024. Local vendors also drive demand. Akamai reported that its Security Technology Group earned USD 592.4 million in the fourth quarter of 2025, up 11% year over year, helped by strong traction in API security.
Key Takeaways
- The global API Discovery And Inventory Market reached USD 1.5 billion in 2025 and will hit USD 6.7 billion by 2035. at a CAGR of 15.9% from 2026 to 2035.
- By Component, Solutions lead with a 70.0% share.
- By Deployment Mode, Cloud-Based leads with a 56.0% share.
- By Discovery Method, Automated API Discovery leads with a 46.0% share.
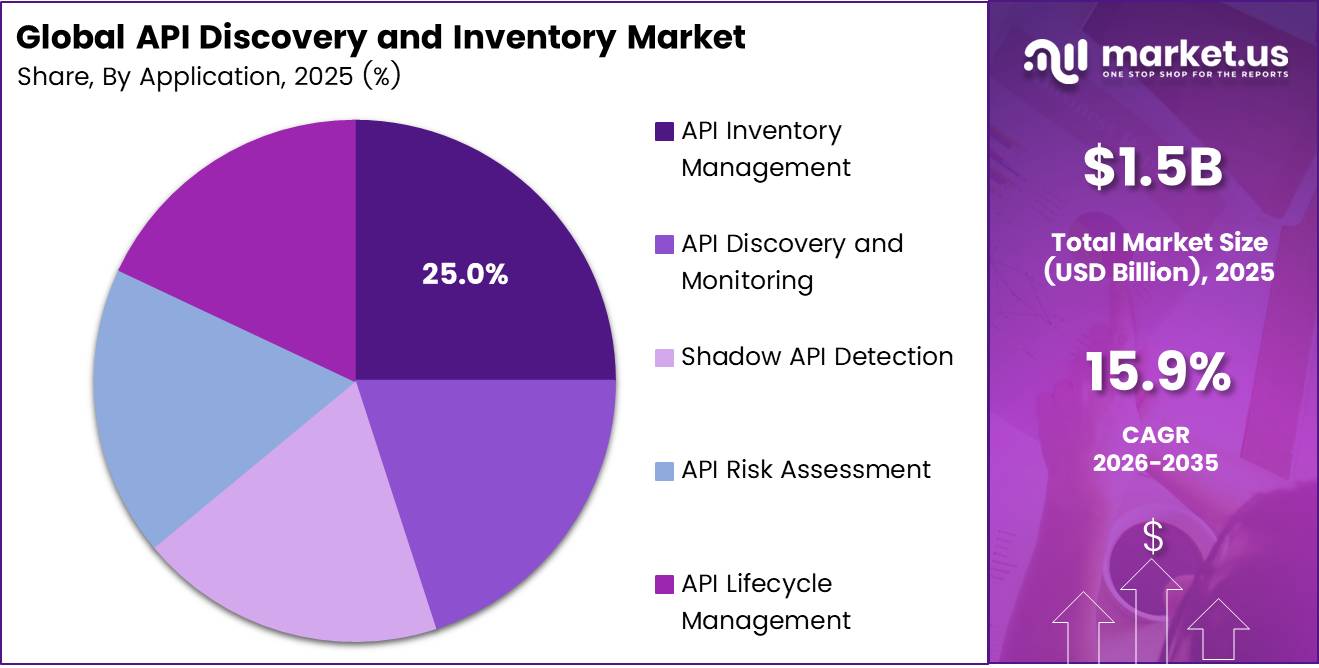
- By Application, API Inventory Management leads with a 25.0% share.
- By End-Use Industry, BFSI leads with a 24.0% share.
- North America dominates with a 39.0% share and USD 0.6 billion in revenue.
By Component
Solutions dominate with 70.0% due to ready platforms finding hidden endpoints fast.
Solutions hold the largest share because companies want one tool that finds, lists, and checks every API without manual work. The threat level makes this urgent. Akamai saw more than 311 billion web application and API attacks in 2024, a 33% rise over the year before.
Security teams cannot track that volume by hand, so they buy software that scans traffic all the time. API traffic is also very large. Cloudflare reports that APIs make up 57% of the dynamic internet traffic it handles. That volume pushes buyers toward platforms with built-in dashboards, alerts, and automatic tagging.
By Deployment Mode
Cloud-Based dominates with 56.0% due to quick setup with no hardware.
Cloud-based tools lead because most new APIs now run in public clouds, so buyers want discovery tools hosted in the same place. Businesses keep moving to the cloud. Eurostat reported that 45.2% of EU enterprises bought cloud computing services in 2023. Cloud tools start fast, update on their own, and grow with traffic without new servers.
Attack growth also favors flexible capacity. Akamai’s monthly web attack counts grew from almost 14 billion in early 2023 to more than 29 billion by October 2024. Cloud platforms can absorb these spikes and scan more traffic when needed.
By Discovery Method
Automated API Discovery dominates with 46.0% due to machine learning finding undocumented endpoints.
Automated discovery leads because manual lists miss many live APIs. Cloudflare’s machine learning found about 31% more API endpoints than companies had listed themselves. Automated tools watch real traffic and add new endpoints right away, so buyers get a complete inventory without waiting on developers.
Industry guidance also supports this method. The OWASP API Security Top 10 ranks Improper Inventory Management as risk number 9 (API9), which covers shadow and outdated endpoints. Security leaders use this list to plan budgets, which pushes them toward tools that update inventories without manual effort.
By Application
API Inventory Management dominates with 25.0% due to compliance audits requiring complete API records.
API inventory management leads because every other security task starts with a full list of APIs. Auditors, regulators, and boards now ask firms to show which APIs exist, who owns them, and what data they carry. Akamai counted 150 billion API attacks across 2023 and 2024. That scale makes a clean record the first purchase for most security teams.
Exposure differs by region, which adds to inventory demand. In EMEA, 37% of 116 billion web attacks targeted APIs. In North America, 29% of 327 billion attacks hit APIs. Global firms need region-level inventories to manage these different risks.
By End-Use Industry
BFSI dominates with 24.0% due to open banking driving heavy API use.
BFSI leads because banks, insurers, and payment firms link with fintech partners almost entirely through APIs. Digital finance keeps growing. The IMF’s 2025 Financial Access Survey tracks digital financial services in 163 countries and shows mobile and internet banking spreading fast.
Each new service adds APIs that need to be found and tracked. Attackers also go after finance. Financial services ranked as the third most targeted industry for API attacks at 15%, behind other digital media at 22% and commerce at 18%. Strict rules on financial data push these firms to buy full inventory tools.
Key Market Segments
By Component
- Solutions
- Services
By Deployment Mode
- Cloud-Based
- On-Premises
- Hybrid
By Discovery Method
- Automated API Discovery
- Agent-Based Discovery
- Network-Based Discovery
- Gateway-Based Discovery
By Application
- API Inventory Management
- API Discovery and Monitoring
- Shadow API Detection
- API Risk Assessment
- API Lifecycle Management
By End-Use Industry
- Banking, Financial Services, and Insurance (BFSI)
- IT and Telecommunications
- Healthcare
- Retail and E-commerce
- Government and Public Sector
Geopolitical Impact Analysis
API discovery runs as software, but it depends on physical hardware. Network sensors, gateway appliances, servers, and GPUs all ship through global trade lanes. The WTO cut its 2026 world merchandise trade volume growth forecast to 0.5%, down from 1.8%. It cited the delayed effect of tariffs. In late 2025, the United States announced 100% duties on Chinese imports after China tightened export controls on rare earth metals. These metals go into chips and storage drives.
The WTO found that world merchandise trade volume grew 4.9% in the first half of 2025, as North American buyers rushed to import AI goods ahead of tariff hikes. That rush lifted short-term hardware stocks. It also raised input prices once inventories ran down. Vendors that sell on-premises and network-based discovery appliances now face higher landed costs. Many pass these costs on through yearly license price increases.
Shipping risks add delays. UNCTAD reported that by May 2025, tonnage moving through the Suez Canal stayed about 70% below 2023 levels. UNCTAD also showed that a round trip between India and Europe can stretch from 56 to 63 days when ships take longer routes. That adds about 7 days to server and appliance deliveries for European and Indian data centre projects.
Rerouting raised global container ship demand by 12%, according to UNCTAD. UNCTAD also warned that higher freight rates could lift global consumer prices by 0.6%. Higher costs push buyers toward cloud-based discovery, which needs no imported hardware. This shift supports the cloud segment’s lead and speeds up the move to software-only, agentless tools.
Regional Analysis
North America dominates the API Discovery and Inventory Market, holding a 39.0% share and generating USD 0.6 billion in revenue. The US drives most of this demand. It hosts the head offices of top vendors such as Akamai, Salt Security, Cequence Security, Google, Microsoft, IBM, and Kong.
Canada adds growth through its banking and telecom sectors, where open banking plans push lenders to expose more APIs to partners. Strong venture funding also helps the region. Harness and Traceable expected more than USD 250 million in annual recurring revenue in 2025, growing over 50% year over year. This shows how fast buyers in the region adopt API security tools.
Asia Pacific stands as the fastest-growing region in the API Discovery and Inventory Market. India’s UPI system processed over 200 billion transactions in 2025, and each one runs on APIs. China has about 1.1 billion internet users, which creates huge app and API volumes. Japan and South Korea invest in cloud migration for banks and telecom firms.
Europe holds the second largest position, led by Germany, the UK, and France. The EU Digital Operational Resilience Act took effect on 17 January 2025. It requires banks and insurers to map their ICT assets, including APIs. GDPR fines can reach 4% of global yearly turnover, so firms work hard to find APIs that leak personal data. Open banking under PSD2 has created thousands of bank APIs across the region.
Key Regions and Countries
North America
- US
- Canada
Europe
- Germany
- France
- The UK
- Spain
- Italy
- Rest of Europe
Asia Pacific
- China
- Japan
- South Korea
- India
- Australia
- Rest of APAC
Latin America
- Brazil
- Mexico
- Rest of Latin America
Middle East and Africa
- GCC
- South Africa
- Rest of MEA
Market Dynamics
Drivers
| Driver | (~) % Impact on CAGR Forecast | Geographic Relevance | Impact Timeline |
|---|---|---|---|
| Shadow and Zombie API Proliferation | +3.2% | Global | Short term (2 years or less) |
| Generative AI Agent API Traffic Surge | +2.6% | North America, Europe, Asia Pacific | Short term (2 years or less) |
| PCI DSS v4.0 API Inventory Mandates | +1.8% | Global | Short term (2 years or less) |
| EU DORA and NIS2 ICT Asset Registers | +1.5% | Europe | Medium term (2 to 4 years) |
| Microservices and Kubernetes Sprawl | +1.2% | North America, Asia Pacific | Medium term (2 to 4 years) |
| Open Banking API Expansion | +0.9% | Europe, India, Brazil, Australia | Medium term (2 to 4 years) |
Shadow and Zombie API Proliferation
The underlying cause is speed: development teams now push API endpoints much faster than security teams can register them. Per OWASP’s API Security Top 10 (2023), Improper Inventory Management (API9) is a top risk category.
Akamai’s State of the Internet telemetry shows API calls at about 83% of web traffic, and Cloudflare’s API security reporting found that close to 31% of discovered API endpoints were shadow endpoints that customers had never declared.
The CISA and FBI advisories that followed the T-Mobile breach of about 37 million accounts in 2023 and the Optus breach of roughly 9.8 million records showed how exposure from a single unauthenticated endpoint can trigger regulatory penalties in the hundreds of millions.
Annual recurring revenue (ARR) disclosures in Akamai’s and F5’s earnings calls through 2025 show the API security lines growing faster than the core segments. Because discovery-led deployments come with proof-of-value pilots, vendors report sales cycles about 30–40% shorter and customer acquisition costs that pay back within 12–18 months.
Restraints
| Restraint | (~) % Impact on CAGR Forecast | Geographic Relevance | Impact Timeline |
|---|---|---|---|
| Security Budget Consolidation Freezes | -1.9% | North America, Europe | Short term (2 years or less) |
| Platform Bundling by Cloud Hyperscalers | -1.4% | Global | Short term (2 years or less) |
| Data Localization Traffic Inspection Limits | -0.9% | China, India, Middle East, Europe | Medium term (2 to 4 years) |
| Elevated Cost of Venture Capital | -0.7% | North America, Israel | Short term (2 years or less) |
| Legacy On-Premises Gateway Lock-In | -0.6% | Europe, Asia Pacific, Latin America | Medium term (2 to 4 years) |
Security Budget Consolidation Freezes
The constraint comes from finance departments. With policy rates held above 4% through much of 2024–2025 per Federal Reserve and ECB rate decisions, CFOs have pushed to cut point-tool licenses, and the IANS Research CISO compensation and budget benchmarks indicate security budget growth slowing to about 4% from 17% in 2022.
Buyers increasingly expect API inventory to come as a module within a CNAPP or SASE platform, a trend Palo Alto Networks described as “platformization” on its earnings calls, alongside free or discounted bundling worth up to 12–24 months of license value.
The bottleneck shows up as procurement sign-off: standalone discovery deals now need three or more approval layers and close 3–6 months later than before. For pure-play vendors, this means gross margins squeezed from about 80% toward 70–72% as discounting grows, net revenue retention down by an estimated 8–10 percentage points (as visible in listed peers’ SEC 10-K filings), and planned capital spending on regional data planes pushed back.
Challenges
| Challenge | (~) % CAGR Friction Drag | Geographic Relevance | Mitigation Horizon |
|---|---|---|---|
| API Security Talent Deficit | -1.6% | Global | Long term (4 years or more) |
| Encrypted East-West Traffic Visibility | -1.1% | North America, Europe, Asia Pacific | Medium term (2 to 4 years) |
| Alert Fatigue From False Positives | -0.8% | Global | Medium term (2 to 4 years) |
| Fragmented API Specification Standards | -0.6% | Global | Medium term (2 to 4 years) |
| Multicloud Telemetry Integration Costs | -0.5% | North America, Europe | Short term (2 years or less) |
API Security Talent Deficit
Few organizations can actually run API discovery tools well, because they need staff who understand both application development and runtime security. The ISC2 Cybersecurity Workforce Study estimates the global workforce gap at about 4.8 million professionals, and NASSCOM skills assessments point to a domestic deficit of more than 800,000 cybersecurity roles in India’s application-security pipeline.
The friction is measurable: per CompTIA hiring data, qualified API security engineers command salary premiums of 20–30% and take more than 90 days to hire, so discovery deployments often stall at the triage stage. Many buyers end up using under 50% of the features they license, which pushes up churn risk at renewal.
Over the long term, vendors will need to shift toward managed detection services, AI-driven automatic classification, and certification partnerships with bodies such as SANS and EC-Council. Customer success headcount is likely to rise to about 15–18% of operating expenses.
Opportunities
| Opportunity | (~) % Potential CAGR Upside | Geographic Relevance | Execution Window |
|---|---|---|---|
| MCP and AI Agent Endpoint Governance | +2.4% | Global | Short term (2 years or less) |
| Mid-Market and SMB Managed Discovery | +1.5% | India, Southeast Asia, Latin America | Medium term (2 to 4 years) |
| Third-Party API Supply Chain Risk Scoring | +1.2% | North America, Europe | Medium term (2 to 4 years) |
| Cyber Insurance Underwriting Data Feeds | +0.9% | North America, United Kingdom | Medium term (2 to 4 years) |
| Operational Technology and IoT API Inventory | +0.8% | Europe, Asia Pacific, Middle East | Long term (4 years or more) |
| Pure-Play Vendor M&A Roll-Ups | +0.6% | North America, Israel | Short term (2 years or less) |
MCP and AI Agent Endpoint Governance
This item is separate from the AI traffic driver above. That driver covers how much agent-generated API traffic is already moving through existing gateways. This opportunity is the governance layer for Model Context Protocol (MCP) servers and agent tool endpoints, which almost no one sells yet.
Vendors that add agent-identity mapping can charge premium add-on SKUs at an estimated 25–40% uplift over base per-endpoint pricing. Because this capability builds on existing traffic sensors, incremental gross margin could reach 85%, and the inventory cost per endpoint could fall by about 30% through automated schema inference.
Key Players Analysis
Tier 1 leaders combine global reach with deep balance sheets. Akamai Technologies reported total 2025 revenue of USD 4.21 billion, up 5.4%, in its Form 10-K. Its security revenue grew 10% to USD 2.24 billion, and its cloud computing revenue grew 12% to USD 708 million. Akamai spent USD 513.6 million on R&D in 2025, up 9.1% from USD 470.9 million. The Noname Security deal sits inside this API security spending.
IBM expanded its hybrid cloud and API lifecycle stack through large deals. It paid USD 35 per share in cash for HashiCorp, an enterprise value of USD 6.4 billion. IBM then agreed to buy Confluent for about USD 11 billion, adding real-time data streaming. Google Apigee and Microsoft build discovery into their cloud gateways and reach millions of cloud customers.
Tier 2 challengers win through focus. Traceable merged with Harness, forming a company valued at about USD 5 billion with about 1,100 employees. The combined firm targets more than USD 250 million in annual recurring revenue for 2025. Salt Security, Cequence Security, 42Crunch, and Data Theorem compete on shadow API detection and testing.
Imperva, owned by Thales, and Axway serve large regulated buyers in Europe. Kong competes through its open-source gateway. Gateway-based discovery gives Kong, Axway, and Apigee a natural place to build inventory features. Pure-play vendors answer with agentless, AI-driven discovery that works across every gateway.
Top Key Players in the Market
- Akamai Technologies
- Salt Security
- 42Crunch
- Cequence Security
- Traceable
- Data Theorem
- Imperva
- Axway
- Google Apigee
- IBM
- Microsoft
- Kong
Recent Developments
- In February 2026, Akamai Technologies filed its 2025 annual report. It showed security revenue of USD 2.24 billion, driven by API security and segmentation demand.
- In February 2025, IBM completed its acquisition of HashiCorp for USD 35 per share in cash, an enterprise value of USD 6.4 billion.
- In March 2025, Harness completed its merger with Traceable. The merger formed an AI-native DevSecOps and API security platform valued at about USD 5 billion.
- In December 2025, IBM agreed to acquire Confluent for about USD 11 billion to strengthen its real-time data and API integration portfolio.
- In December 2025, Harness, the owner of Traceable, closed a USD 240 million funding round to expand its AI security and API protection platform.
Report Scope
| Report Features | Description |
|---|---|
| Market Value (2025) | USD 1.5 Billion |
| Forecast Revenue (2035) | USD 6.7 Billion |
| CAGR (2026-2035) | 15.9% |
| Base Year for Estimation | 2025 |
| Historic Period | 2020-2024 |
| Forecast Period | 2026-2035 |
| Report Coverage | Revenue Forecast, Market Dynamics, Competitive Landscape, Recent Developments |
| Segments Covered | By Component (Solutions, Services); By Deployment Mode (Cloud-Based, On-Premises, Hybrid); By Discovery Method (Automated API Discovery, Agent-Based Discovery, Network-Based Discovery, Gateway-Based Discovery); By Application (API Inventory Management, API Discovery and Monitoring, Shadow API Detection, API Risk Assessment, API Lifecycle Management); By End-Use Industry (Banking, Financial Services, and Insurance (BFSI), IT and Telecommunications, Healthcare, Retail and E-commerce, Government and Public Sector) |
| Regional Analysis | North America – US, Canada; Europe – Germany, France, The UK, Spain, Italy, Rest of Europe; Asia Pacific – China, Japan, South Korea, India, Australia, Singapore, Rest of APAC; Latin America – Brazil, Mexico, Rest of Latin America; Middle East & Africa – GCC, South Africa, Rest of MEA |
| Competitive Landscape | Akamai Technologies, Salt Security, 42Crunch, Cequence Security, Traceable, Data Theorem, Imperva, Axway, Google Apigee, IBM, Microsoft, Kong |
| Customization Scope | We will provide customization for segments and region/country levels. Moreover, additional customization can be done based on the requirements. |
| Purchase Options | We have three licenses to opt for: Single User License, Multi-User License (Up to 5 Users), Corporate Use License (Unlimited Users and Printable PDF) |