Report Overview
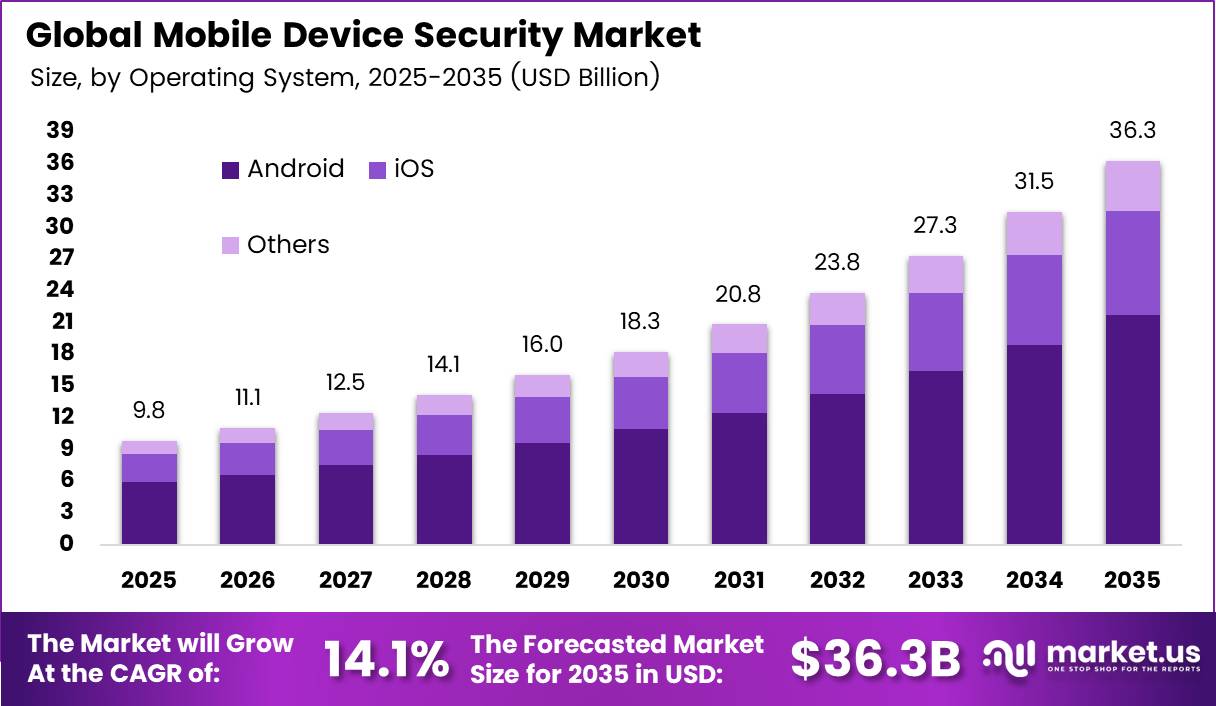
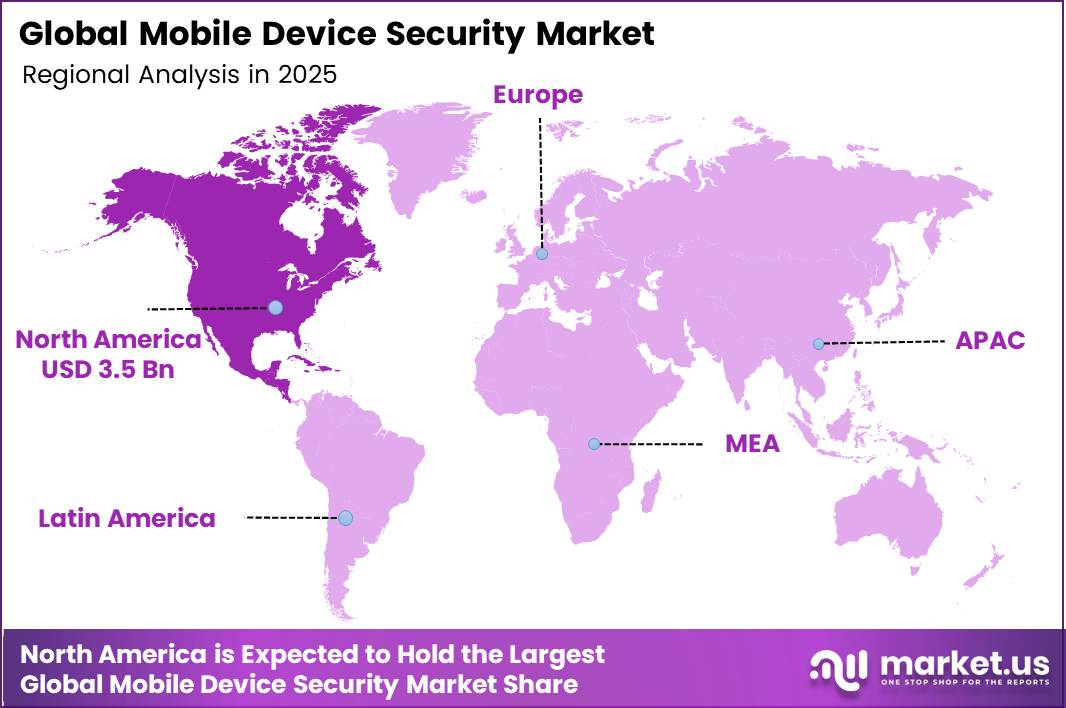
In 2025, the Global Mobile Device Security Market was valued at USD 9.8 billion. The market is projected to grow at a CAGR of 14.1% during 2026–2035, reaching approximately USD 36.3 billion by 2035. North America dominated the global market in 2025, accounting for more than 34.6% of the total market share and generating approximately USD 3.5 billion in revenue.
The main driver is the huge number of connected devices. According to the ITU, the world had 9.2 billion mobile cellular subscriptions in 2025, or 112 for every 100 people. Mobile broadband now makes up 89% of all mobile subscriptions, up from less than 50% in 2015.
Each new device opens a new door for attackers. The FBI reported a record USD 16.6 billion in cybercrime losses in 2024, a 33% jump over 2023. Phishing, extortion, and data breaches topped the complaint list. Banks, insurers, and other firms now run payments, logins, and customer data through phones.
The North America region pairs high device use with high spending power. GSMA Intelligence reports that about 320 million people in North America use the mobile internet, and 60% of them connect through 5G networks. Mobile technology also produced USD 1.9 trillion in economic value across the region in 2025, equal to 5.8% of regional GDP. This large mobile economy makes devices a prime target.
Key Takeaways
- The Mobile Device Security Market stood at USD 9.8 billion in 2025 and will reach USD 36.3 billion by 2035. at a CAGR of 14.1% during 2026-2035.
- By Component, Solutions led with a 75.0% share.
- By Operating System, Android led with an 81.4% share.
- By Deployment Mode, Cloud-Based led with a 67.3% share.
- By Organization Size, Large Enterprises led with a 68.0% share.
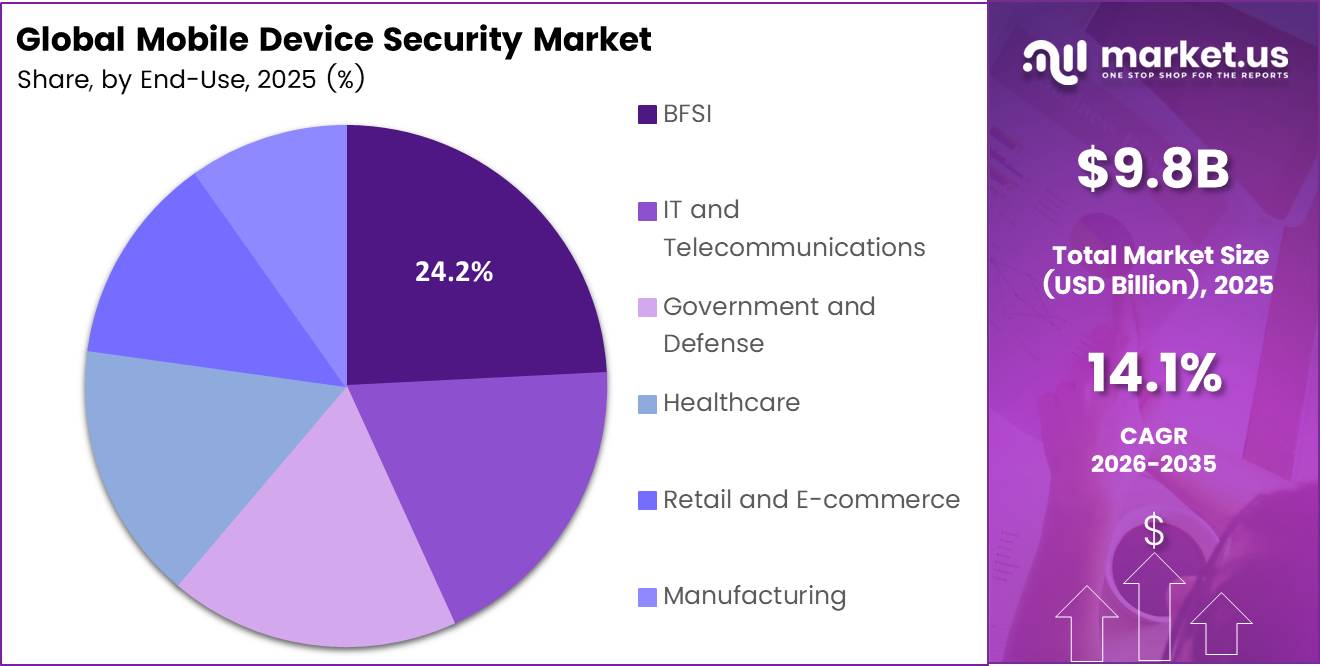
- By End-Use Industry, BFSI led with a 24.2% share.
- North America led the market with a 36.0% share and USD 3.5 billion in revenue.
By Component
Solutions dominate with 75.0% due to built-in threat defense on every device.
Solutions hold the largest share because firms want tools that guard phones the moment staff logs in. Verizon’s 2025 Mobile Security Index shows that 89% of organizations now keep a dedicated mobile security budget. Most of that money goes to software such as device management, mobile threat defense, and secure access tools, since these products give IT teams one place to set rules and block attacks.
Spending keeps rising as well. The same survey finds that 75% of organizations raised mobile security spending in the past year. Buyers pick packaged solutions first because they install fast, grow with the device fleet, and show clear results to leadership.
Services are growing fastest because many firms lack the skills to fight new AI-driven threats on their own. Only 17% of organizations have controls built for AI-assisted attacks, and just 12% protect against deepfakes. This gap pushes companies toward managed security, consulting, and training partners who can close weak spots quickly.
By Operating System
Android dominates with 81.4% due to a huge low-cost handset base worldwide.
Android leads because it runs on most of the world’s phones, especially low- and mid-priced models across Asia, Africa, and Latin America. ITU counts 9.2 billion mobile-cellular subscriptions in 2025, or 112 for every 100 people. A large share of these lines run on Android hardware from many brands.
iOS is growing fastest as Apple’s installed base keeps expanding inside companies. Apple reported more than 2.35 billion active devices, up about 150 million in one year. Many executives and sales teams carry iPhones, and these users often handle the most sensitive data.
By Deployment Mode
Cloud-Based dominates with 67.3% due to remote policy control for distributed workforces.
Cloud-based tools lead because staff now work from home, client sites, and on the road. A cloud console lets IT teams push security rules to any phone, anywhere, without extra servers. Faster networks support this model. ITU reports that 5G now covers 55% of the world’s population and makes up 36% of all mobile broadband subscriptions.
The cloud segment is also growing fastest because new risks change too quickly for on-site systems to keep up. Verizon reports that 93% of organizations say employees use generative AI tools on their phones. That trend creates new data-leak paths every month. Cloud platforms can roll out AI-aware controls across all users in a single update.
By Organization Size
Large Enterprises dominate with 68.0% due to massive device fleets and compliance mandates.
Large enterprises lead because they manage thousands of phones across many offices and countries. Each device adds an entry point for attackers, so these firms buy full security stacks. Verizon found that 85% of organizations see mobile attacks rising, and this trend holds across company sizes and industries.
The cost of failure is also climbing. The share of firms facing serious damage from downtime reached 63%, up from 47% a year earlier. Large companies have the budget and the board pressure to act on these risks first.
Small and medium enterprises (SMEs) are growing fastest because their staff relies heavily on personal phones for work. Verizon reports that 70% of devices hit by an attack were personal, not company-issued. SMEs often run bring-your-own-device setups with little IT support, which leaves gaps that criminals target.
By End-Use Industry
Banking, Financial Services, and Insurance (BFSI) dominates with 24.2% due to mobile banking fraud and regulations.
BFSI leads because banks and insurers move money and personal data through mobile apps every second. A single breach can bring fines and lost trust. Among organizations hit by mobile incidents, 40% paid financial penalties, and 22% faced regulatory action.
Healthcare is the fastest-growing industry as hospitals and clinics adopt phones and tablets for patient records and care teams. Medical data sells for high prices, and staff often click links under time pressure. Verizon finds that 80% of organizations saw mobile phishing aimed at employees. In addition, 64% rank leaks from staff typing sensitive data into AI tools as their top mobile risk.
Key Market Segments
By Component
- Solutions
- Services
By Operating System
- Android
- iOS
- Others
By Deployment Mode
- Cloud-Based
- On-Premises
By Organization Size
- Large Enterprises
- Small and Medium Enterprises (SMEs)
By End-Use Industry
- Banking, Financial Services, and Insurance (BFSI)
- IT and Telecommunications
- Government and Defense
- Healthcare
- Retail and E-commerce
- Manufacturing
- Others
Geopolitical Impact Analysis
Trade policy now shapes the cost of the hardware that mobile security runs on. The WTO first projected a 0.2% drop in world merchandise trade volume for 2025 after US tariff moves. It warned that reciprocal tariffs and policy uncertainty could push the decline to 1.5%. These shocks hit phones, chips, and secure hardware tokens, since most of them cross several borders before they reach buyers.
Trade then held up better than feared. The WTO raised its 2025 trade volume growth forecast to 2.4%, up from 0.9% in August. First half 2025 trade rose 4.9% as firms rushed orders ahead of new tariffs. That stockpiling helped device makers, but the WTO expects the full tariff impact to land in 2026.
Shipping routes add another cost layer. UNCTAD found that ships rerouting around the Cape of Good Hope add about 12 days to an Asia-to-Europe trip. That equals a roughly 30% rise in transit time. Most phones and secure chips ship from Asia, so these delays slow device rollouts in Europe and push up landed costs.
Software vendors feel these effects in a different way. Cloud-based security avoids physical shipping, but buyers still delay deals when device supply slips. Vendors respond by shifting to subscription pricing and regional data centers. This lowers their exposure to tariffs and keeps revenue steady when hardware trade swings.
Regional Analysis
North America dominates the Mobile Device Security Market, holding a 36.0% share and generating USD 3.5 billion in revenue. The US drives most of this demand. Large banks, insurers, health systems, and federal agencies all give staff phones that hold sensitive data. Each of these sectors faces strict rules on data privacy and breach reporting.
The FBI reported 859,532 cybercrime complaints in 2024, and each complaint showed an average loss of USD 19,372. Texas alone reported USD 1.35 billion in losses, a rise of USD 328 million over the prior year. Losses at this scale push boards to fund mobile protection. The region also hosts most leading vendors.
Asia Pacific has the largest pool of mobile users in the world. China, India, Japan, and South Korea lead adoption. The region reaches about 46 5G subscriptions per 100 people. India’s huge mobile payment base and Japan’s strict enterprise standards create strong demand.
Europe holds the second largest position, led by Germany, France, and the UK. Strict data rules force firms to protect personal data on every work phone. The ITU reports that more than four in ten mobile broadband subscriptions in Europe now run on 5G. Faster networks bring more cloud apps onto phones, and that widens the attack surface.
Key Regions and Countries
North America
- US
- Canada
Europe
- Germany
- France
- The UK
- Spain
- Italy
- Rest of Europe
Asia Pacific
- China
- Japan
- South Korea
- India
- Australia
- Rest of APAC
Latin America
- Brazil
- Mexico
- Rest of Latin America
Middle East and Africa
- GCC
- South Africa
- Rest of MEA
Market Dynamics
Drivers
| Driver | (~) % Impact on CAGR Forecast | Geographic Relevance | Impact Timeline |
|---|---|---|---|
| Surge in Mobile-Targeted Phishing and Malware | +3.2% | Global | Short term (2 years or less) |
| BYOD and Hybrid Work Endpoint Expansion | +2.6% | North America, Europe | Medium term (2 to 4 years) |
| Mobile Banking and UPI-Scale Payment Adoption | +2.3% | Asia Pacific, Latin America | Short term (2 years or less) |
| Zero Trust Mandates for Federal Agencies | +1.8% | North America | Medium term (2 to 4 years) |
| Data Protection Law Enforcement | +1.5% | Europe, India | Medium term (2 to 4 years) |
Surge in Mobile-Targeted Phishing and Malware
The root cause is a structural move by attackers toward the device people trust most. In 2024 and 2025, smishing, QR-code phishing (“quishing”), and banking trojans shifted toward mobile channels. Per FBI IC3 annual reporting, total reported cybercrime losses passed $16 billion in 2024, a year-on-year rise of about 33%.
CERT-In incident data likewise shows India’s reported incidents rising past 1.5 million annually, with mobile fraud making up a growing share. On the business side, as reflected in earnings calls of listed endpoint security vendors, buyers are moving away from perpetual per-device antivirus licenses toward bundled mobile threat defense subscriptions sold inside unified endpoint management and XDR platforms.
Those vendors report annual recurring revenue growth of roughly 20% to 30% in their mobile-attached modules. This approach cuts customer acquisition costs by an estimated 25% to 40% compared with direct consumer sales, and it lifts gross margins toward the 75% to 80% range that is typical of cloud-delivered SaaS.
Restraints
| Restraint | (~) % Impact on CAGR Forecast | Geographic Relevance | Impact Timeline |
|---|---|---|---|
| SMB Security Budget Constraints | -1.9% | Global | Short term (2 years or less) |
| OS-Native Security Cannibalization | -1.6% | Global | Medium term (2 to 4 years) |
| Employee Privacy Resistance to MDM Agents | -1.1% | Europe, North America | Short term (2 years or less) |
| Vendor Bans and Procurement Restrictions | -0.8% | North America, China | Short term (2 years or less) |
| Low Consumer Willingness to Pay | -0.7% | Asia Pacific, Africa | Medium term (2 to 4 years) |
SMB Security Budget Constraints
The root cause is tight credit and slower discretionary IT spending among small and mid-sized firms. As reflected in Federal Reserve and ECB policy rate data, policy rates stayed restrictive through much of 2024 and 2025, and per OECD SME finance monitoring, small-business loan rates sat about 200 to 300 basis points above pre-2022 levels.
Per U.S. Small Business Administration survey data, about 40% of small firms have no dedicated cybersecurity budget. Mobile security is often the first line item deferred, because per-seat costs of $4 to $12 per device per month add up quickly across mixed fleets.
The result is a hard stop on renewals and new seat deployments: mid-market contract cycles stretch by 60 to 90 days. Vendors are pushed into discounting of 15% to 20%, which compresses blended gross margins by about 3 to 5 percentage points, as reflected in SEC 10-K disclosures of listed security vendors.
Challenges
| Challenge | (~) % CAGR Friction Drag | Geographic Relevance | Mitigation Horizon |
|---|---|---|---|
| Cybersecurity Talent Shortage | -1.4% | Global | Long term (4 years or more) |
| Android Ecosystem Fragmentation | -1.0% | Asia Pacific, Africa | Medium term (2 to 4 years) |
| AI-Generated Evasive Threats | -0.9% | Global | Medium term (2 to 4 years) |
| Cross-Border Data Localization | -0.7% | India, Europe, China | Medium term (2 to 4 years) |
| False Positive Alert Fatigue | -0.5% | North America, Europe | Short term (2 years or less) |
Cybersecurity Talent Shortage
The structural weakness is a shortage of specialists who can run mobile threat defense, MDM policy, and incident response across mixed iOS and Android fleets. Per ISC2 workforce study data, the global cybersecurity workforce gap was about 4.8 million professionals in 2024, while workforce growth was close to 0%.
Per NASSCOM industry assessments, India alone faces a deficit of several hundred thousand skilled practitioners. Per U.S. Bureau of Labor Statistics wage data, information security analyst salaries rose about 4% to 6% a year. This friction stretches deployment timelines by 30% to 50% and keeps paid seats underused, so sales continue, but expansion revenue is capped.
To adjust over the long term, vendors are moving into managed mobile security services, automating triage with AI copilots that cut analyst handling time by an estimated 40%, and building certification programs with workforce agencies such as CISA and DSCI.
Opportunities
| Opportunity | (~) % Potential CAGR Upside | Geographic Relevance | Execution Window |
|---|---|---|---|
| Carrier-Embedded Security-as-a-Service Bundles | +2.1% | Asia Pacific, Latin America, Africa | Medium term (2 to 4 years) |
| Post-Quantum Cryptography on Mobile | +1.4% | North America, Europe | Long term (4 years or more) |
| Frontline and Rugged Device Security | +1.2% | Global | Medium term (2 to 4 years) |
| On-Device AI Privacy Protection | +1.0% | Global | Medium term (2 to 4 years) |
| Cyber Insurance-Linked Mobile Telemetry | +0.8% | North America, Europe | Long term (4 years or more) |
Carrier-Embedded Security-as-a-Service Bundles
This is still untapped. Unlike the bank and app channels already driving growth, network-level security bundled into prepaid and mobile-first SMB plans remains largely uncommercialized in emerging markets, where most users connect only through mobile.
Per GSMA Intelligence mobile economy data, unique mobile subscribers passed 5.8 billion worldwide, and most of the next connections will come from Asia Pacific and Sub-Saharan Africa. Per TRAI subscription data, India alone has more than 1.1 billion wireless subscribers. If carriers bill $0.30 to $1 per month through the subscription, distribution cost per user could fall by 60% to 70% compared with app-store sales.
Carrier filings, including Bharti Airtel investor decks, suggest that value-added services carry incremental margins above 50%. Vendors gain a sizable share of unmet demand at about 8 to 12 percentage points higher contribution margin, and churn drops by an estimated 20% because billing is bundled.
Key Players Analysis
Tier 1 market leaders include Microsoft, IBM, Check Point, Broadcom (Symantec), and Trend Micro. These firms sell mobile security as part of wider security platforms. Check Point shows the scale of this tier. It posted revenue of USD 2,565 million in 2024 and USD 2,725.4 million in 2025. Security subscriptions alone brought in USD 1,104.2 million in 2024, up from USD 981.2 million in 2023.
Tier 1 players also spend heavily on research. Check Point spent USD 395 million on R&D in 2024, equal to 15% of revenue, and raised GAAP R&D to USD 456.7 million in 2025. In 2025, it also agreed to buy Lakera, a Zurich AI security firm, in a deal worth about USD 300 million. This adds AI app protection to its mobile and endpoint lineup.
Tier 2 challengers include Jamf, Zimperium, Lookout, Ivanti, Sophos, Pradeo, McAfee, F-Secure, Appdome, and ThreatFabric. These firms win through deep focus on one area, such as Apple devices, mobile threat defense, or app shielding. Jamf leads in Apple device management. Francisco Partners took Jamf private for about USD 2.2 billion, or USD 13.05 per share, a premium of about 50%.
Niche players grow through alliances. Zimperium linked its mobile threat defense with Sekoia’s security operations platform in October 2026. Deals like this help smaller vendors reach large firms without building full platforms. Private equity buyouts like the Jamf deal also signal more consolidation among Tier 2 firms through 2035.
Top Key Players in the Market
- Microsoft Corporation
- IBM Corporation
- Zimperium, Inc.
- Lookout, Inc.
- Check Point Software Technologies Ltd.
- Ivanti
- Jamf Holding Corp.
- Trend Micro Incorporated
- Sophos
- Broadcom Inc. (Symantec)
- Pradeo
- McAfee, LLC
- F-Secure Corporation
- Appdome, Inc.
- ThreatFabric B.V.
Recent Developments
- In January 2026, Jamf completed its sale to Francisco Partners at USD 13.05 per share in cash, a total enterprise value of about USD 2.2 billion, after stockholders approved the deal on January 8.
- In September 2025, Check Point Software Technologies agreed to acquire Lakera in a deal valued at about USD 300 million to add end-to-end AI security.
Report Scope
| Report Features | Description |
|---|---|
| Market Value (2025) | USD 9.8 Billion |
| Forecast Revenue (2035) | USD 36.3 Billion |
| CAGR (2026-2035) | 14.1% |
| Base Year for Estimation | 2025 |
| Historic Period | 2020-2024 |
| Forecast Period | 2026-2035 |
| Report Coverage | Revenue Forecast, Market Dynamics, Competitive Landscape, Recent Developments |
| Segments Covered | By Component (Solutions, Services); By Operating System (Android, iOS, Others); By Deployment Mode (Cloud-Based, On-Premises); By Organization Size (Large Enterprises, Small and Medium Enterprises (SMEs)); By End-Use Industry (Banking, Financial Services, and Insurance (BFSI), IT and Telecommunications, Government and Defense, Healthcare, Retail and E-commerce, Manufacturing, Others) |
| Regional Analysis | North America – US, Canada; Europe – Germany, France, The UK, Spain, Italy, Rest of Europe; Asia Pacific – China, Japan, South Korea, India, Australia, Singapore, Rest of APAC; Latin America – Brazil, Mexico, Rest of Latin America; Middle East & Africa – GCC, South Africa, Rest of MEA |
| Competitive Landscape | Microsoft Corporation, IBM Corporation, Zimperium, Inc., Lookout, Inc., Check Point Software Technologies Ltd., Ivanti, Jamf Holding Corp., Trend Micro Incorporated, Sophos, Broadcom Inc. (Symantec), Pradeo, McAfee, LLC, F-Secure Corporation, Appdome, Inc., ThreatFabric B.V. |
| Customization Scope | Customization for segments, region/country-level will be provided. Moreover, additional customization can be done based on the requirements. |
| Purchase Options | We have three licenses to opt for: Single User License, Multi-User License (Up to 5 Users), Corporate Use License (Unlimited Users and Printable PDF) |