Report Overview
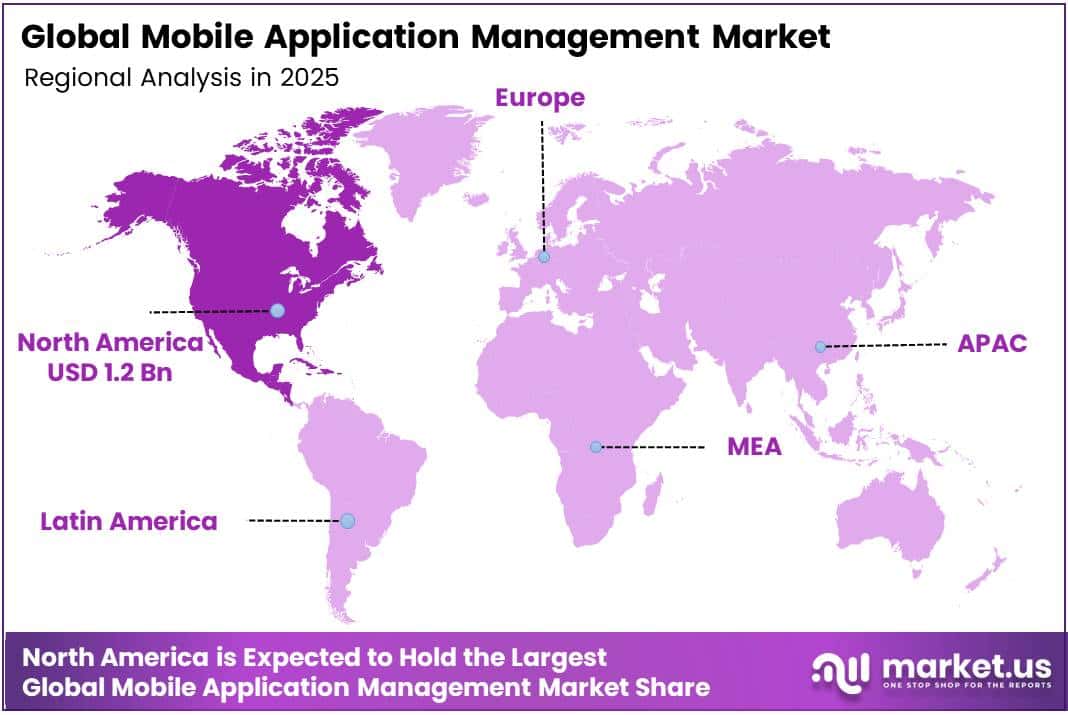
In 2025, the Global Mobile Application Management Market was valued at USD 3.5 billion. The market is projected to grow at a CAGR of 23.0% during 2026–2035, reaching approximately USD 27.5 billion by 2035. North America dominated the global market in 2025, accounting for more than 34.6% of the total market share and generating approximately USD 1.2 billion in revenue.
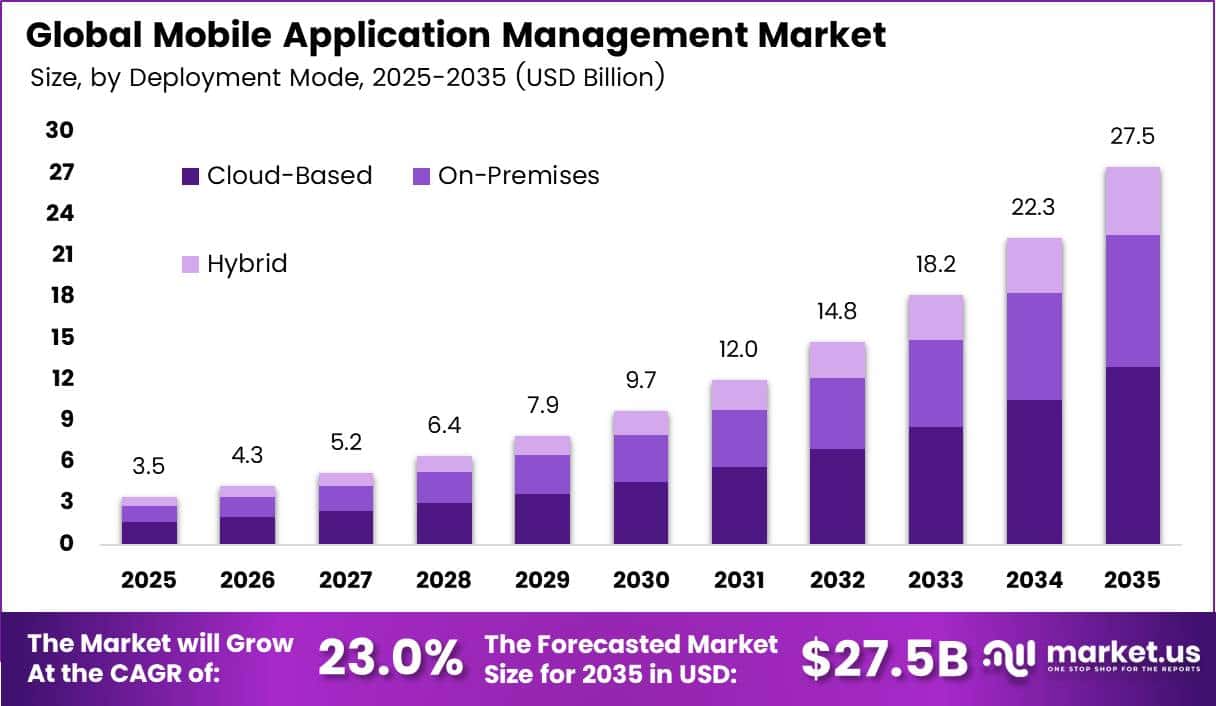
Mobile use at work drives this growth. According to the ITU, the world had 9.2 billion mobile cellular subscriptions in 2025. Mobile broadband now makes up 89% of all mobile subscriptions, up from under 50% in 2015. The ITU also reports that 5G accounts for 36% of mobile broadband subscriptions, and about 6 billion people are now online.
Every new work phone and tablet runs business apps that companies must secure, update, and control. IT and telecom firms, banks, and hospitals now give staff mobile access to sensitive data. That creates direct demand for tools that manage apps and protect corporate data on each device.
The North America region hosts the largest cloud platforms that power these tools. Microsoft’s FY2025 annual report shows Microsoft Cloud revenue of USD 168.9 billion, up 23% from the year before. Azure passed USD 75 billion in revenue for the first time, up 34%. This deep cloud base lets US and Canadian firms roll out cloud app management fast.
Key Takeaways
- The Mobile Application Management Market stood at USD 3.5 billion in 2025 and will reach USD 27.5 billion by 2035. at a CAGR of 23.0% from 2026 to 2035.
- By component, Software / Solutions leads with a 72.4% share.
- By deployment mode, Cloud-Based leads with a 68.2% share.
- By organization size, Large Enterprises lead with a 64.8% share.
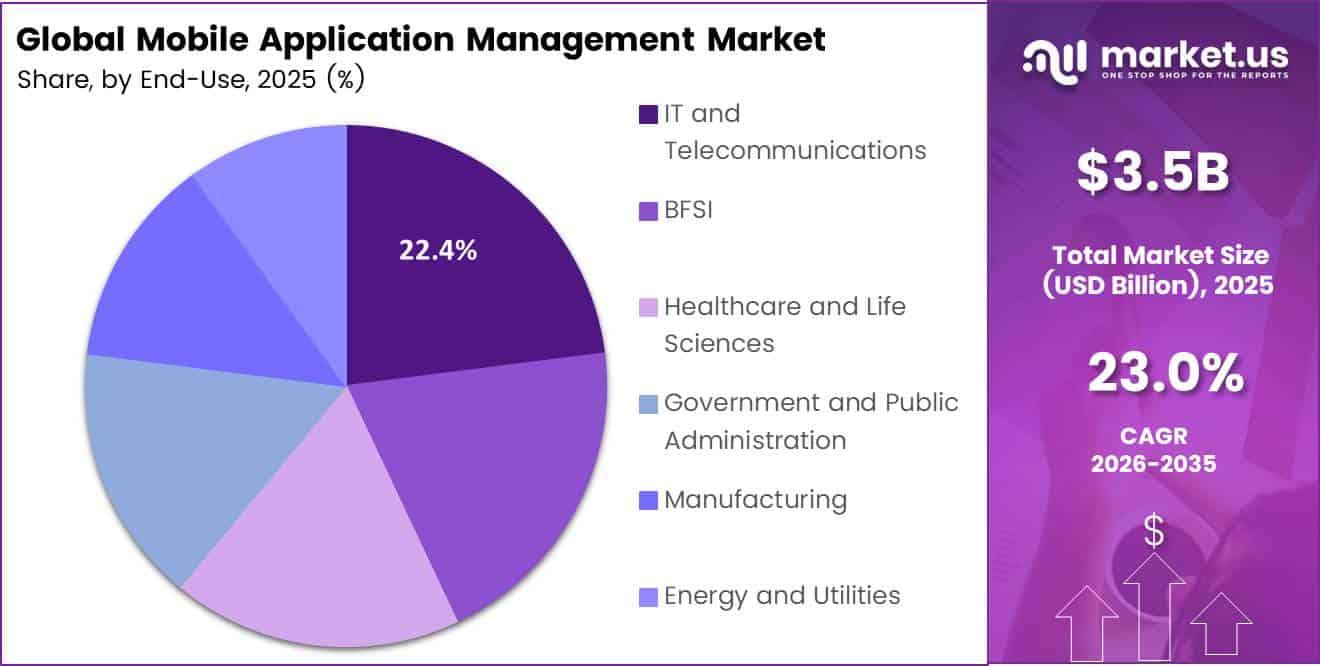
- By end-use industry, IT and Telecommunications lead with a 22.4% share.
- North America leads with a 34.6% share and USD 1.2 billion in revenue.
By Component
Software / Solutions dominates with 72.4% due to core app security policy control.
Software and solutions lead this market because companies need one tool to lock down work apps on every phone. Verizon’s 2025 Mobile Security Index found that 85% of organizations see mobile device attacks rising, and 80% faced mobile phishing aimed at staff. These threats push buyers to put app wrapping, data controls, and remote wipe tools at the center of their budgets.
Verizon also reports that 89% of organizations now hold a specific mobile security budget. Most of that money goes first to licensed platforms, since software delivers policy control the moment teams deploy it. Vendors also bundle app management into wider endpoint suites, which keeps software spending steady year after year.
Services form the fastest-growing part of this segment. Many firms buy tools but struggle to run them well. Verizon notes that only 4% of surveyed organizations have put all eight mobile security best practices in place. This gap creates strong demand for setup, training, and managed support. Partners help clients write app policies, test them, and track compliance, so service contracts grow faster than license sales.
By Deployment Mode
Cloud-Based dominates with 68.2% due to fast remote setup and updates.
Cloud-based tools hold the top spot because IT teams can push app rules to remote staff without buying servers. Eurostat data shows that 52.7% of EU enterprises paid for cloud computing services in 2025. That share rose by 7.4 percentage points compared with 2023, which signals a steady move away from in-house systems.
Adoption runs even higher in digital leaders. Finland reached 79.2% and Italy 75.6% of enterprises using paid cloud services. In these markets, buyers expect app management to arrive as a subscription with automatic updates, which favors cloud vendors on price and speed. Cloud dashboards also let one admin manage devices across many countries from a single screen.
Hybrid deployment is growing fastest. Banks, hospitals, and public offices often must keep some data on local servers due to strict rules. At the same time, they want cloud speed for daily app tasks. Lagging markets show room for this mixed model: Bulgaria stood at just 17.8% and Greece at 24.3% cloud use.
By Organization Size
Large Enterprises dominate with 64.8% due to large device fleets and budgets.
Large enterprises lead because they run big fleets of phones and tablets across many sites and teams. OECD research shows a clear size gap in digital tools. Large firms adopt cloud computing at much higher rates, and the gap with small firms widened from 31 to 33 percentage points between 2020 and 2021.
Small and medium enterprises form the fastest-growing group. Their cloud use keeps climbing, with the share of small OECD businesses buying cloud services rising from 38% to 41% in just one year. The 2025 OECD Digital for SMEs Survey adds that 35% of SMEs already link digital tools across functions, including mobile tech.
By End-Use Industry
IT and Telecommunications dominate with 22.4% due to a heavy mobile workforce and networks.
IT and telecommunications lead because these firms build networks, run field crews, and depend on mobile apps every hour. ITU counts 9.2 billion mobile-cellular subscriptions worldwide in 2025, or 112 per 100 people. Telecom operators that serve this huge base need tight control over the apps their own engineers and sales teams use.
The spread of new networks adds pressure. ITU reports that 36% of all mobile broadband subscriptions now run on 5G. Each rollout puts more connected tools in staff hands, and IT service firms manage client apps too, which keeps this industry the largest single buyer.
Healthcare and life sciences show the fastest growth. Doctors and nurses now use phones and tablets for patient records, telehealth, and remote monitoring. A single slip can be very costly. IBM’s 2025 Cost of a Data Breach Report shows healthcare had the highest average breach cost at USD 7.42 million, ahead of financial services at USD 5.56 million.
Key Market Segments
By Component
- Software / Solutions
- Services
By Deployment Mode
- Cloud-Based
- On-Premises
- Hybrid
By Organization Size
- Large Enterprises
- Small and Medium Enterprises (SMEs)
By End-Use Industry
- IT and Telecommunications
- Banking, Financial Services, and Insurance (BFSI)
- Healthcare and Life Sciences
- Government and Public Administration
- Manufacturing
- Energy and Utilities
- Others
Geopolitical Impact Analysis
Mobile application management is software, but it depends on physical goods. Phones, tablets, servers, and chips all cross borders before a single app gets managed. Trade policy shifts hit these inputs first. The WTO reported that new US reciprocal tariffs took effect on 7 August 2025. The WTO then cut its 2026 merchandise trade growth forecast to 0.5%, down from 2.8% growth in 2024.
Demand for AI hardware has softened the blow. The WTO found that AI-related goods such as semiconductors, servers, and telecom equipment rose 20% in value in the first half of 2025. In the first half of 2026, trade in these goods jumped 67% and drove 47% of global merchandise trade growth. The WTO notes that most new tariffs exempt chips and data transmission equipment.
Shipping routes add cost and delay. UNCTAD reported that Suez Canal transits ran about 70% below 2023 averages as of May 2025. Ships now sail for weeks around the Cape of Good Hope instead of days through the Red Sea. Rerouting lifted ton-miles by about 6%, while seaborne trade volume grew just 0.5% in 2025. Slower device shipments delay enterprise rollouts and push back new app management licenses.
New risks keep coming. In 2026, the WTO flagged conflict in the Middle East as a drag on trade, and UNCTAD named the Strait of Hormuz as a key risk. Higher freight and energy costs raise device prices. That pushes firms toward bring-your-own-device policies, which in turn increases demand for app-level controls.
Regional Analysis
North America dominates the Mobile Application Management Market, holding a 34.6% share and generating USD 1.2 billion in revenue. The US drives most of this demand. Large banks, insurers, hospitals, and federal agencies there manage millions of work devices.
Many leading vendors, including Microsoft, Jamf, Ivanti, and Omnissa, have their headquarters in the US. Canada adds strength through BlackBerry, which builds secure mobile tools for government and regulated sectors. Microsoft’s Intelligent Cloud segment grew by USD 18.8 billion, or 21%, in FY2025.
The WTO reported a surge in North American imports in early 2025 as firms stocked up ahead of tariff hikes. Its North American UEM product revenue fell by USD 11.6 million, while its Radar revenue rose by USD 5.8 million and AtHoc revenue by USD 3.2 million.
Asia Pacific is the fastest-growing region in the Mobile Application Management Market. China, India, Japan, South Korea, and Australia add millions of new enterprise mobile users each year. India stands out as a vendor hub. Ivanti plans to grow its India headcount from 500 to 2,000 within two years.
Key Regions and Countries
North America
- US
- Canada
Europe
- Germany
- France
- The UK
- Spain
- Italy
- Rest of Europe
Asia Pacific
- China
- Japan
- South Korea
- India
- Australia
- Rest of APAC
Latin America
- Brazil
- Mexico
- Rest of Latin America
Middle East and Africa
- GCC
- South Africa
- Rest of MEA
Market Dynamics
Drivers
| Driver | (~) % Impact on CAGR Forecast | Geographic Relevance | Impact Timeline |
|---|---|---|---|
| BYOD and Hybrid Work Institutionalization | +3.2% | Global, led by North America and Europe | Short term (2 years or less) |
| Zero Trust Architecture Mandates | +2.6% | North America, Europe | Medium term (2 to 4 years) |
| Unified Endpoint Management Bundling | +2.1% | Global | Short term (2 years or less) |
| Mobile-First Banking and Healthcare Workflows | +1.8% | Asia Pacific, North America | Medium term (2 to 4 years) |
| Data Protection Regulation Enforcement | +1.5% | Europe, India, Asia Pacific | Short term (2 years or less) |
BYOD and Hybrid Work Institutionalization
Hybrid work has become a permanent setup. OECD labour market tracking shows remote-capable employees spending about 1.5 to 2 days per week working remotely across member economies through 2024 and 2025. Because of this, companies are moving away from device-level MDM and toward app-level containerization: they secure corporate data inside managed apps, not the whole personal phone.
Microsoft investor disclosures put Intune-managed endpoints above 300 million in fiscal 2025, and Jamf annual reports show subscription revenue at more than 95% of total revenue. Together, these show the shift from perpetual licenses to per-user SaaS pricing.
Per U.S. Bureau of Labor Statistics telework supplements, about 22% to 23% of employed people teleworked in 2025. This pushes vendors toward per-app pricing of roughly USD 4 to USD 8 per user per month. It also lowers customer acquisition cost through bundled productivity-suite channels and raises net revenue retention above 110% among enterprise accounts.
Restraints
| Restraint | (~) % Impact on CAGR Forecast | Geographic Relevance | Impact Timeline |
|---|---|---|---|
| IT Budget Consolidation and Tool Rationalization | -1.9% | North America, Europe | Short term (2 years or less) |
| Employee Privacy Resistance on Personal Devices | -1.4% | Europe, North America | Short term (2 years or less) |
| Data Localization and Sovereign Cloud Rules | -1.1% | China, Middle East, India, Europe | Medium term (2 to 4 years) |
| Native OS-Level Management Substitution | -0.9% | Global | Medium term (2 to 4 years) |
| SME Cost Sensitivity in Emerging Markets | -0.7% | Latin America, Africa, South Asia | Short term (2 years or less) |
IT Budget Consolidation and Tool Rationalization
Enterprise software spending is now being cut back, and standalone MAM tools are among the first to go. Federal Reserve FOMC projections kept policy rates near 3.5% to 4.0% through 2025, which raised the hurdle rate for discretionary IT spending.
CIOs responded by trimming security tool portfolios that often held 40 to 60 separate products. Earnings calls from enterprise software vendors such as Ivanti, VMware’s parent Broadcom, and BlackBerry reported longer deal cycles of 3 to 6 months. Several also reported double-digit drops in standalone point-solution bookings, as buyers folded MAM into bundled productivity or UEM contracts.
As reflected in IMF World Economic Outlook growth revisions, slower corporate investment hits mid-market renewals hardest. Standalone vendors are seeing gross margins squeezed by 3 to 5 percentage points from discounting, while net-new deployments slip into later fiscal years.
Challenges
| Challenge | (~) % CAGR Friction Drag | Geographic Relevance | Mitigation Horizon |
|---|---|---|---|
| Mobile Security Talent Shortage | -1.6% | Global | Long term (4 years or more) |
| OS Update Compatibility Churn | -1.2% | Global | Short term (2 years or less) |
| AI-Driven Mobile Threat Escalation | -1.0% | North America, Asia Pacific | Medium term (2 to 4 years) |
| Legacy App SDK Integration | -0.8% | Europe, Japan | Medium term (2 to 4 years) |
| Fragmented Android OEM Ecosystem | -0.6% | Asia Pacific, Africa | Medium term (2 to 4 years) |
Mobile Security Talent Shortage
The cybersecurity workforce gap is structural, and it slows how fast companies can deploy policy-heavy MAM. The ISC2 workforce study put the global cybersecurity gap at about 4.8 million professionals in 2024. Mobile and endpoint specialists are among the hardest roles to fill. U.S. Bureau of Labor Statistics projections expect information security analyst jobs to grow about 33% over the decade, well above the overall labour market.
Per NASSCOM industry tracking, India’s security talent demand is still growing faster than certified supply. As a result, deployments take 20% to 30% longer and integration consulting costs rise. Over time, vendors will need to invest in no-code policy automation, AI-assisted configuration, and managed-service partner channels to keep deployment costs down.
Opportunities
| Opportunity | (~) % Potential CAGR Upside | Geographic Relevance | Execution Window |
|---|---|---|---|
| Frontline and Deskless Worker Enablement | +2.4% | Global, led by Asia Pacific | Medium term (2 to 4 years) |
| Generative AI App Governance Layer | +1.9% | North America, Europe | Short term (2 years or less) |
| MSP-Led SME Bundles | +1.3% | Latin America, Southeast Asia, India | Short term (2 years or less) |
| Wearables and Rugged Device Extension | +0.9% | North America, Europe | Long term (4 years or more) |
| Public Sector Digital ID Integration | +0.7% | India, Europe, Middle East | Long term (4 years or more) |
Frontline and Deskless Worker Enablement
Frontline workers are still largely untouched white space. Today’s MAM revenue mostly comes from knowledge workers, while shared-device frontline staff in retail, logistics, healthcare, and manufacturing remain under-licensed.
International Labour Organization employment data shows that deskless roles make up roughly 70% to 80% of the global workforce. Per GSMA Intelligence mobile economy tracking, smartphone adoption in Asia Pacific workforces is moving past 75%.
Annual reports from Zebra Technologies and Samsung show growing enterprise shared-device fleets, which open the door to per-device, multi-user licensing rather than per-named-user seats. Shift-based app provisioning priced at around USD 1 to USD 3 per device per month could lower acquisition cost per seat by 30% to 40%.
Key Players Analysis
Tier 1 leaders combine global reach with deep cloud funding. Microsoft leads through Intune and its cloud stack. Its Intelligent Cloud segment earned USD 106.3 billion in FY2025, up from USD 87.5 billion in FY2024. Microsoft spent USD 32.5 billion on R&D in FY2025, or 12% of revenue, a rise of 10%. Total revenue reached USD 281.7 billion.
Omnissa, the former VMware end-user computing unit, ranks as a Tier 1 rival. KKR bought it from Broadcom for about USD 4 billion. Omnissa launched with USD 1.5 billion in annual recurring revenue, 26,000 customers, and 4,000 staff. IBM, Google, Cisco, and Samsung also sit in Tier 1 through bundled cloud, Android, network, and device security offerings.
Tier 2 challengers hold strong niche positions. BlackBerry posted FY2026 revenue of USD 549.1 million, up from USD 534.9 million. Its Secure Communications ARR reached USD 218 million, up from USD 208 million. BlackBerry guides FY2027 revenue at USD 584 million to USD 611 million. Jamf leads Apple device management and moved to private ownership in 2026.
Zoho, through ManageEngine, serves more than 1 million paying customers and 150 million users. Ivanti, SOTI, Hexnode, 42Gears, Scalefusion, and Miradore compete on price and SME reach.
Top Key Players in the Market
- Microsoft Corporation
- Omnissa
- IBM Corporation
- Ivanti
- BlackBerry Limited
- Jamf Holding Corp.
- SOTI Inc.
- Zoho Corporation (ManageEngine)
- Mitsogo Inc. (Hexnode)
- Cisco Systems, Inc.
- Samsung Electronics Co., Ltd.
- Google LLC
- 42Gears Mobility Systems
- ProMobi Technologies (Scalefusion)
- Miradore Ltd.
Recent Developments
- In March 2025, Jamf signed a definitive agreement to acquire identity and access management firm Identity Automation for about USD 215.0 million in cash. Jamf agreed to be acquired by Francisco Partners in an all-cash deal worth about USD 2.2 billion, or USD 13.05 per share, a premium of about 50%.
- In January 2026, Francisco Partners closed its USD 2.2 billion acquisition of Jamf at USD 13.05 per share, taking the company private.
- In April 2026, Zoho Corporation (ManageEngine) committed more than 100 million yuan (USD 14.52 million) to China for data centers, hardware, marketing, and local R&D teams.
Report Scope
| Report Features | Description |
|---|---|
| Market Value (2025) | USD 3.5 Billion |
| Forecast Revenue (2035) | USD 27.5 Billion |
| CAGR (2026-2035) | 23.0% |
| Base Year for Estimation | 2025 |
| Historic Period | 2020-2024 |
| Forecast Period | 2026-2035 |
| Report Coverage | Revenue Forecast, Market Dynamics, Competitive Landscape, Recent Developments |
| Segments Covered | By Component (Software / Solutions, Services); By Deployment Mode (Cloud-Based, On-Premises, Hybrid); By Organization Size (Large Enterprises, Small and Medium Enterprises (SMEs)); By End-Use Industry (IT and Telecommunications, Banking, Financial Services, and Insurance (BFSI), Healthcare and Life Sciences, Government and Public Administration, Manufacturing, Energy and Utilities, Others) |
| Regional Analysis | North America – US, Canada; Europe – Germany, France, The UK, Spain, Italy, Rest of Europe; Asia Pacific – China, Japan, South Korea, India, Australia, Singapore, Rest of APAC; Latin America – Brazil, Mexico, Rest of Latin America; Middle East & Africa – GCC, South Africa, Rest of MEA |
| Competitive Landscape | Microsoft Corporation, Omnissa, IBM Corporation, Ivanti, BlackBerry Limited, Jamf Holding Corp., SOTI Inc., Zoho Corporation (ManageEngine), Mitsogo Inc. (Hexnode), Cisco Systems, Inc., Samsung Electronics Co., Ltd., Google LLC, 42Gears Mobility Systems, ProMobi Technologies (Scalefusion), Miradore Ltd. |
| Customization Scope | Customization for segments, region/country-level will be provided. Moreover, additional customization can be done based on the requirements. |
| Purchase Options | We have three licenses to opt for: Single User License, Multi-User License (Up to 5 Users), Corporate Use License (Unlimited Users and Printable PDF) |