


Report Overview
In 2025, the Global Application Security Market was valued at USD 26.9 billion. The market is projected to grow at a CAGR of 10.4% during 2026–2035, reaching approximately USD 72.2 billion by 2035. North America dominated the global market in 2025, accounting for more than 40.50% of the total market share.
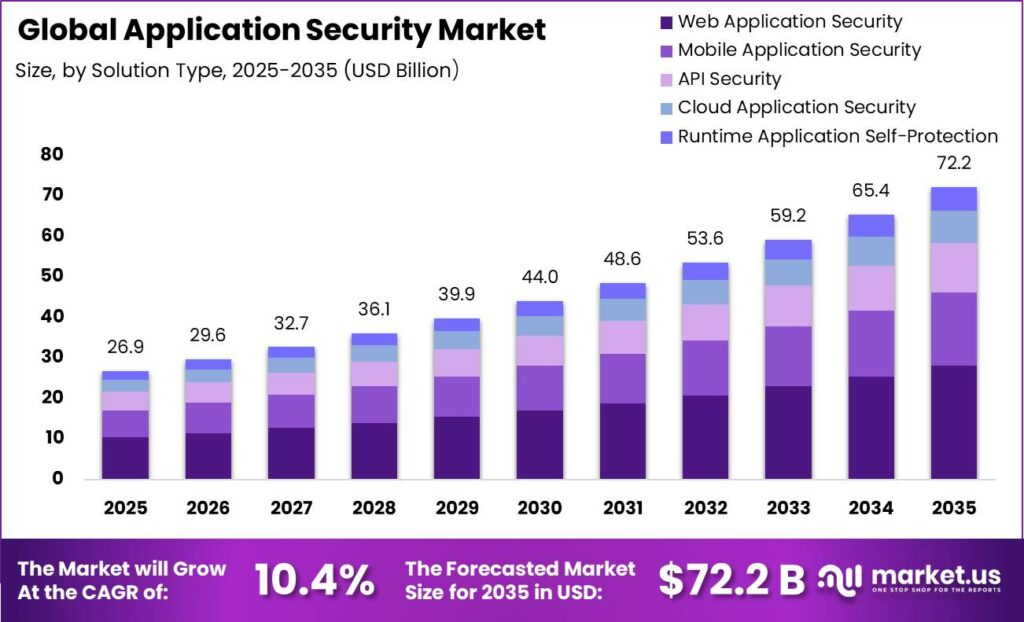
This growth is driven by the rapid expansion of digital services, cloud applications, and online business operations. According to the International Telecommunication Union (ITU), around 6 billion people, representing 74% of the global population, were using the internet in 2025, with more than 240 million new users added in a single year. This increase is creating a larger number of web applications, APIs, and digital platforms that require strong security.
The Digital Cooperation Organization (DCO) also estimates that the global digital economy reached approximately USD 24 trillion in 2025, accounting for 21% of global GDP after growing 8.5%, well above the global GDP growth rate of 2.7%. As businesses continue to digitize their operations, demand for application security solutions that protect applications, user identities, and sensitive data continues to rise. Government investments are also supporting market growth.
The U.S. Federal Budget for FY 2025 allocated USD 13 billion for civilian cybersecurity, including USD 3 billion for CISA, highlighting application security as a national priority. This strong investment, along with advanced enterprise IT infrastructure and early adoption of DevSecOps practices, helped North America account for more than 40.5% of the global market in 2025.
The market is also being supported by the rapid increase in cyber threats targeting software applications. According to CISA, 238 high-risk vulnerabilities were added to the Known Exploited Vulnerabilities (KEV) catalog in FY 2025, while more than 43,000 vulnerabilities were assessed during the year.
The Verizon 2026 Data Breach Investigations Report, based on over 31,000 security incidents, found that software vulnerability exploitation became the leading initial attack method, accounting for 31% of confirmed breaches, up from 20% a year earlier. At the same time, only 26% of critical vulnerabilities were fully remediated by organizations, increasing the need for automated application security testing, runtime protection, and continuous vulnerability management.
The NIST National Vulnerability Database (NVD) enriched nearly 42,000 CVEs in 2025, representing a 45% increase over the previous record, while total CVE submissions increased by 263% between 2020 and 2025. These trends indicate that organizations are facing a rapidly expanding application attack surface, making continued investment in application security solutions essential across all industries.
Key Takeaways
- In 2025, the Global Application Security Market was valued at USD 26.9 billion and is projected to reach USD 72.2 billion by 2035, expanding at a CAGR of 10.4% during the forecast period from 2026 to 2035.
- By solution type, Web Application Security led the market with a 38.9% share in 2025.
- By deployment mode, the Cloud-Based segment accounted for the largest market share of 66.2% in 2025.
- By organization size, Large Enterprises held the dominant share of 64.1% in 2025 due to higher cybersecurity budgets and complex application environments.
- By security testing type, Static Application Security Testing (SAST) captured the largest share of 34.5% in 2025.
- By application type, Web Applications accounted for the largest revenue share of 41.8% in 2025.
- By end-user industry, the BFSI sector dominated the market with a 28.6% share in 2025.
- By security model, DevSecOps Integration held the leading market share of 37.2% in 2025.
- By functionality, Vulnerability Management accounted for the largest share of 33.8% in 2025.
- North America dominated the global market in 2025, accounting for more than 40.5% of the total market share.
By Solution Type
The Web Application Security segment dominated the Application Security Market, accounting for 38.9% of the market share in 2025. Its leadership is driven by the growing dependence of businesses on web-based applications for customer services, e-commerce, banking, SaaS platforms, and government operations.
As web applications become the primary interface for digital services, they also remain the most common target for cyberattacks such as injection attacks, broken access control, and credential theft. According to W3Techs, more than 1.9 billion websites were active globally in 2025, while 98.8% of websites used JavaScript, highlighting the scale of web-based applications.
The OWASP Top 10 2025 also reported that 100% of tested applications contained some form of broken access control, and injection vulnerabilities were associated with more than 30,000 active CVEs. These factors continue to drive strong demand for web application security solutions across enterprises.
The Mobile Application Security segment is projected to register the fastest CAGR during the forecast period. The rapid increase in smartphone usage, mobile internet access, and digital financial services is creating greater demand for securing mobile applications. According to the GSMA State of Mobile Internet Connectivity 2025 Report, around 4.7 billion people, representing 58% of the global population, used mobile internet in 2025, while 5G connections exceeded 2.7 billion globally.
By Deployment Mode
The Cloud-Based segment dominated the Application Security Market in 2025, accounting for 66.2% of the total market share. This leadership is driven by the rapid shift of enterprise applications, databases, APIs, and business workloads to cloud environments. Organizations increasingly adopt cloud-first strategies.
The growing adoption of cloud services further supports this trend. According to Eurostat, 66.78% of medium-sized enterprises across the European Union used purchased cloud computing services in 2025, up from 59.09% in 2023. In addition, Synergy Research Group reported that global enterprise spending on cloud infrastructure services reached USD 419 billion in 2025, reflecting 30% year-over-year growth.
The International Energy Agency (IEA) also reported that global data center electricity consumption reached approximately 415 TWh in 2024 and is projected to increase to 945 TWh by 2030, highlighting the rapid expansion of cloud infrastructure. As more business-critical applications move to the cloud, demand for cloud-native application security solutions is expected to remain strong, reinforcing the segment’s leading market position.
By Organization Size
Large Enterprises dominated the Application Security Market in 2025, accounting for 64.1% of the total market share. Their leadership is driven by the need to secure large and complex IT environments that include multi-cloud infrastructure, enterprise applications, customer-facing platforms, and extensive API networks.
Small and Medium Enterprises (SMEs) are expected to register the fastest CAGR during the forecast period. Growth is supported by the rapid digital transformation of small businesses and the rising number of cyberattacks targeting them. According to the OECD (2025), SMEs account for 99% of all companies and 60% of business-sector employment across OECD economies, making them a major target for cybercriminals.
The European Commission’s Annual Report on European SMEs 2025/2026 states that the EU has around 34 million SMEs, with 2.5% growth in real value added and 1.0% employment growth in 2025. In addition, the Verizon DBIR 2025 reported 3,049 SMB security incidents and 2,842 confirmed data breaches, with 88% involving ransomware, compared with 39% among large enterprises.
By Security Testing Type
Static Application Security Testing (SAST) dominated the Application Security market in 2025, accounting for 34.5% of the total market share. Its strong position is driven by its ability to identify security issues early in the software development process, allowing organizations to fix vulnerabilities before applications are deployed.
SAST analyzes source code to detect risks such as coding errors, injection flaws, and exposed credentials, helping reduce both security risks and remediation costs. The adoption of SAST has also been supported by regulatory requirements. The U.S. Executive Order 14028 and the NIST Secure Software Development Framework (SP 800-218) recommend automated static code analysis as a key part of secure software development.
In addition, GitHub’s Octoverse 2025 Report stated that developers merged 518.7 million pull requests in 2025, up 29% from the previous year, reflecting the growing use of automated code scanning tools in modern CI/CD pipelines. The report also noted that the average time to fix critical security vulnerabilities declined by 30%, from 37 days to 26 days, highlighting the benefits of identifying vulnerabilities earlier in the development lifecycle.
By Application Type
Web Applications dominated the application type segment in 2025, accounting for 41.8% of the global Application Security market. Their leading position is driven by their widespread use across industries, including banking, e-commerce, healthcare, government, and enterprise services, making them the most common target for cyberattacks. According to Eurostat, 52.7% of EU enterprises used paid cloud computing services in 2025, up 7.4 percentage points from 2023.
Most of these organizations hosted web-based services such as email, office software, file storage, and customer-facing applications in the cloud. In addition, 65.5% of cloud-using enterprises relied on cloud-hosted security software, highlighting the growing need to protect web applications, APIs, and online services. As more businesses launch web portals and digital platforms, demand for web application security solutions continues to increase.
Cloud-Native Applications are expected to register the fastest CAGR during the forecast period. According to the Cloud Native Computing Foundation (CNCF) Annual Survey 2025, 98% of surveyed organizations have adopted cloud-native technologies, while 82% of container users run Kubernetes in production, up from 66% in 2023.
The survey also found that 59% of organizations now develop most or nearly all of their applications using cloud-native methods, and 82% expect cloud-native platforms to become the primary environment for all new applications within the next five years. As these applications include multiple interconnected services and APIs, they create a larger attack surface, increasing the need for advanced cloud-native application security solutions.
By End User Industry
The BFSI segment dominated the Application Security Market in 2025, accounting for 28.6% of the total market share. Its leadership is driven by the need to protect highly sensitive financial data, digital banking platforms, payment systems, and customer applications from increasingly advanced cyber threats.
In addition, the European Union Agency for Cybersecurity (ENISA) reported in its Threat Landscape 2025 that 83.5% of cyber incidents in the EU financial sector involved DDoS and web-based attacks, while credit institutions accounted for 36% of the total impact.
The Bank for International Settlements (BIS) reported that global cross-border banking claims exceeded USD 35 trillion at the end of 2025, highlighting the vast amount of financial data that depends on secure web and mobile applications, thereby supporting strong demand for application security solutions.
By Security Model
DevSecOps Integration dominated the security model segment of the Application Security market, accounting for 37.2% of the market share in 2025. Its leadership is driven by the growing need to identify and fix security issues early in the software development process, reducing risks before applications are deployed.
The rapid growth of software development, with developers on GitHub merging more than 500 million pull requests in 2025, has increased the demand for integrated DevSecOps tools, supporting the segment’s leading position in the global market.
By Functionality
Vulnerability Management accounted for the largest 33.8% share of the Application Security market in 2025 because organizations continue to face a growing number of software vulnerabilities that require continuous monitoring and remediation. According to Veracode’s 2026 State of Software Security Report, the share of organizations with security debt increased from 71% in 2024 to 74% in 2025, reaching 82% in 2026.
During the same period, organizations with critical security debt rose from 46% to 60%, highlighting the increasing need for effective vulnerability management. The report also found that nearly 49% of applications still contain unresolved security issues.
Threat Detection & Response is expected to register the fastest CAGR during the forecast period due to the growing need for faster identification and containment of cyberattacks. According to IBM’s 2025 Cost of a Data Breach Report, organizations that extensively use AI in security operations reduced the average breach lifecycle to 51 days, compared with the global average of 241 days, significantly lowering the financial impact of cyber incidents.
The report also states that 55% of security teams already use AI for threat detection, alert analysis, and incident response. At the same time, the World Economic Forum’s Global Cybersecurity Outlook 2026 found that 87% of respondents identified AI-related vulnerabilities as one of the fastest-growing cybersecurity risks. 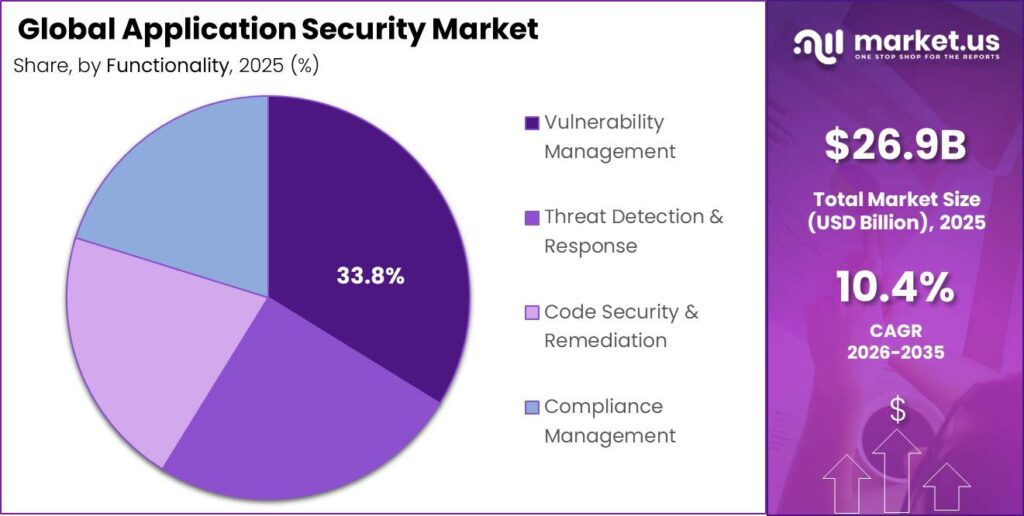
Key Market Segments
By Solution Type
- Web Application Security
- Mobile Application Security
- API Security
- Cloud Application Security
- Runtime Application Self-Protection (RASP)
By Deployment Mode
- Cloud-Based
- On-Premises
By Organization Size
- Large Enterprises
- Small & Medium Enterprises (SMEs)
By Security Testing Type
- Static Application Security Testing (SAST)
- Dynamic Application Security Testing (DAST)
- Interactive Application Security Testing (IAST)
- Software Composition Analysis (SCA)
By Application Type
- Web Applications
- Cloud-Native Applications
- Mobile Applications
- Enterprise Applications
By End User Industry
- BFSI
- IT & Telecommunications
- Healthcare
- Retail & E-commerce
- Government & Defense
- Energy & Utilities
By Security Model
- DevSecOps Integration
- Zero Trust Application Security
- Traditional App Security Tools
By Functionality
- Vulnerability Management
- Threat Detection & Response
- Code Security & Remediation
- Compliance Management
Market Dynamics
Drivers
| Driver | (~) % CAGR | Geographic Relevance | Impact Timeline |
|---|---|---|---|
| Escalating application-layer attacks | +3.0% | North America, Europe, Asia-Pacific | Short term (≤ 2 years) |
| API and microservices proliferation | +2.1% | Global | Medium term (2–4 years) |
| Cloud-native and SaaS adoption | +1.8% | Global | Medium term (2–4 years) |
| Regulatory push for secure software | +1.3% | North America, Europe | Short term (≤ 2 years) |
| DevSecOps toolchain integration | +1.0% | Global | Medium term (2–4 years) |
| Runtime protection and RASP adoption | +0.9% | Global | Long term (≥ 4 years) |
Escalating application-layer attacks
Escalating application-layer attacks are reshaping security procurement by forcing enterprises to treat application security as a board-level resilience function rather than a discretionary IT spend, particularly as weekly cyberattacks per organization have risen above 1,600 and software supply-chain incidents have increased by more than 40% year-on-year in the early 2020s.
This threat inflation is quantifiable in terms of loss avoidance, with global cybercrime losses projected to grow by roughly 175% between 2022 and 2027, creating a direct economic rationale to allocate an additional 2–3% of revenue to security in high-risk verticals such as healthcare, financial services, and online retail.
Enterprise buyers are shifting from periodic penetration testing and manual reviews toward always-on platforms that cover static analysis, dynamic testing, and runtime protection in one subscription, lifting average recurring spend per critical application by an estimated 25–35% versus legacy models.
This reconfiguration of budgets, combined with a higher share of spend flowing into developer-centric tools integrated into CI/CD, effectively contributes an incremental ~3.0% to the sector’s CAGR relative to the baseline by converting one-off project revenues into multi-year SaaS and managed-service contracts across North America, Europe, and Asia-Pacific.
Restraints
| Restraint | (~) % CAGR | Geographic Relevance | Impact Timeline |
|---|---|---|---|
| High integration and deployment complexity | -2.2% | Global | Short term (≤ 2 years) |
| Upfront cost sensitivity in SMEs | -1.6% | Global (more acute in emerging markets) | Short term (≤ 2 years) |
| Fragmented tooling and vendor overlap | -1.3% | North America, Europe | Medium term (2–4 years) |
| Data residency and sovereignty constraints | -1.1% | Europe, Middle East, parts of Asia | Medium term (2–4 years) |
| Legacy monolithic application estates | -0.9% | Global (large enterprises) | Long term (≥ 4 years) |
| Procurement inertia in regulated sectors | -0.8% | Global | Medium term (2–4 years) |
High integration and deployment complexity
High integration and deployment complexity acts as the most immediate structural restraint because modern application security stacks must be wired into dozens of tools across the SDLC, from source code repositories and CI servers to ticketing platforms, which can add 3–6 months to rollout timelines for large enterprises and effectively freeze spend during complex integration waves.
The need to align static, dynamic, and software composition analysis with existing CI/CD pipelines and to manage scanning performance on codebases running into tens of millions of lines frequently forces teams to limit scanning frequency, cutting effective coverage on critical services by 20–30% and undermining perceived ROI.
To compensate, vendors often resort to professional services engagements that can equal 20–40% of first-year license value, compressing gross margins by an estimated 4–6 percentage points versus pure software delivery while customers incur higher total cost of ownership.
This combination of elongated sales-to-value cycles, heavier services mix, and deployment fatigue removes an estimated 2.2% from the otherwise addressable CAGR, particularly in global blue-chip accounts where each additional integration into a regulated production environment must pass multiple security and change-management gates.
Challenges
| Challenge | (~) % CAGR | Geographic Relevance | Mitigation Horizon |
|---|---|---|---|
| Acute application security skills gap | -2.5% | Global | Medium term (2–4 years) |
| Rapidly evolving attack techniques | -2.0% | Global | Long term (≥ 4 years) |
| Balancing security and developer velocity | -1.7% | Global | Medium term (2–4 years) |
| Limited adoption of formal security frameworks | -1.4% | Global | Medium term (2–4 years) |
| Visibility gaps in complex hybrid estates | -1.2% | North America, Europe, Asia-Pacific | Long term (≥ 4 years) |
| False positives and alert fatigue | -1.0% | Global | Short term (≤ 2 years) |
Acute application security skills gap
An acute application security skills gap is a structural vulnerability because enterprise adoption of advanced frameworks such as OWASP ASVS, NIST CSF, and ISO/IEC 27034 requires security architects and developer champions that many organizations simply do not have, with industry commentary indicating that fewer than roughly one in three organizations feel prepared to deal with software supply-chain and application-layer threats.
In practice, this means that each in-house AppSec specialist can be responsible for portfolios of more than 100 applications and thousands of microservices, forcing security teams to triage only the top 10–20% of issues and leaving residual risk in the remaining codebase.
The shortage drives compensation premiums of 20–30% for experienced AppSec engineers in mature markets, and it limits the number of new platform deployments a given enterprise can absorb per year, effectively shaving an estimated 2.5% from the market’s maximum attainable CAGR by constraining how fast organizations can expand coverage to all critical applications.
Opportunities
| Opportunity | (~) % CAGR | Geographic Relevance | Execution Window |
|---|---|---|---|
| Holistic software supply chain security platforms | +2.4% | Global | Medium term (2–4 years) |
| AI-assisted secure coding copilots | +2.1% | Global | Medium term (2–4 years) |
| Verticalized solutions for high-risk sectors | +1.9% | North America, Europe, Asia-Pacific | Short term (≤ 2 years) |
| Monetizing compliance and framework mapping | +1.5% | Global | Medium term (2–4 years) |
| Converged cloud-native application protection | +1.4% | Global | Long term (≥ 4 years) |
| Partner-led managed AppSec services | +1.2% | Global | Medium term (2–4 years) |
Holistic software supply chain security platforms
Holistic software supply chain security platforms represent a future-facing opportunity rather than a current driver because, despite software supply-chain attacks rising by more than 40% year-on-year and only about one in three organizations feeling prepared, most enterprises still rely on siloed tools and manual spreadsheets instead of unified platforms that cover SBOM management, third-party risk, and continuous dependency monitoring end-to-end.
A platform that can automatically ingest and reconcile SBOMs across hundreds of applications, correlate them with known vulnerabilities, and enforce policies on upstream repositories could reduce remediation lead times from weeks to days and cut the effective cost per remediated vulnerability by an estimated 30–40%, while also lowering the probability of a major breach event that can carry average direct and indirect costs in the high seven- to eight-figure range in sensitive verticals.
Because this white space is still under-penetrated, vendors that invest in integrated supply chain offerings can capture an incremental 2.4% CAGR upside on top of the baseline by cross-selling into existing application security accounts and pricing on a value-based model tied to the number of dependencies, suppliers, or repositories monitored.
This also supports margin expansion of roughly 3–5 percentage points versus services-heavy integration work, as much of the platform value can be delivered via automation and analytics at scale, making it a structurally attractive profit pool within the broader application security landscape.
Geopolitical Impact Analysis
Geopolitical tensions are creating both challenges and growth opportunities for the Application Security market. According to the World Trade Organization (WTO) Global Trade Outlook and Statistics (March 2026), foreign direct investment (FDI) in tariff-exposed and global value chain-intensive sectors, including ICT hardware, semiconductors, and enterprise software infrastructure, is expected to decline by 25% in 2025.
This affects the supply of servers, networking equipment, and semiconductor-based security hardware that support application security platforms. During 2025, U.S. tariffs on Chinese technology imports reached as high as 145% before partial rollbacks, while the International Monetary Fund (IMF) reported that average U.S. tariffs across technology products remain around 10–20%.
Rising geopolitical risks are increasing the need for stronger application security solutions. The World Economic Forum (WEF) Global Cybersecurity Outlook 2026 reported that 64% of organizations now consider geopolitically driven cyberattacks in their security planning, while 66% have updated their cybersecurity strategies because of geopolitical instability. In addition, 60% identified geopolitical tensions as the main factor shaping their cybersecurity investments.
The World Bank’s Global Economic Prospects (June 2025) lowered its global growth forecast to 2.3% for 2025, highlighting growing investment uncertainty caused by geopolitical fragmentation. Despite these economic pressures, UNCTAD’s World Investment Report 2025 found that investment in digital services and ICT manufacturing increased by 14%, even as total global FDI declined by 11%.
Regional Analysis
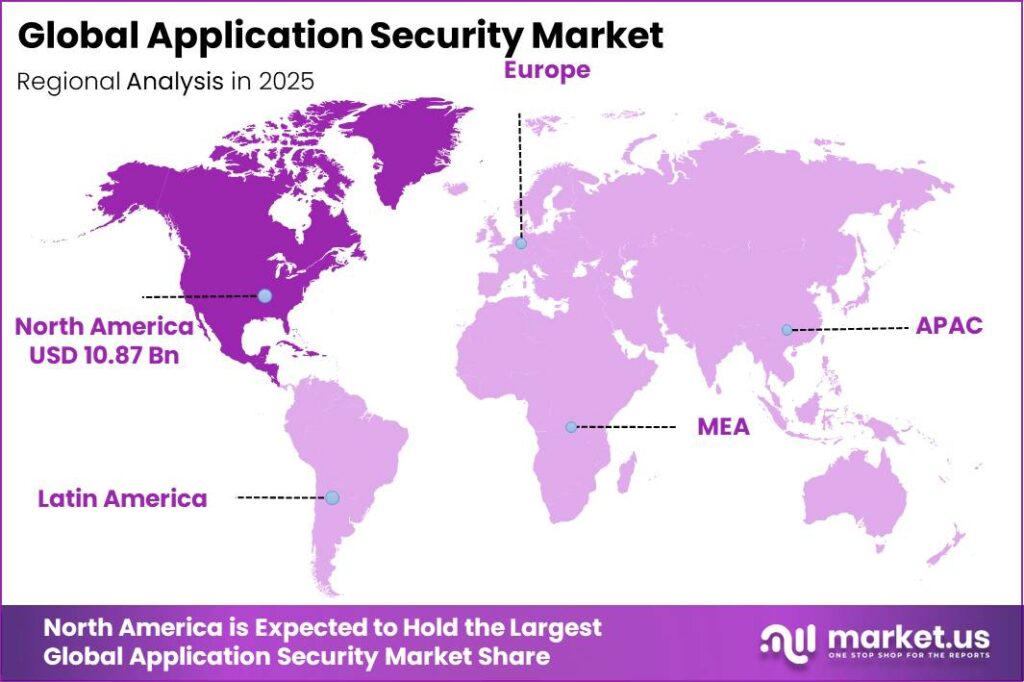
North America dominated the global Application Security Market in 2025, accounting for more than 40.5% of the total market share. The region’s leadership is supported by strong cybersecurity investments, advanced digital infrastructure, and strict regulatory requirements. The U.S. Office of Management and Budget (OMB) proposed USD 75 billion in civilian IT spending for FY 2025, including USD 13 billion for civilian cybersecurity and USD 3 billion for the Cybersecurity and Infrastructure Security Agency (CISA).
This continued investment has strengthened the adoption of application security solutions across government agencies and private industries such as BFSI, healthcare, cloud services, and defense. According to Eurostat, 52.7% of EU enterprises use cloud services based on platforms developed by U.S. providers, highlighting North America’s leadership in cloud technologies.
In addition, the Verizon 2026 Data Breach Investigations Report (DBIR) found that vulnerability exploitation accounted for 31% of enterprise breaches, encouraging organizations to increase investments in application security testing, runtime protection, and DevSecOps solutions while complying with regulations such as SEC cybersecurity disclosure rules, PCI DSS, HIPAA, and SOC 2.
Asia Pacific is expected to register the fastest CAGR during the forecast period. The region is experiencing rapid digital transformation, increasing internet adoption, and expanding cloud application deployment. According to the ITU Facts and Figures 2025 report, internet penetration in Asia Pacific increased from 50% to 77% over the past six years, representing the highest regional growth worldwide.
Key Regions and Countries Covered in this Report
- North America
- The US
- Canada
- Europe
- Germany
- France
- The UK
- Spain
- Italy
- Russia & CIS
- Rest of Europe
- APAC
- China
- Japan
- South Korea
- India
- ASEAN
- Rest of APAC
- Latin America
- Brazil
- Mexico
- Rest of Latin America
- Middle East & Africa
- GCC
- South Africa
- Rest of MEA
Key Players Analysis
The Application Security market is highly competitive, led by global technology companies and specialized cybersecurity providers that continue to expand their security portfolios. Microsoft remains one of the strongest players, reporting USD 281.7 billion in revenue in FY2025, up 15% year-over-year, while Azure exceeded USD 75 billion in annual revenue with 34% growth.
The company has integrated application security capabilities, including Defender for DevOps, Entra ID, and GitHub Advanced Security, into its cloud and developer ecosystem. Palo Alto Networks reported USD 9.2 billion in FY2025 revenue, up 15%, with Next-Generation Security ARR reaching USD 5.6 billion, growing 32%. The company continues to strengthen its unified security platform by combining web application firewall (WAF), API security, application testing, and cloud workload protection.
Cisco generated USD 56.7 billion in FY2025 revenue, while its security business reached USD 8.09 billion, increasing by nearly 59.5%, supported by the integration of Splunk. Fortinet reported USD 6.80 billion in revenue, up 14%, while its Security Operations ARR increased 35%, supported by its leadership in firewall solutions and growing focus on cloud-native application security.
Specialized cybersecurity companies are also strengthening their market position by focusing on application security and DevSecOps solutions. Check Point Software Technologies generated USD 2.725 billion in revenue during FY2025, with security subscription revenue reaching USD 1.219 billion, up 10%, while serving more than 100,000 organizations worldwide. Akamai Technologies reported USD 4.208 billion in total revenue, including USD 2.243 billion from its security business, which grew 10% and accounted for more than half of the company’s revenue.
The Major Players in the Industry
- Microsoft
- IBM
- Palo Alto Networks
- Check Point Software Technologies
- Fortinet
- Cisco
- Trend Micro
- Akamai Technologies
- Cloudflare
- Rapid7
- Synopsys
- Veracode
- Qualys
- Snyk
- Black Duck (Synopsys)
- Other Key Players
Key Development
- In March, 2026, Google LLC completed its USD 32 billion all-cash acquisition of Wiz, making it the largest acquisition in the company’s history and significantly exceeding its USD 5.4 billion acquisition of Mandiant in 2022.
- In February 2026, Palo Alto Networks completed its USD 25 billion cash-and-stock acquisition of CyberArk Software after receiving regulatory approvals from the U.S., European Union, United Kingdom, and Israel.
- In July 2025, Palo Alto Networks completed the acquisition of Protect AI, a leading AI security company based in Seattle, for an estimated USD 650–700 million. The company’s technologies, including its AI/ML vulnerability scanner, model supply chain security solutions, and AI Risk Database, were integrated into the Prisma AIRS (AI Runtime Security) platform.
- In March 2025, Google announced a definitive agreement to acquire Wiz for USD 32 billion in cash, marking one of the largest cybersecurity acquisitions ever proposed. The agreement included a USD 3.2 billion break-up fee, the largest recorded in cybersecurity M&A, payable to Wiz if the transaction failed to obtain regulatory approval.
Report Scope
| Report Features | Description |
|---|---|
| Market Value (2025) | USD 26.9 Billion |
| Forecast Revenue (2035) | USD 72.2 Billion |
| CAGR (2026-2035) | 10.4% |
| Base Year for Estimation | 2025 |
| Historic Period | 2020-2024 |
| Forecast Period | 2026-2035 |
| Report Coverage | Revenue Forecast, Market Dynamics, Competitive Landscape, Recent Developments |
| Segments Covered | By Solution Type [Web Application Security, Mobile Application Security, API Security, Cloud Application Security and Runtime Application Self-Protection (RASP)] By Deployment Mode (Cloud-Based and On-Premises) By Organization Size [Large Enterprises and Small & Medium Enterprises (SMEs)] By Security Testing Type [Static Application Security Testing (SAST), Dynamic Application Security Testing (DAST), Interactive Application Security Testing (IAST) and Software Composition Analysis (SCA)] By Application Type (Web Applications, Cloud-Native Applications, Mobile Applications and Enterprise Applications) By End User Industry (BFSI, IT & Telecommunications, Healthcare, Retail & E-commerce, Government & Defense and Energy & Utilities) By Security Model (DevSecOps Integration, Zero Trust Application Security and Traditional App Security Tools) By Functionality (Vulnerability Management, Threat Detection & Response, Code Security & Remediation and Compliance Management) |
| Regional Analysis | North America – The US & Canada; Europe – Germany, France, The UK, Spain, Italy, Russia & CIS, Rest of Europe; APAC- China, Japan, South Korea, India, ASEAN & Rest of APAC; Latin America- Brazil, Mexico & Rest of Latin America; Middle East & Africa- GCC, South Africa, & Rest of MEA |
| Competitive Landscape | Microsoft, IBM, Palo Alto Networks, Check Point Software Technologies, Fortinet, Cisco, Trend Micro, Akamai Technologies, Cloudflare, Rapid7, Synopsys, Veracode, Qualys, Snyk, Black Duck (Synopsys) and others |
| Customization Scope | Customization for segments and region/country-level will be provided. Moreover, additional customization can be done based on the requirements. |
| Purchase Options | We have three licenses to opt for: Single User License, Multi-User License (Up to 5 Users), Corporate Use License (Unlimited Users and Printable PDF) |





























