


Report Overview
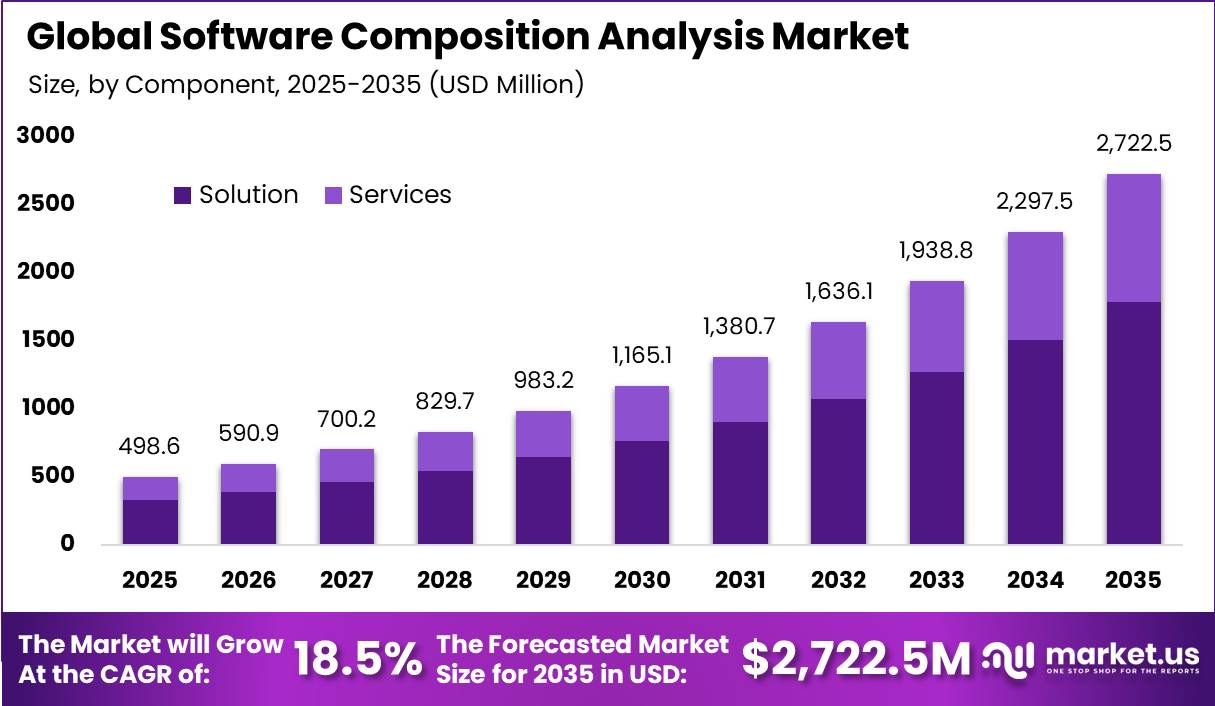
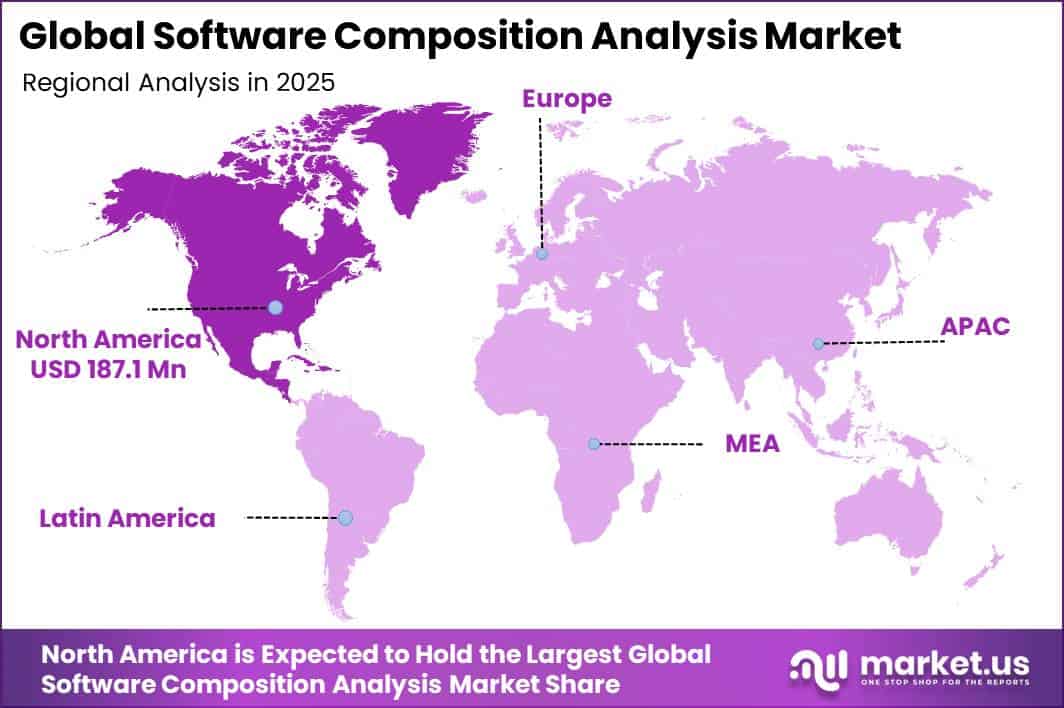
In 2025, the Global Software Composition Analysis Market was valued at USD 498.6 million. The market is projected to grow at a CAGR of 18.5% during 2026–2035, reaching approximately USD 2,722.5 million by 2035. North America dominated the global market in 2025, accounting for more than 36.7% of the total market share and generating approximately USD 187.1 million in revenue.
Growth is mainly supported by rising enterprise software development and widespread use of open-source code. GitHub reported more than 180 million developers in 2025, including over 36 million new developers added during the year. Developers made more than 1.12 billion contributions to public and open-source projects, while public and open-source repositories reached nearly 395 million.
Black Duck reported that 97% of commercial codebases contained open-source software, representing an average of 70% of total code. Each codebase used around 911 open-source components, while 64% were indirect dependencies. Security risks are also increasing demand for SCA solutions. Around 86% of assessed codebases contained at least one vulnerable open-source component, 81% included at least one high- or critical-risk vulnerability, and the average codebase contained 154 vulnerabilities.
In addition, 90% used components more than four years behind current versions, while 90% contained packages at least 10 versions behind. The EU Cyber Resilience Act, Regulation (EU) 2024/2847, entered into force. Software represented 24% of U.S. digital-economy value added, while cloud services expanded 232.1% between 2017 and 2022.
Key Takeaway
- The Software Composition Analysis was valued at USD 498.6 million in 2025 and is projected to reach USD 2,722.5 million by 2035, at a CAGR of 18.5%.
- The solution segment accounted for a 65.5% share of the market by component.
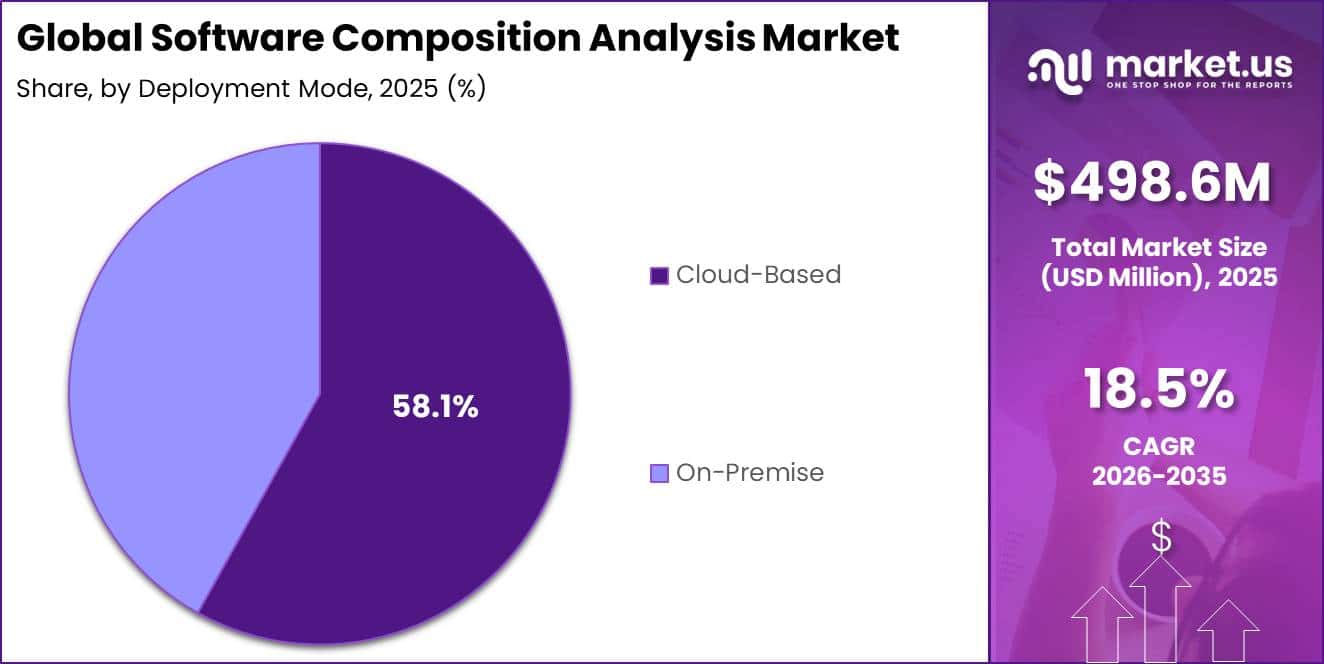
- The cloud-based segment accounted for 58.1% of the market by deployment mode.
- The large-enterprise segment accounted for 59.4% of the market by organization size.
- The BFSI segment led the market by industry vertical with a 24.3% share.
- North America led the market in 2025 with a 36.7% share and approximately USD 187.1 million in revenue.
Market Statistics and Data Insights
- Open-source penetration in commercial software reached 98% of audited codebases in the 2026 OSSRA study, up from 97%. The average application contained 1,180 open-source components, increasing 30% from 911. Mean files per codebase increased 74% to 84,499. These figures directly expand the number of components that SCA platforms must identify and monitor.
- Vulnerability density increased sharply. Black Duck found that 87% of audited codebases contained at least one open-source vulnerability, 78% contained high-risk vulnerabilities, and 44% contained critical-risk vulnerabilities. Mean vulnerabilities per codebase increased 107% to 581, while mean unique vulnerabilities reached 237.
- NIST reported that CVE submissions increased 263% between 2020 and 2025. NIST enriched nearly 42,000 CVEs during 2025, 45% more than its previous annual record, yet still could not keep pace with submissions. CVE submissions during the first 3 months of 2026 were nearly one-third higher year-on-year.
- Open-source malware has reached industrial scale. Sonatype identified more than 454,600 new malicious packages during 2025, bringing its cumulative known and blocked total to more than 1.233 million packages across npm, PyPI, Maven Central, NuGet, and Hugging Face. More than 99% of recorded open-source malware in 2025 occurred on npm.
- Financial-sector software resilience provides another SCA demand indicator. European financial entities reported 3,383 major ICT incidents during 2025. Around one-third had cross-border impact, the rate equaled 0.18 incidents per entity subject to DORA, and 10% were cybersecurity-related.
- Dependency complexity remains a major technical barrier. About 64% of open-source components in a typical audited codebase are transitive dependencies rather than components directly selected by developers. An application containing the current average of 1,180 components can create more than 695,000 potential component pairings for license analysis.
- Open-source maintenance debt is extremely high. In 2026 audit findings, 92% of codebases contained components at least 4 years out of date, 93% contained components showing no development activity for at least 2 years, and 92% contained components at least 10 versions behind current releases.
- Only 7% of audited open-source components were running the latest available version, while 41% were at least 10 versions behind. In addition, 68% of components were more than 2 years old. These numbers illustrate the remediation workload faced by SCA users after vulnerabilities are detected.
- AI software supply chains are creating a major new scanning surface. GitHub reported more than 4.3 million AI-related repositories in 2025, nearly double the level seen less than 2 years earlier. Around 1.1 million public repositories imported an LLM SDK, increasing 178% year-on-year, while AI projects attracted approximately 1.9 million contributions per month, up 76%.
- Enterprise AI adoption is rapidly increasing. Eurostat reported that 20.0% of EU enterprises used AI in 2025, up 6.5 percentage points from 13.5% in 2024. Adoption reached 55% among large enterprises versus approximately 19% among SMEs.
- Actual SCA scanning datasets are already operating at very large scale. Veracode’s 2025 State of Software Security analysis covered 1.3 million unique applications and 126.4 million raw security findings, including 15 million findings identified through Software Composition Analysis.
By Component
The Solution segment accounted for a 65.5% share of the Software Composition Analysis market, mainly because enterprises increasingly require automated platforms to manage software components at scale. As of August 2025, the U.S. National Vulnerability Database contained 312,387 CVE vulnerability records and 1,486,093 Common Platform Enumeration product records.
By 2026, the NVD dashboard reported more than 385,000 vulnerability records, including 30,699 critical and 77,546 high-severity vulnerabilities. This growing security workload makes manual software-component checks difficult for development teams. SCA solutions integrate with source-code repositories, CI/CD pipelines, container registries, and vulnerability databases to identify risky packages, monitor direct and indirect dependencies, review software licenses, and generate alerts before deployment.
CISA’s Known Exploited Vulnerabilities Catalog contained 1,422 vulnerabilities by 30 September 2025, highlighting the scale of actively exploited security risks. CISA’s SBOM guidance also requires detailed component information such as author, timestamp, component name, version, supplier, unique identifier, cryptographic hash, and dependency relationships. These requirements favor scalable SCA platforms over standalone services.
By Deployment Mode
The Cloud-based segment accounted for 58.1% of the Software Composition Analysis market, supported by growing demand for continuous software scanning across distributed development teams, applications, containers, and cloud workloads. Eurostat reported that 52.7% of EU enterprises used paid cloud computing services in 2025, increasing by 7.4 percentage points from 45.2% in 2023 and nearly three times the 17.8% recorded in 2014.
Among large enterprises, cloud adoption reached 84.7% in 2025. Of cloud-using EU companies, 85.2% used cloud services for email, 71.7% for office software, and 71.5% for file storage. Demand is also supported by advanced cloud workloads. In 2023, 75.3% of EU enterprises purchasing cloud services used advanced functions such as security software, hosted databases, and computing platforms for application development, testing, and deployment.
The OECD also reported that 49% of firms with 10 or more employees across member countries used cloud computing in 2023, with adoption ranging from 16% to 78%. These trends support cloud-based SCA adoption because it offers faster deployment, easier scaling, lower infrastructure requirements, centralized monitoring, and real-time visibility across software supply chains.
By Organization Size
The Large-Enterprise segment accounted for 59.4% of the Software Composition Analysis market, supported by the larger software environments, supplier networks, and compliance requirements of multinational companies. Eurostat reported that 81.5% of large EU enterprises had formal ICT-security policies or procedures in 2024, compared with 30.3% of small enterprises.
Around 75.6% of large enterprises conducted ICT risk assessments versus 29.4% of small firms, while 57.9% reviewed security policies within the previous 12 months, compared with 18.0% of small businesses. Large enterprises also showed high technology adoption, with 96.8% using strong authentication, 95.0% using backups in separate locations or the cloud, and 84.7% using paid cloud services.
These complex environments increase the need for continuous software-component monitoring. IBM reported that the global average cost of a data breach reached USD 4.44 million in 2025, while the U.S. average was USD 10.22 million. As large companies manage extensive application portfolios and third-party dependencies, SCA platforms help scan code.
By Industry Vertical
The BFSI segment led the Software Composition Analysis market with a 24.3% share, driven by the growing need to secure high-volume digital payment systems and financial applications. The U.S. Federal Reserve reported that non-cash payments reached 236.6 billion transactions in 2024, increasing by 31.9 billion from 2021.
Card payments represented 187.7 billion transactions, or 79% of the total, while Automated Clearing House payments processed USD 104.06 trillion in value. The EU Digital Operational Resilience Act became applicable on 17 January 2025 and covers 21 categories of financial entities, requiring stronger ICT risk management, incident reporting, resilience testing, and third-party oversight.
Germany’s Federal Financial Supervisory Authority estimates that DORA applies to more than 20,000 financial entities across Europe, including over 3,600 companies in Germany.
Key Market Segments
By Component
- Solution
- Services
By Deployment Mode
- Cloud-Based
- On-Premise
By Organization Size
- Small and Medium-Sized Enterprises
- Large Enterprises
By Industry Vertical
- BFSI
- IT and Telecommunications
- Healthcare
- Retail and E-Commerce
- Government
- Manufacturing
- Other
Geopolitical Impact Analysis
Geopolitical disruption affects the Software Composition Analysis (SCA) market mainly through changes in the cost, availability, and reliability of cloud and data-centre infrastructure. Although SCA solutions are delivered digitally, they depend on globally sourced servers, networking equipment, semiconductors, storage systems, power infrastructure, and cloud regions.
UNCTAD reported that Red Sea disruptions forced shipping companies to reroute vessels around the Cape of Good Hope. Shanghai-to-Europe container freight rates increased 256% between early November 2023 and 9 February 2024, reaching USD 2,648 per TEU. Higher transport costs and longer delivery times can increase the cost of servers, network equipment, and replacement parts used in data centres.
This can delay private-cloud and on-premises SCA deployments and encourage enterprises to adopt subscription-based cloud SCA platforms. Trade uncertainty and regional conflicts also increase software supply-chain risks. The World Trade Organization projected global merchandise trade volume to decline by 0.2% in 2025, compared with 2.9% growth in 2024, while commercial-services trade growth was expected to slow from 6.8% in 2024 to 4.0% in 2025.
As companies diversify suppliers and software providers, SCA tools become more important for checking unfamiliar libraries and dependencies. Energy volatility adds further pressure. The World Bank projected Brent crude prices at USD 66 per barrel in 2025 and USD 61 per barrel in 2026. However, a wider Middle East conflict could raise the 2025 average to USD 84 per barrel, around 15% above the baseline forecast, increasing data-centre and cloud operating costs.
Regional Analysis
North America dominated the Software Composition Analysis (SCA) market in 2025, accounting for a 36.7% share and generating approximately USD 187.1 million in revenue. Regional growth is supported by a strong presence of software companies, cloud providers, financial institutions, healthcare organizations, government agencies, and other technology-driven enterprises.
The United States remains the largest demand center due to high software development activity, wider DevSecOps adoption, and strong cybersecurity requirements. Canada also contributes significantly to regional growth. Statistics Canada reported that software development and computer services industries generated CAD 161.9 billion in operating revenue in 2024, increasing 8.5% from 2023.
Computing infrastructure, data processing, web hosting, and related services generated CAD 20.9 billion, rising 10.5% year-on-year. Canada’s ICT sector also contributed CAD 131.6 billion to GDP in 2024, representing 5.8% of national GDP.
Asia Pacific is expected to be the fastest-growing regional SCA market, supported by expanding cloud services, digital payments, cybersecurity regulations, and government digital programs. The International Telecommunication Union reported an average Global Cybersecurity Index score of 61 out of 100 in 2024 across Asia-Pacific economies, improving by 13 points from 2021.
Around 42% of countries had IoT regulations or standards, compared with the 30% global average, while 24% had cloud-computing strategies versus 21% globally. These trends increase demand for SCA tools to monitor third-party code, vulnerabilities, licenses, and software bills of materials.
Key Regions and Countries
North America
- US
- Canada
Europe
- Germany
- France
- The UK
- Spain
- Italy
- Rest of Europe
Asia Pacific
- China
- Japan
- South Korea
- India
- Australia
- Rest of APAC
Latin America
- Brazil
- Mexico
- Rest of Latin America
Middle East & Africa
- GCC
- South Africa
- Rest of MEA
Market Dynamics
Drivers
| Driver | (~) % CAGR | Geographic Relevance | Impact Timeline |
|---|---|---|---|
| Vulnerability-volume escalation | +3.0% | Global | Short term (2 years or less) |
| Secure software procurement | +2.2% | North America and Europe | Short term (2 years or less) |
| Cloud-native release expansion | +1.8% | Global | Medium term (2 to 4 years) |
| Financial-sector resilience spending | +1.4% | Europe and North America | Short term (2 years or less) |
| AI software governance | +1.1% | North America, Europe and Asia Pacific | Medium term (2 to 4 years) |
Vulnerability-volume escalation
NIST enriched nearly 42,000 CVE records in 2025, around 45% above its previous annual high, but this still failed to match the volume of new vulnerability submissions. In 2026, NIST moved the National Vulnerability Database toward risk-based enrichment, prioritizing actively exploited vulnerabilities, threats affecting U.S. federal systems, and vulnerabilities in critical software.
This shift strengthens demand for automated SCA platforms. CISA’s catalog contained 1,422 known exploited vulnerabilities by September 2025, while the NIST repository held more than 312,000 CVE records in August 2025. Growing vulnerability volumes encourage enterprises to automate component tracking, dependency mapping, exploitability analysis, and patch prioritization, supporting continuous monitoring, wider developer adoption, and recurring SCA subscriptions.
Restraints
| Restraint | (~) % CAGR | Geographic Relevance | Impact Timeline |
|---|---|---|---|
| Enterprise security-budget compression | -2.0% | Global | Short term (2 years or less) |
| Data-residency procurement barriers | -1.5% | Europe, Middle East and Asia Pacific | Medium term (2 to 4 years) |
| Long vendor approval cycles | -1.2% | Global | Short term (2 years or less) |
| Platform consolidation pressure | -1.0% | North America and Europe | Medium term (2 to 4 years) |
| Public-sector procurement constraints | -0.8% | North America and Europe | Medium term (2 to 4 years) |
Enterprise security-budget compression
Macroeconomic pressure can limit enterprise spending on SCA because software-security tools compete with cloud infrastructure, identity security, endpoint protection, AI investment, and compliance programs. The World Bank projected global economic growth of only 2.3% in 2025, the weakest non-recession pace since 2008, while global trade growth was expected to slow to 1.8%, from 3.4% in 2024. The IMF also projected global growth of 2.8% for 2025.
Slower economic conditions can extend procurement cycles and increase demand for bundled security platforms rather than standalone SCA tools. Mid-sized enterprises may delay purchases, wait for contract renewals, or select existing DevSecOps providers. This creates pricing pressure for SCA vendors, increases customer-acquisition costs, and can limit near-term expansion revenue despite growing software supply-chain security risks.
Challenges
| Challenge | (~) % CAGR | Geographic Relevance | Mitigation Horizon |
|---|---|---|---|
| False-positive remediation burden | -2.1% | Global | Medium term (2 to 4 years) |
| Security talent scarcity | -1.7% | Global | Long term (4 years or more) |
| Dependency graph complexity | -1.5% | Global | Medium term (2 to 4 years) |
| Fragmented software inventories | -1.3% | Global | Medium term (2 to 4 years) |
| Open-source maintainer risk | -1.0% | Global | Long term (4 years or more) |
False-positive remediation burden
A major operating challenge for SCA vendors is identifying which vulnerabilities are actually reachable, exploitable, and present in production. NIST’s 2026 risk-based NVD model highlights this issue by prioritizing only 3 categories for detailed enrichment: CISA known exploited vulnerabilities, federal-government software, and critical software.
The operational impact is significant. European Supervisory Authorities reported 3,383 major ICT incidents in 2025, equal to an average of 282 incidents per month. SCA providers therefore need stronger reachability analysis, runtime context, asset correlation, and automated remediation. Without these capabilities, high alert volumes can increase developer workload, reduce the value of vulnerability findings, and slow wider enterprise adoption.
Opportunities
| Opportunity | (~) % CAGR | Geographic Relevance | Execution Window |
|---|---|---|---|
| AI model supply-chain security | +3.2% | Global | Medium term (2 to 4 years) |
| Managed SCA services | +2.2% | Asia Pacific, Latin America and Middle East | Short term (2 years or less) |
| Embedded API-security monetization | +1.8% | North America and Europe | Medium term (2 to 4 years) |
| Industrial software assurance | +1.5% | Europe, North America and Asia Pacific | Long term (4 years or more) |
| SME compliance automation | +1.3% | Europe and Asia Pacific | Medium term (2 to 4 years) |
AI model supply-chain security
AI model supply-chain security represents a strong untapped opportunity as AI systems introduce new dependencies across models, datasets, prompts, containers, APIs, and model-serving infrastructure. In 2025, AI adoption reached 41.2% among large EU enterprises, compared with 12.6% among small and medium-sized enterprises, showing significant room for future adoption.
In 2026, CISA introduced AI SBOM minimum-elements guidance, encouraging organizations to combine standard SBOM practices with AI-specific transparency controls. Vendors that add model provenance, dataset tracking, malicious-model detection, and runtime policy checks can expand beyond traditional SCA. This could support a 10% to 20% increase in contract value where customers combine code, container, and AI governance within one security platform.
Key Players Analysis
The Software Composition Analysis (SCA) market is led by a Tier-1 group that includes Black Duck Software, Inc., Snyk Limited, Mend.io, Sonatype Inc., Veracode, Checkmarx Ltd., JFrog Ltd., OpenText Corporation, and Palo Alto Networks. Black Duck, Snyk, Mend, Sonatype, Veracode, and Checkmarx are estimated to collectively account for around 55–65% of specialized SCA spending, supported by strong vulnerability databases, policy engines, developer-security platforms, and enterprise customer bases.
OpenText has the largest overall corporate scale among listed vendors, reporting USD 5.168 billion in fiscal 2025 revenue, including USD 1.856 billion in cloud revenue and USD 4.191 billion in annual recurring revenue. It invested USD 755.9 million in R&D, equal to about 14.6% of revenue, while Cybersecurity Cloud represented 25% of total revenue.
Palo Alto Networks generated USD 9.2 billion in fiscal 2025 revenue, with USD 7.4 billion, or 80.5%, from subscription and support revenue, and invested USD 550.5 million in R&D.
JFrog remains a strong Tier-2 growth challenger, with fiscal 2025 revenue of USD 531.8 million, up 24%, and cloud revenue of USD 243.3 million, up 45%. R&D spending reached USD 195.1 million, or 36.7% of revenue, while JFrog Security represented 16% of ending remaining performance obligations versus 12% in 2024.
Top Key Players in the Market
- Black Duck Software, Inc.
- Open Text Corporation
- Mend.io
- Sonatype Inc.
- Veracode
- Snyk Limited
- JFrog Ltd
- Flexera Software
- Checkmarx Ltd.
- Palo Alto Networks, Inc.
Recent Developments
- In 2025, Palo Alto Networks completed its acquisition of Protect AI to expand AI and software-supply-chain security capabilities. The company also announced an approximately USD 25 billion agreement to acquire CyberArk, offering USD 45.00 in cash plus 2.2005 Palo Alto Networks shares for each CyberArk share, representing a 26% premium.
- In 2025, Checkmarx acquired Tromzo to expand autonomous application-security and remediation capabilities. Earlier in the year, Checkmarx One protected more than 865 large enterprises, exceeded USD 150 million in ARR, recorded more than 20% customer growth, and achieved more than 30% ARR growth through September 30, 2025.
Report Scope
| Report Features | Description |
|---|---|
| Market Value (2025) | USD 498.6 million |
| Forecast Revenue (2035) | USD 2,722.5 million |
| CAGR (2026-2035) | 18.5% |
| Base Year for Estimation | 2025 |
| Historic Period | 2020-2024 |
| Forecast Period | 2026-2035 |
| Report Coverage | Revenue Forecast, Market Dynamics, Competitive Landscape, Recent Developments |
| Segments Covered | By Component (Solution, Services); By Deployment Mode (Cloud-Based, On-Premise); By Organization Size (Small and Medium-Sized Enterprises, Large Enterprises); By Industry Vertical (BFSI, IT and Telecommunications, Healthcare, Retail and E-Commerce, Government, Manufacturing, Other) |
| Regional Analysis | North America – US, Canada; Europe – Germany, France, The UK, Spain, Italy, Rest of Europe; Asia Pacific – China, Japan, South Korea, India, Australia, Singapore, Rest of APAC; Latin America – Brazil, Mexico, Rest of Latin America; Middle East & Africa – GCC, South Africa, Rest of MEA |
| Competitive Landscape | Black Duck Software, Inc., Open Text Corporation, Mend.io, Sonatype Inc., Veracode, Snyk Limited, JFrog Ltd, Flexera Software, Checkmarx Ltd., Palo Alto Networks, Inc. |
| Customization Scope | Customization for segments and region/country-level will be provided. Moreover, additional customization can be done based on the requirements. |
| Purchase Options | We have three licenses to opt for: Single User License, Multi-User License (Up to 5 Users), Corporate Use License (Unlimited Users and Printable PDF) |





























