


Report Overview
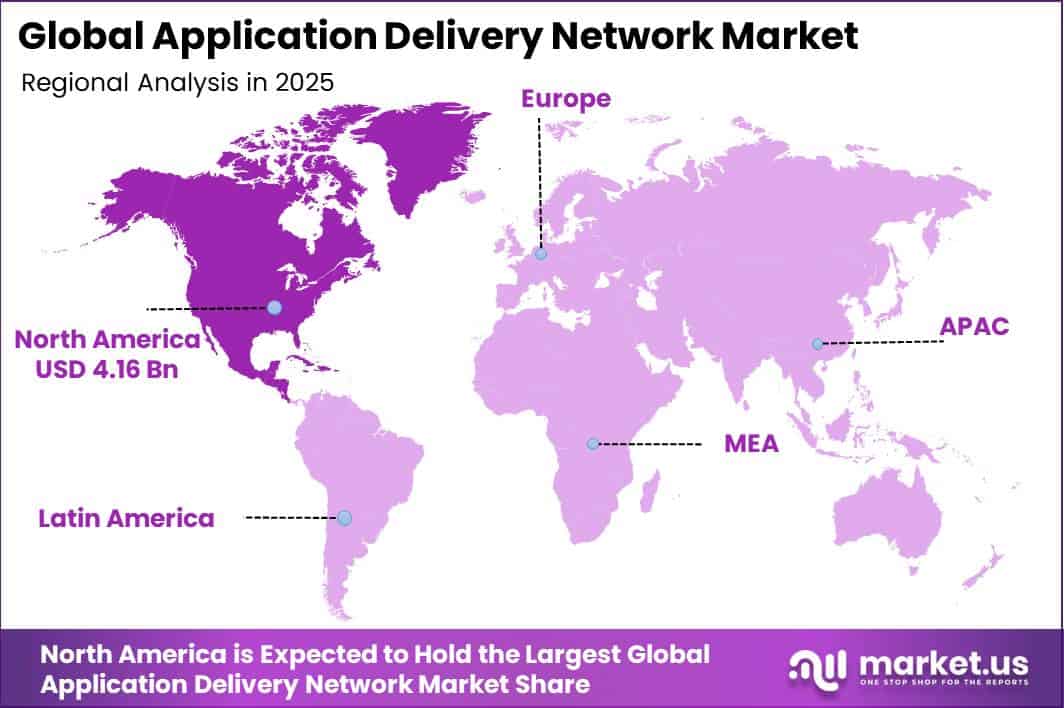
In 2025, the Global Application Delivery Network Market was valued at USD 10.9 billion. The market is projected to grow at a CAGR of 11.4% during 2026–2035, reaching approximately USD 32.1 billion by 2035. North America dominated the global market in 2025, accounting for more than 38.2% of the total market share and generating approximately USD 4.16 billion in revenue.
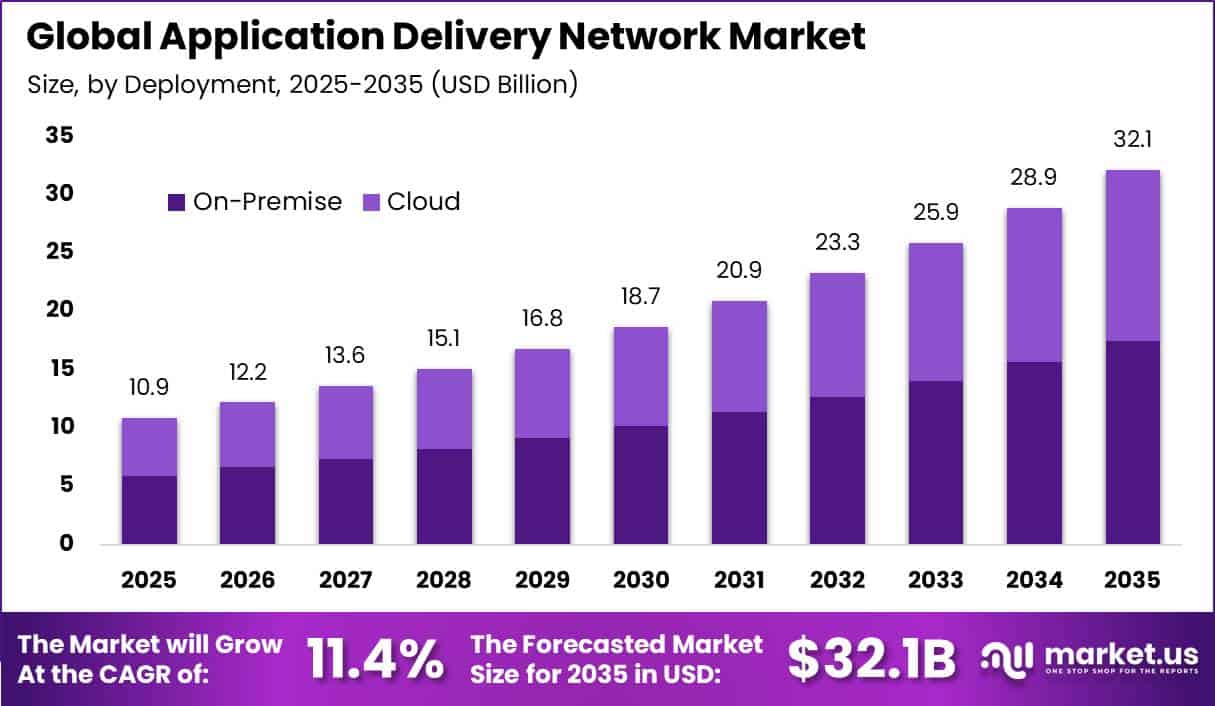
Market growth is being supported by increasing digital traffic, e-commerce transactions, cloud applications, and the growing need for secure and reliable access to business systems. ADN solutions help enterprises improve application speed, balance network traffic, reduce downtime, and protect web applications.
In the United States, retail e-commerce sales reached USD 316.1 billion in Q4 2025, representing 16.6% of total retail sales and increasing 5.3% compared with the same quarter in 2024. Rising transaction volumes are increasing demand for stable application delivery across retail, banking, logistics, and digital platforms.
The U.S. digital economy contributed USD 2.6 trillion, equal to 10.0% of national GDP, in 2022 and expanded by 6.3%. In June 2025, around 322.8 million Americans, or 93.9% of the assessed population, had access to fixed-wireline broadband speeds of at least 100/20 Mbps, while 327.1 million, or 95.2%, had access to qualifying 5G coverage. This strong connectivity base continues to support wider ADN deployment.
Key Takeaway
- The Application Delivery Network Market was valued at USD 10.9 billion in 2025 and is projected to reach USD 32.1 billion by 2035, growing at a CAGR of 11.4% during 2026–2035.
- The on-premise segment dominated deployment with a 54.3% share, driven by enterprises and governments prioritizing data control and security.
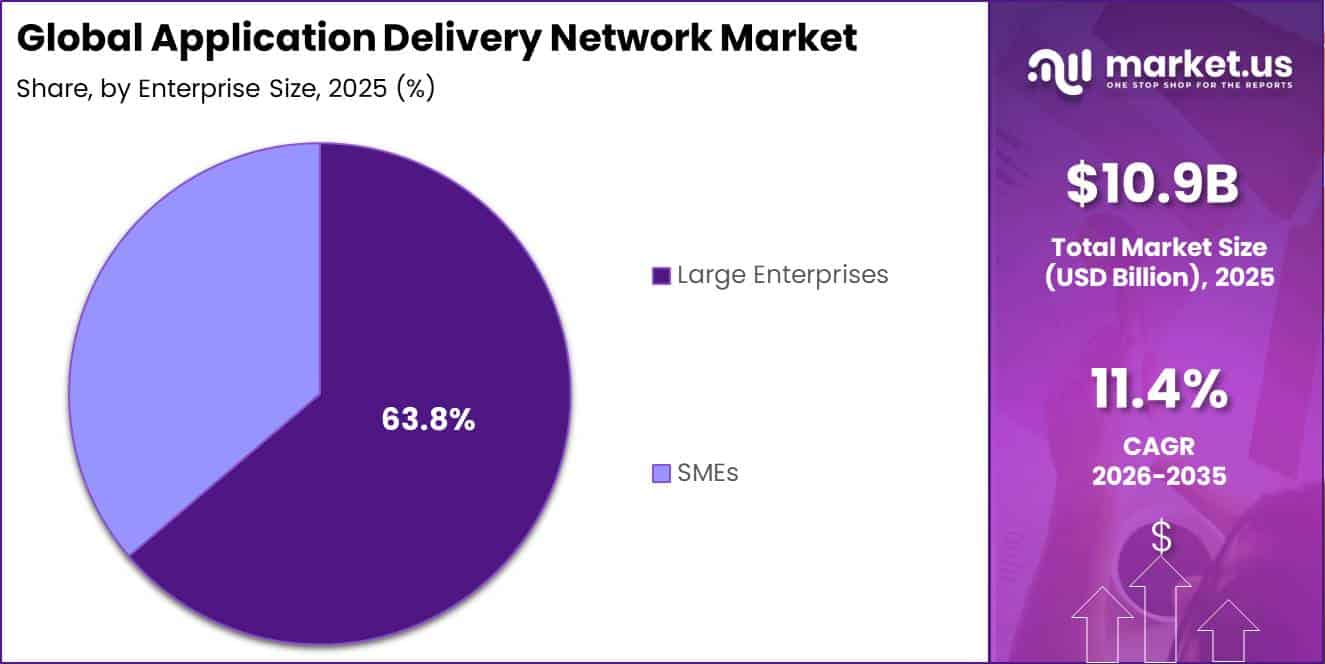
- Large enterprises accounted for 63.8% of the market by enterprise size, supported by complex multi-application environments.
- The IT and telecom vertical led end-user demand with a 29.2% share, fueled by rising internet usage and 5G expansion.
- North America led the market in 2025 with a 38.2% share, generating approximately USD 4.16 billion in revenue.
Market Statistics and Data Insights
- Global internet traffic increased by 19% during 2025. Cloudflare’s network handled more than 81 million HTTP requests per second on average and more than 129 million HTTP requests per second at peak, showing the scale of traffic that modern application-delivery infrastructure must manage.
- In 2025, 52.7% of EU enterprises purchased cloud-computing services, an increase of 7.4 percentage points from 2023. Among cloud users, 65.5% used security software, while 26.1% used cloud platforms for application development, testing, or deployment.
- Global 5G subscriptions reached 3.1 billion in the first quarter of 2026 after 162 million subscriptions were added during that quarter. 5G networks already carried 48% of global mobile-data traffic at the end of 2025.
- More than half of dynamic web traffic observed by Cloudflare in 2025 was API-related. Among automated API requests, Go-based clients accounted for 20%, Python represented 17%, and Java reached 11.2%.
- The UN E-Government Survey assessed all 193 UN Member States. The share of the global population lagging in digital-government development declined from 45.0% in 2022 to 22.4% in 2024, showing the rapid expansion of public digital infrastructure.
- Digital transactional government services are already widespread: 177 countries provided online business-registration services in 2024, while 173 offered online applications for business licences and 168 supported applications for government vacancies.
- Eurostat found that ERP adoption reached 89% among large EU enterprises in 2025 compared with 41% among small enterprises, producing a 48-percentage-point gap. Business-intelligence software adoption ranged from 11% among small firms to 69% among large firms.
- F5’s 2026 State of Application Strategy survey of more than 1,100 IT decision-makers found that 93% of organizations used hybrid multicloud strategies, 86% operated across public cloud, private cloud, and colocation environments, and 78% operated their own AI inference infrastructure.
- In the UK Cyber Security Breaches Survey 2025/2026, 43% of businesses identified a cyber breach or attack during the previous 12 months, equivalent to approximately 612,000 businesses. The rate increased to 69% among large businesses.
- Cybersecurity controls are becoming more common. In 2025/2026, 74% of UK businesses securely backed up data through cloud services, 47% required two-factor authentication, and 36% used VPNs for remote staff connections.
- Cloudflare found that more than half of web-request traffic originated from mobile devices in 117 countries or regions during 2025. Globally, iOS devices generated 35% of mobile-device traffic, while HTTP/3 already accounted for 21% of requests.
- Akamai’s 2026 survey of 1,840 security professionals found that 87% of organizations experienced an API-related security incident during the preceding 12 months, with organizations reporting an average of 3.5 incidents and an average cost exceeding USD 700,000 per incident.
By Deployment
In 2025, the On-premises segment held a dominant position in the Application Delivery Network market, capturing more than a 54.3% share. Large enterprises and government organizations continue to run critical applications within their own data centers to maintain stronger control over security, application traffic, and sensitive information. These systems include payment platforms, hospital applications, manufacturing controls, public-service portals, and legacy enterprise software.
NIST highlights that zero-trust architecture is especially important for organizations operating legacy applications and on-premises data centers. On-premises ADN solutions allow businesses to deploy load balancers, web application firewalls, and traffic-management systems close to internal applications, helping improve response time and strengthen access control. Cybersecurity concerns are also supporting this segment.
During 2025–2026, around 43% of UK businesses experienced a cyber breach or attack, while the figure reached 69% among large businesses. At the same time, the United Nations reported that 189 of 193 member states, equal to 98%, offered at least one assessed online public service in 2024. infrastructure.
By Enterprise Size
In 2025, Large Enterprises held a dominant position in the Application Delivery Network market, capturing more than a 63.8% share. Their leadership is supported by the large number of customer, employee, partner, and internal applications they manage across multiple offices, data centers, and cloud environments.
Eurostat reported that 89% of large EU enterprises used enterprise resource planning systems in 2025, compared with 41% of small enterprises, creating a 48-percentage-point difference. These systems manage finance, procurement, production, inventory, and workforce data, making fast and reliable application access essential.
ADN solutions help large organizations balance traffic, route users to available servers, and reduce service interruptions during periods of high demand. Cloud adoption is also strengthening demand for advanced ADN systems. In 2025, 52.7% of EU enterprises used paid cloud services. Among cloud users, 65.5% used security software, 45.5% used database hosting, and 26.1% used platforms for application development, testing, or deployment.
By End-user Vertical
In 2025, the IT and Telecom segment held a dominant position in the Application Delivery Network market, capturing more than a 29.2% share. This leadership is supported by the rapid growth of internet users, mobile traffic, cloud services, and data-intensive applications. The International Telecommunication Union estimated that 6.0 billion people, representing 74% of the global population, used the internet in 2025, with more than 240 million new users added within one year.
This expanding digital population is increasing demand for video streaming, online gaming, cloud software, enterprise collaboration, and AI-based applications. ADN solutions help telecom operators and IT service providers manage heavy application traffic, reduce delays, balance workloads, and maintain reliable service. The continued expansion of 5G networks is also strengthening demand.
Ericsson reported that global 5G subscriptions exceeded 3 billion in 2026, while 5G networks carried 48% of global mobile data traffic at the end of 2025. As faster networks increase the use of high-bandwidth services, telecom and IT companies require advanced traffic routing, application security, workload balancing, and failover capabilities, supporting continued ADN investment across the sector.
Key Market Segments
By Deployment
- On-Premise
- Cloud
By Enterprise Size
- SMEs
- Large Enterprises
By End-user Vertical
- IT and Telecom
- BFSI
- Healthcare
- Government
- Media and Entertainment
- Other
Geopolitical Impact Analysis
Geopolitical disruptions are increasing both the cost and strategic importance of Application Delivery Network infrastructure. ADN systems depend on servers, load balancers, network switches, security hardware, optical modules, and semiconductor components sourced through global supply chains. Disruptions in major shipping routes can delay hardware deliveries and raise deployment costs.
UN Trade and Development reported that Red Sea rerouting around the Cape of Good Hope added 12–20 days to affected voyages. By May 2025, shipping tonnage through the Suez Canal remained 70% below its 2023 average, while the Shanghai Containerized Freight Index averaged 2,496 points in 2024, increasing 149% year on year.
These conditions raise freight, insurance, inventory, and lead-time expenses for ADN hardware. Energy-market volatility is creating additional pressure. The International Energy Agency estimated that data centers consumed 485 TWh of electricity in 2025, with demand increasing 17% during the year, and consumption is expected to approach 950 TWh by 2030.
In the second quarter of 2026, Middle East tensions and LNG supply disruptions pushed average wholesale electricity prices in the European Union and Japan more than 30% higher year on year. Higher electricity costs increase operating expenses for servers, cooling equipment, security systems, and other always-on ADN infrastructure.
Regional Analysis
North America dominated the Application Delivery Network market, accounting for 38.2% of global revenue and generating approximately USD 4.16 billion. The region benefits from a strong presence of cloud providers, software companies, telecom operators, financial institutions, digital-content businesses, and large data centers.
These organizations use ADN solutions for application traffic management, load balancing, web security, and service availability across hybrid and multi-cloud environments. At the end of 2025, more than 50 GW of data-center capacity was operating in the United States, following a 24% compound annual growth rate since 2020.
Across the eight largest North American data-center markets, operating capacity reached 9,432 MW in 2025, increasing 36% year on year. Net absorption climbed to a record 2,497.6 MW, up 38% from 1,809.5 MW in 2024, while vacancy declined to only 1.4%.
Asia Pacific is emerging as the fastest-growing regional market, supported by data-center construction, 5G expansion, digital payments, and cloud adoption. The regional data-center development pipeline reached 19.4 GW in 2025, including 3.7 GW under construction and 15.7 GW in planning. Operational IT capacity increased by 13.8 GW during the year, with Malaysia and India contributing 58%.
Key Regions and Countries
North America
- US
- Canada
Europe
- Germany
- France
- The UK
- Spain
- Italy
- Rest of Europe
Asia Pacific
- China
- Japan
- South Korea
- India
- Australia
- Rest of APAC
Latin America
- Brazil
- Mexico
- Rest of Latin America
Middle East & Africa
- GCC
- South Africa
- Rest of MEA
Market Dynamics
Drivers
| Driver | (~) % CAGR | Geographic Relevance | Impact Timeline |
|---|---|---|---|
| AI workload traffic growth | +2.1% | Global, led by North America and Asia Pacific | Short term (2 years or less) |
| Multi-cloud application operations | +1.7% | North America, Europe, Asia Pacific | Short term (2 years or less) |
| API security adoption | +1.3% | Global enterprise markets | Medium term (2 to 4 years) |
| 5G edge-service rollout | +1.1% | Asia Pacific, North America, Europe | Medium term (2 to 4 years) |
| Digital public-service expansion | +0.8% | Asia Pacific, Europe, Middle East | Medium term (2 to 4 years) |
AI workload traffic growth
AI adoption is increasing the volume and complexity of application traffic across enterprise networks. In 2025, data-centre electricity demand increased by 17%, compared with around 3% growth in global electricity demand, while power use in AI-focused data centres is expected to triple by 2030.
At the same time, 6.0 billion people, or 74% of the global population, were online in 2025, increasing demand for AI-enabled search, software, video, and collaboration services. Cloud adoption is also supporting this trend, with 52.7% of EU enterprises using paid cloud services in 2025.
These workloads require traffic steering, load balancing, API protection, and automated failover across distributed infrastructure. As AI and cloud usage expands, these requirements could contribute an estimated +2.1% above the market’s 11.4% baseline CAGR.
Restraints
| Restraint | (~) % CAGR | Geographic Relevance | Impact Timeline |
|---|---|---|---|
| Data-centre power constraints | -1.8% | North America, Europe, Asia Pacific | Short term (2 years or less) |
| High appliance refresh cost | -1.2% | Global, especially cost-sensitive markets | Short term (2 years or less) |
| Enterprise budget deferrals | -0.9% | Europe, Latin America, Africa | Short term (2 years or less) |
| Data-sovereignty procurement limits | -0.8% | Europe, China, Middle East | Medium term (2 to 4 years) |
| Legacy contract lock-in | -0.6% | Global large enterprises | Medium term (2 to 4 years) |
Data-centre power constraints
Electricity availability is becoming a key constraint on ADN deployment because new servers, security appliances, and cooling systems depend on sufficient grid capacity. Data centres consumed around 485 TWh of electricity in 2025, with demand expected to reach about 950 TWh by 2030, nearly doubling within 5 years. In the EU, data-centre electricity use reached around 70 TWh in 2024 and could rise to 115 TWh by 2030.
The IEA also estimates that data centres, space cooling, and heat pumps could account for almost 50% of global electricity-demand growth through 2030. Delays in securing power connections can postpone data-centre projects and related ADN purchases, creating an estimated -1.8% drag against the market’s 11.4% baseline CAGR.
Challenges
| Challenge | (~) % CAGR | Geographic Relevance | Mitigation Horizon |
|---|---|---|---|
| Cybersecurity skills shortage | -1.4% | Global | Medium term (2 to 4 years) |
| Encrypted traffic visibility | -1.1% | Global enterprise markets | Medium term (2 to 4 years) |
| Multi-vendor integration complexity | -1.0% | North America, Europe, Asia Pacific | Medium term (2 to 4 years) |
| Semiconductor supply exposure | -0.7% | Global hardware deployments | Short term (2 years or less) |
| Distributed policy management | -0.6% | Global multi-cloud enterprises | Long term (4 years or more) |
Cybersecurity skills shortage
The shortage of skilled cybersecurity professionals is slowing ADN deployment, as organizations need trained staff to manage web application firewalls, traffic policies, APIs, and security incidents. In 2025, the UK cybersecurity workforce gap was around 3,800 professionals, compared with approximately 3,500 in the previous year. Cyber breaches or attacks also affected 43% of UK businesses during the preceding 12 months.
The skills shortage is becoming more important as digital connectivity expands. Around 2.2 billion people remained offline globally in 2025, meaning the connected attack surface could grow further as internet access increases. Limited cybersecurity talent raises implementation costs, extends deployment timelines, and could create an estimated -1.4% friction drag on the ADN market’s maximum growth potential.
Opportunities
| Opportunity | (~) % CAGR | Geographic Relevance | Execution Window |
|---|---|---|---|
| Managed ADN for mid-market | +1.9% | Global, led by Asia Pacific and Europe | Medium term (2 to 4 years) |
| Sovereign edge-service platforms | +1.5% | Europe, Middle East, Asia Pacific | Medium term (2 to 4 years) |
| AI-agent security services | +1.4% | North America, Europe, Asia Pacific | Short term (2 years or less) |
| Telco edge monetization | +1.2% | Asia Pacific, Middle East, North America | Long term (4 years or more) |
| Public-sector modernization bundles | +0.9% | Asia Pacific, Latin America, Africa | Medium term (2 to 4 years) |
Managed ADN for mid-market
Managed ADN represents a strong future opportunity as many medium-sized organizations still lack the staff and capital to maintain dedicated application-delivery infrastructure. In 2025, only 52.7% of EU enterprises used paid cloud services, leaving around 47.3% outside paid-cloud adoption.
ERP usage also reached 89% among large enterprises versus just 41% among small enterprises, creating a 48-percentage-point technology gap. Digital demand continues to expand, with more than 240 million additional internet users recorded in 2025.
Subscription-based ADN services can reduce large upfront hardware costs by offering recurring per-application or traffic-based pricing. Wider adoption through channel partners could potentially add around +1.9% above the market’s baseline 11.4% CAGR.
Key Players Analysis
Tier-1 competition in the Application Delivery Network market is led by F5, Akamai, Cisco, Broadcom/VMware, and Radware, supported by their strong positions in application delivery, security, cloud, and enterprise networking. F5 generated USD 3.09 billion in fiscal 2025 revenue, up 10% year on year, including USD 803.1 million from software and USD 705.6 million from systems.
The company invested USD 539.8 million in R&D, equal to about 17.5% of revenue. Akamai reported USD 4.21 billion in 2025 revenue, including USD 2.24 billion from security, up 10%, USD 708 million from cloud computing, up 12%, and USD 1.26 billion from delivery. F5 and Akamai together are estimated to represent 20–25% of ADN spending.
Cisco recorded USD 8.09 billion in FY2025 security revenue, up 59%, while investing USD 9.3 billion, or around 16% of revenue, in R&D. Broadcom generated USD 27.03 billion from infrastructure software in FY2025, up 26%, and spent USD 2.5 billion on related R&D.
Among Tier-2 players, A10 Networks reported USD 290.6 million in 2025 revenue, up 11%, with USD 69.1 million, or 23.8%, invested in R&D. Product revenue reached USD 167.1 million, while services contributed USD 123.5 million. Radware generated USD 301.9 million and invested USD 79.0 million, or 26.2%, in R&D.
Top Key Players in the Market
- Array Networks
- A10 Networks, Inc.
- Broadcom Inc. (Symantec Corporation)
- Cisco Systems Inc.
- Citrix Systems Inc.
- F5 Networks Inc.
- Kemp Technologies
- Avi Networks (VMware)
- Radware Corporation
- Akamai Technologies
- Barracuda Networks Inc.
Recent Developments
- In 2026, Akamai completed the acquisition of LayerX in July for approximately USD 205 million, strengthening its Zero Trust, enterprise-browser security, and AI usage-control capabilities. LayerX was expected to contribute approximately USD 10 million in annual recurring revenue by year-end.
- In 2026, A10 Networks acquired TrojAI Inc. in June, expanding its presence in AI-focused application and network security. A10 entered this expansion after generating record revenue of USD 290.6 million in 2025, representing growth of 11.0% from USD 261.7 million in 2024.
Report Scope
| Report Features | Description |
|---|---|
| Market Value (2025) | USD 10.9 Billion |
| Forecast Revenue (2035) | USD 32.1 Billion |
| CAGR (2026-2035) | 11.4% |
| Base Year for Estimation | 2025 |
| Historic Period | 2020-2024 |
| Forecast Period | 2026-2035 |
| Report Coverage | Revenue Forecast, Market Dynamics, Competitive Landscape, Recent Developments |
| Segments Covered | By Deployment (On-Premise, Cloud); By Enterprise Size (SMEs, Large Enterprises); By End-user Vertical (IT and Telecom, BFSI, Healthcare, Government, Media and Entertainment, Other) |
| Regional Analysis | North America – US, Canada; Europe – Germany, France, The UK, Spain, Italy, Rest of Europe; Asia Pacific – China, Japan, South Korea, India, Australia, Singapore, Rest of APAC; Latin America – Brazil, Mexico, Rest of Latin America; Middle East & Africa – GCC, South Africa, Rest of MEA |
| Competitive Landscape | Aruba Networks, A10 Networks Inc., Broadcom Inc. (Symantec Corporation), Cisco Systems Inc., Citrix Systems Inc., F5 Networks Inc., Kemp Technologies, Avi Networks (VMware), Radware Corporation, Akamai Technologies, Barracuda Networks Inc. |
| Customization Scope | Customization for segments and region/country-level will be provided. Moreover, additional customization can be done based on the requirements. |
| Purchase Options | We have three licenses to opt for: Single User License, Multi-User License (Up to 5 Users), Corporate Use License (Unlimited Users and Printable PDF) |





























