


Report Overview
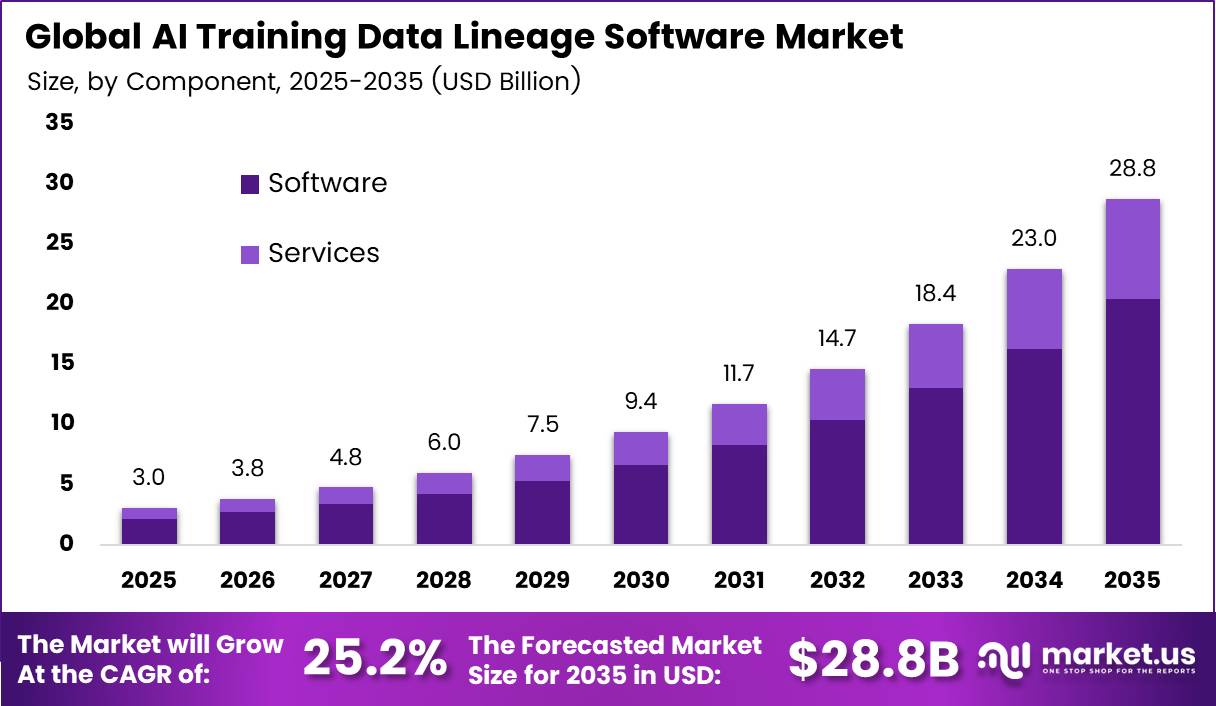
In 2025, the Global AI Training Data Lineage Software Market was valued at USD 3.0 billion. The market is projected to grow at a CAGR of 25.2% during 2026–2035, reaching approximately USD 28.8 billion by 2035. North America dominated the global market in 2025, accounting for more than 34.6% of the total market share and generating approximately USD 1.1 billion in revenue.
The rapid buildout of AI infrastructure drives this growth. The IEA reported that global investment in data centres nearly doubled since 2022 and reached about USD 500 billion in 2024. The IEA also expects data centre electricity use to more than double, from 415 TWh in 2024 to about 945 TWh by 2030. AI is the main driver. Power use in accelerated AI servers will grow about 30% each year.
North America region holds the world’s largest base of AI computing. The IEA reported that the United States made up 45% of global data centre electricity use in 2024, ahead of China at 25% and Europe at 15%. Large cloud providers, model developers, and data platform vendors are based in the region. Many of the listed key players also run their main offices there.
Key Takeaways
- The AI Training Data Lineage Software Market reached USD 3.0 billion in 2025 and will reach USD 28.8 billion by 2035. The market will grow at a CAGR of 25.2% from 2026 to 2035.
- Software leads the By Component segment with a 71.2% share.
- Cloud leads the By Deployment Model segment with a 71.2% share.
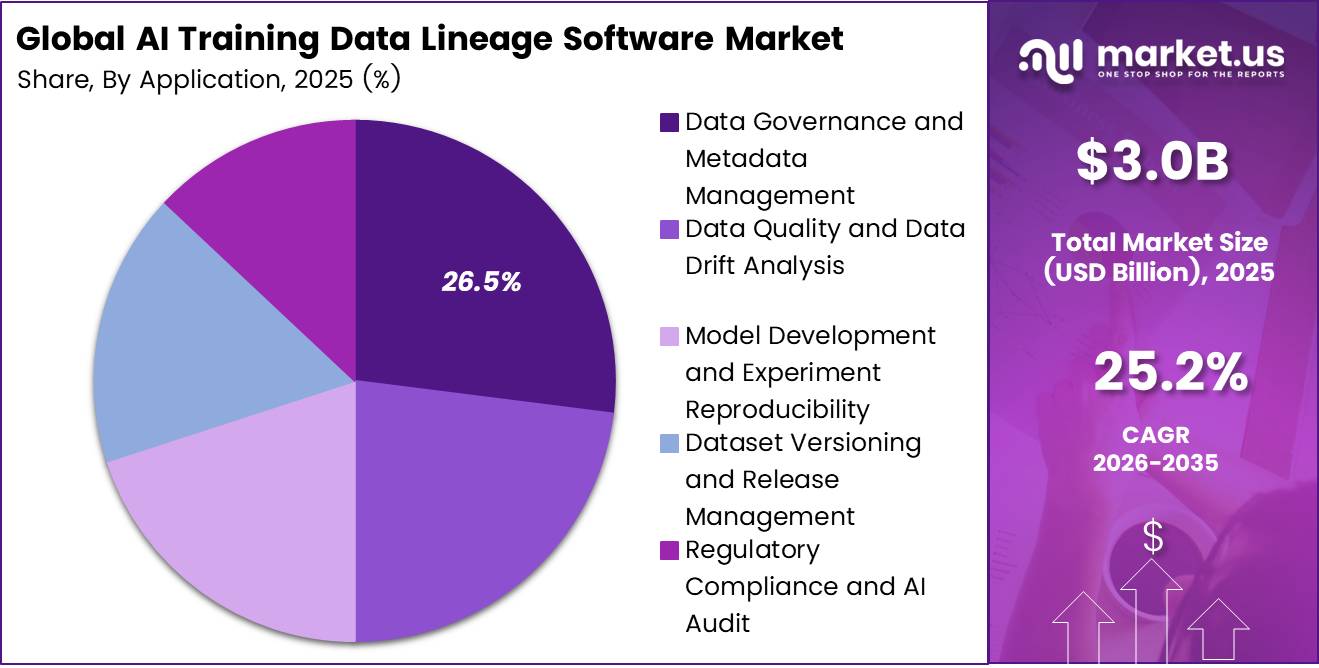
- Data Governance and Metadata Management leads the By Application segment with a 26.5% share.
- Text and Code leads the By Data Modality segment with a 32.4% share.
- IT and Telecommunication leads the By End User segment with a 24.1% share.
- North America dominates with a 34.6% share and USD 1.1 billion in revenue.
By Component
Software dominates with 71.2% due to automated tracking across complex training workflows.
Software leads because companies need a clear record of where training data comes from, how teams change it, and which models use it. Automated tools connect these records across data stores and development systems. They also help teams find missing records before problems spread.
IBM reported research, development, and engineering spending of $7.479 billion in 2024, up 10.4%, driven partly by investment in AI and hybrid cloud. This spending illustrates the wider push toward more advanced enterprise systems rather than lineage revenue itself.
By Deployment Model
Cloud dominates with 71.2% due to flexible access across distributed training teams.
Cloud leads because training teams often work across locations and need shared access to data records. A cloud platform lets them review changes, compare dataset versions, and trace model inputs through a common service. Buyers can expand storage and processing capacity as projects grow. They can also avoid building a separate tracking system for every team or business unit.
Eurostat reported that 45.2% of EU enterprises purchased cloud services in 2023, an increase of 4.2 percentage points from 2021. These figures measure broad cloud adoption, not training data lineage purchases. However, they show an established base of businesses that already buy computing services online.
Hybrid, the supplied fastest-growing deployment model, serves organizations that cannot move every dataset into a public cloud. They may keep sensitive records within company systems while using cloud resources for selected training tasks. A hybrid approach creates demand for tracking that crosses these boundaries without losing source details.
By Application
Data Governance and Metadata Management dominates with 26.5% due to clear ownership and searchable training records.
Data Governance and Metadata Management leads because companies must first understand their training data before they can control its use. Teams need to know who owns each dataset, what it contains, and which rules apply. A shared catalog brings these details together.
Eurostat found that 19.95% of EU enterprises used AI technologies in 2025, compared with 55.03% of large enterprises. These adoption figures show the breadth of activity that can create demand for stronger data oversight. Larger organizations often manage more teams and systems, making shared definitions and ownership records especially useful.
By Data Modality
Text and Code dominate with 32.4% due to widespread language and software development workloads.
Text and Code lead because many AI workflows depend on documents, written instructions, and software repositories. These materials often pass through repeated edits before teams add them to training datasets. Lineage tools can record their sources, permissions, changes, and links to later model versions.
Microsoft’s 2025 Annual Report stated that GitHub Copilot had more than 20 million users. The company also reported more than 100 million monthly active users across its commercial and consumer Copilot family. These figures show the scale of AI-assisted work, although they do not measure lineage adoption. That scale strengthens the case for reliable records behind language tools and software development systems.
By End User
IT and Telecommunications dominate with 24.1% due to extensive software and network data workflows.
IT and Telecommunications lead because these businesses manage software, network records, service data, and frequent system changes. Their AI teams need to trace how these inputs move through preparation and training. Clear records help developers compare model versions, investigate faults, and coordinate work across technical teams.
Microsoft reported cloud revenue of $168.9 billion in fiscal 2025, illustrating the scale of major technology platforms, not this market’s revenue. Separately, the FDA reported more than 1,600 AI-enabled medical devices authorized for US marketing as of September 2026. These measures describe different industries, but together they show substantial technology activity and a growing base of clinical AI products.
Key Market Segments
By Component
- Software
- Data Lineage and Provenance Software
- Metadata and Catalog Management Software
- Data Transformation and Pipeline Observability Software
- Governance, Audit and Compliance Software
- Services
By Deployment Model
- Cloud
- Hybrid
- On-premises
By Application
- Data Governance and Metadata Management
- Data Quality and Data Drift Analysis
- Model Development and Experiment Reproducibility
- Dataset Versioning and Release Management
- Regulatory Compliance and AI Audit
By Data Modality
- Text and Code
- Others
- Image and Video
- Audio and Speech
By End User
- IT and Telecommunication
- Healthcare and Life Sciences
- BFSI
- Automotive and Transportation
- Retail and E-Commerce
- Industrial Manufacturing
- Education and Research Institutions
- Others
Geopolitical Impact Analysis
Lineage software runs on AI hardware, so trade in that hardware shapes the market’s cost base. The WTO reported that trade in AI-enabling goods, such as semiconductors and servers, grew 16% in 2024, 31% in 2025, and 67% year on year in the first half of 2026. These goods made up 47% of global merchandise trade growth in that period.
This trade is highly concentrated. The WTO found that geographic concentration in AI goods trade is about twice as high as for total merchandise trade. It is also rising. Export controls or trade disputes between major chip producers and buyers can quickly raise GPU and server prices. That pushes up the cost of the compute that lineage, versioning, and observability platforms run on.
Conflict in the Middle East adds logistics risk. UNCTAD reported that Red Sea disruptions forced carriers around the Cape of Good Hope. The Shanghai to South Africa freight rate jumped about 199.6% to USD 5,426 per TEU between January and July 2024. Slower and costlier server deliveries delay data centre launches. Buyers then push back new lineage and governance rollouts.
Trade still held up. The WTO raised its 2026 merchandise trade volume forecast to 3.9%, up from 1.9% in March, because AI investment offset the Middle East shock. It expects global AI infrastructure spending to rise at least 30% in 2026. For vendors, this means strong demand, but with hardware cost swings that cloud buyers feel in their pricing.
Regional Analysis
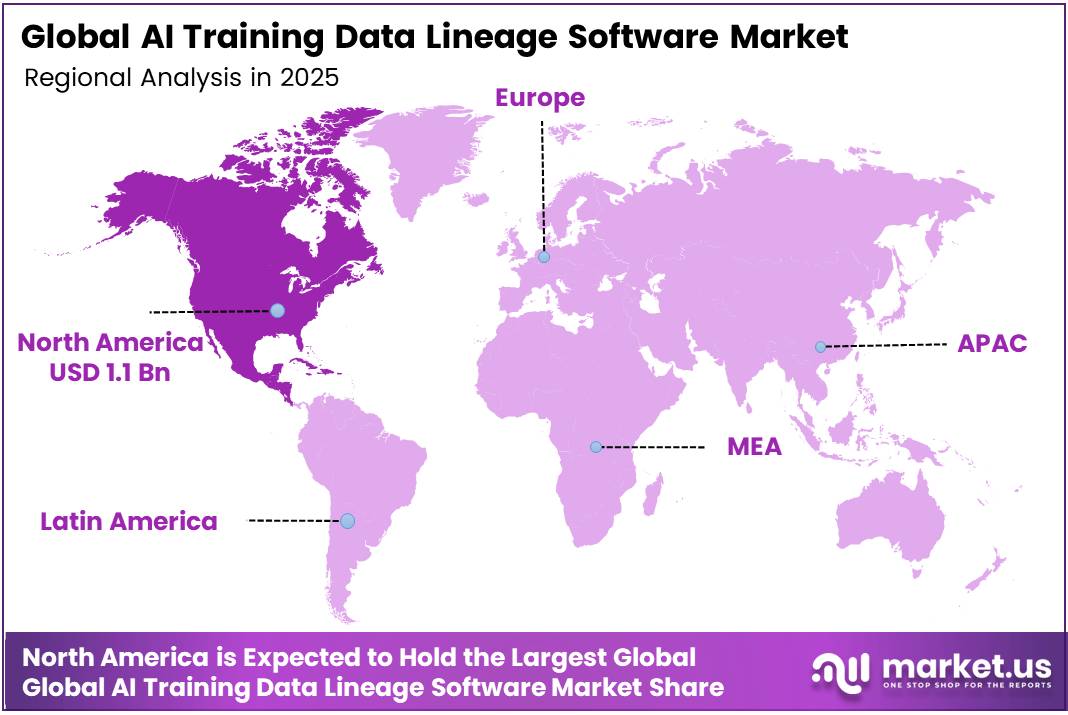
North America dominates the AI Training Data Lineage Software Market, holding a 34.6% share and generating USD 1.1 billion in revenue. The United States drives most of this demand. US companies run the largest AI model training programs, and they need lineage tools to track training sets across many teams and pipelines. Large enterprise deals show how much buyers value data governance.
Asia Pacific is the fastest-growing region in the market. China accounted for 25% of global data centre electricity use in 2024, according to the IEA, which makes it the second-largest compute base in the world. Japan, South Korea, and India keep adding cloud regions and AI programs. India’s large IT services sector builds data pipelines for global clients, which raises demand for lineage tracking.
Europe holds the second position. Strict privacy and AI rules drive demand for audit trails across training data. The IEA reported that Europe accounted for 15% of global data centre electricity use in 2024. Germany, France, and the UK lead adoption in banking, automotive, and healthcare. European buyers favor hybrid setups that keep sensitive data inside the region.
Key Regions and Countries
North America
- US
- Canada
Europe
- Germany
- France
- The UK
- Spain
- Italy
- Rest of Europe
Asia Pacific
- China
- Japan
- South Korea
- India
- Australia
- Rest of APAC
Latin America
- Brazil
- Mexico
- Rest of Latin America
Middle East and Africa
- GCC
- South Africa
- Rest of MEA
Market Dynamics
Drivers
| Driver | (~) % Impact on CAGR Forecast | Geographic Relevance | Impact Timeline |
|---|---|---|---|
| Mandatory training-content transparency | +1.3% | EU; global EU-facing providers | Short term (2 years or less) |
| Recurring enterprise fine-tuning cycles | +0.8% | North America; Europe; Asia-Pacific | Short term (2 years or less) |
| Training-data poisoning defenses | +0.6% | Global; security-sensitive enterprises | Short term (2 years or less) |
| Training-run reproducibility requirements | +0.5% | Global; production AI developers | Medium term (2 to 4 years) |
| Third-party dataset supplier assurance | +0.3% | Global; outsourced data procurement | Short term (2 years or less) |
Mandatory training-content transparency
The European Commission’s AI Office consultation ran from 30 July to 18 September 2024 and received more than 430 responses, establishing the groundwork for standardized training-content disclosure; according to the Commission’s implementation guidance, the resulting public-summary obligation began applying on 2 August 2025 for newly placed general-purpose AI models.
The estimated contribution is +1.3 percentage points, reflecting conversion of recurring reporting work into paid workflows rather than an institutionally measured market effect. Across all tables, percentage entries denote analyst-modeled percentage-point sensitivities to the supplied 25.2% baseline, not published forecasts.
Drivers total +3.5 points, restraints -2.5 points, challenges -2.0 points, and opportunities +2.5 points. Treating these as alternative deviations rather than automatically re-adding forces already embedded in the baseline yields a downside sensitivity of 20.7% and an upside sensitivity of 31.2%; these are scenario bounds, not independently validated forecasts.
Restraints
| Restraint | (~) % Impact on CAGR Forecast | Geographic Relevance | Impact Timeline |
|---|---|---|---|
| Unlawful personal-data processing restrictions | -0.9% | EEA; global EEA-facing developers | Short term (2 years or less) |
| Unfunded standalone software procurement | -0.6% | Global; smaller AI developers | Short term (2 years or less) |
| Incumbent platform bundle substitution | -0.4% | Global; platform-consolidated enterprises | Short term (2 years or less) |
| Contractual source-metadata access prohibitions | -0.3% | Global; proprietary dataset buyers | Short term (2 years or less) |
| Cloud-only deployment procurement exclusions | -0.3% | Sovereign; defense; classified environments | Short term (2 years or less) |
Unlawful personal-data processing restrictions
The EDPB identifies 2 anonymity conditions concerning insignificant likelihoods of extracting training-related personal data or obtaining it through queries. The EDPB also distinguishes 3 scenarios for subsequent processing after unlawful development, emphasizing case-specific assessment rather than an automatic ban on every affected model.
For an explicit analyst scenario, deferring 10% of privacy-exposed prospective annual bookings, with those bookings assumed to represent 20% of the qualified pipeline, shifts 2% of that pipeline out of the current conversion window. These are modeling assumptions, not EDPB statistics; their market-wide translation is conservatively limited to -0.9 percentage points.
Challenges
| Challenge | (~) % CAGR Friction Drag | Geographic Relevance | Mitigation Horizon |
|---|---|---|---|
| Fragmented lineage event semantics | -0.7% | Global; heterogeneous AI stacks | Medium term (2 to 4 years) |
| High-volume metadata processing overhead | -0.5% | Global; large training pipelines | Medium term (2 to 4 years) |
| Multimodal transformation attribution gaps | -0.4% | Global; image, audio and video developers | Long term (4 years or more) |
| Specialist implementation talent shortages | -0.2% | Global; emerging deployment hubs | Medium term (2 to 4 years) |
| Historical provenance reconstruction gaps | -0.2% | Global; legacy training estates | Long term (4 years or more) |
Fragmented lineage event semantics
Lineage products must reconcile incompatible representations of dataset versions, transformations and training runs across independently operated components. NIST’s Generative AI Profile identifies nontransparent upstream component integration as a value-chain risk.
In an analyst implementation scenario, an enterprise using 4 pipeline systems creates up to 6 pairwise interface relationships, whereas mapping each system to a canonical event model requires 4 primary adapters, reducing the simplified relationship count by approximately 33%; the actual effort depends on schema complexity and existing interfaces.
The modeled friction is therefore -0.7 percentage points, separate from the procurement hard stops under restraints. Long-term mitigation requires versioned event contracts, connector regression testing, and explicit coverage reporting so that implementation reuse, rather than customer-specific engineering, supports gross-margin improvement.
Opportunities
| Opportunity | (~) % Potential CAGR Upside | Geographic Relevance | Execution Window |
|---|---|---|---|
| Synthetic-data ancestry assurance services | +0.9% | Global; synthetic training-data ecosystems | Medium term (2 to 4 years) |
| Training-data royalty settlement infrastructure | +0.6% | North America; Europe; licensed-content hubs | Medium term (2 to 4 years) |
| Insurer-facing provenance underwriting feeds | +0.4% | Global; specialist insurance markets | Long term (4 years or more) |
| Acquisition due-diligence evidence rooms | +0.3% | Global; AI corporate transactions | Medium term (2 to 4 years) |
| Independent training-benchmark accreditation | +0.3% | Global; evaluation and research ecosystems | Long term (4 years or more) |
Synthetic-data ancestry assurance services
NIST’s Generative AI Profile warns that excessive reliance on synthetic training data can contribute to model collapse; NIST recommends assessing the proportion of synthetic versus non-synthetic data, and NIST separately advises checking that training data is not overly homogeneous or generated by AI.
In an explicitly analyst-designed unit-economic scenario, reusable ancestry manifests could reduce analyst handling time per assessed batch by 20%; if that labor accounts for 30% of service delivery cost, total delivery cost falls by 6%, before additional verification expenses. At an assumed initial gross margin of 60% and unchanged pricing, that cost reduction increases gross margin to 62.4%, a gain of 2.4 percentage points.
Conditional on demonstrable buyer willingness to pay and independently validated checks, subscription-plus-batch pricing could capture adjacent assurance spending and contribute an estimated +0.9 percentage points above baseline growth without relying on any stated market-size figure.
Key Players Analysis
Informatica Inc. leads Tier 1. It reported total revenue of USD 1.64 billion in FY2024, up 3% year-on-year, and total ARR of USD 1.73 billion. Its FY2024 10-K states that it spends over USD 300 million a year on research and development, which is about 18% of revenue. It had over 1,750 R&D staff. Salesforce bought the company for about USD 8 billion in equity value, at USD 25 per share in cash.
Collibra NV and Alation, Inc. join Informatica in Tier 1, based on their enterprise catalog and governance footprints. Both firms are private and do not publish audited revenue. That limits direct comparison.
Tier 2 challengers compete in niche areas. Atlan Pte. Ltd. raised USD 105 million at a USD 750 million valuation for its data and AI governance control plane. Acryl Data, Inc. raised USD 35 million in Series B funding, bringing its total to USD 65 million. Its revenue grew more than sixfold over two years.
Encord, Inc. raised USD 60 million in Series C funding led by Wellington Management to scale its AI data infrastructure. Monte Carlo Data, Bigeye, lakeFS, Dataloop, Ataccama, and Data. compete in observability, data versioning, and data quality.
Top Key Players in the Market
- Acryl Data, Inc.
- Alation, Inc.
- Ataccama Corporation
- Atlan Pte. Ltd.
- Bigeye, Inc.
- Collibra NV
- Data.World, Inc.
- Dataloop Ltd.
- Encord, Inc.
- Informatica Inc.
- lakeFS Ltd.
- Monte Carlo Data, Inc.
Recent Developments
- In May 2025, Acryl Data, Inc. raised USD 35 million in Series B funding led by Bessemer Venture Partners, bringing total funding for its DataHub metadata platform to USD 65 million.
- In May 2025, Salesforce agreed to acquire Informatica Inc. for about USD 8 billion in equity value, paying USD 25 per share in cash.
- In February 2026, Encord, Inc. announced USD 60 million in Series C funding led by Wellington Management to scale its AI-native data infrastructure for physical AI.
Report Scope
| Report Features | Description |
|---|---|
| Market Value (2025) | USD 3.0 billion |
| Forecast Revenue (2035) | USD 28.8 billion |
| CAGR (2026-2035) | 25.2% |
| Base Year for Estimation | 2025 |
| Historic Period | 2020-2024 |
| Forecast Period | 2026-2035 |
| Report Coverage | Revenue Forecast, Market Dynamics, Competitive Landscape, Recent Developments |
| Segments Covered | By Component (Software, Data Lineage and Provenance Software, Metadata and Catalog Management Software, Data Transformation and Pipeline Observability Software, Governance, Audit and Compliance Software, Services); By Deployment Model (Cloud, Hybrid, On-premises); By Application (Data Governance and Metadata Management, Data Quality and Data Drift Analysis, Model Development and Experiment Reproducibility, Dataset Versioning and Release Management, Regulatory Compliance and AI Audit); By Data Modality (Text and Code, Others, Image and Video, Audio and Speech); By End User (IT and Telecommunication, Healthcare and Life Sciences, BFSI, Automotive and Transportation, Retail and E-Commerce, Industrial Manufacturing, Education and Research Institutions, Others) |
| Regional Analysis | North America – US, Canada; Europe – Germany, France, The UK, Spain, Italy, Rest of Europe; Asia Pacific – China, Japan, South Korea, India, Australia, Singapore, Rest of APAC; Latin America – Brazil, Mexico, Rest of Latin America; Middle East & Africa – GCC, South Africa, Rest of MEA |
| Competitive Landscape | Acryl Data, Inc., Alation, Inc., Ataccama Corporation, Atlan Pte. Ltd., Bigeye, Inc., Collibra NV, Data.World, Inc., Dataloop Ltd., Encord, Inc., Informatica Inc., lakeFS Ltd., Monte Carlo Data, Inc. |
| Customization Scope | Customization for segments and region/country-level will be provided. Moreover, additional customization can be done based on the requirements. |
| Purchase Options | We have three licenses to opt for: Single User License, Multi-User License (Up to 5 Users), Corporate Use License (Unlimited Users and Printable PDF) |





























