


Report Overview
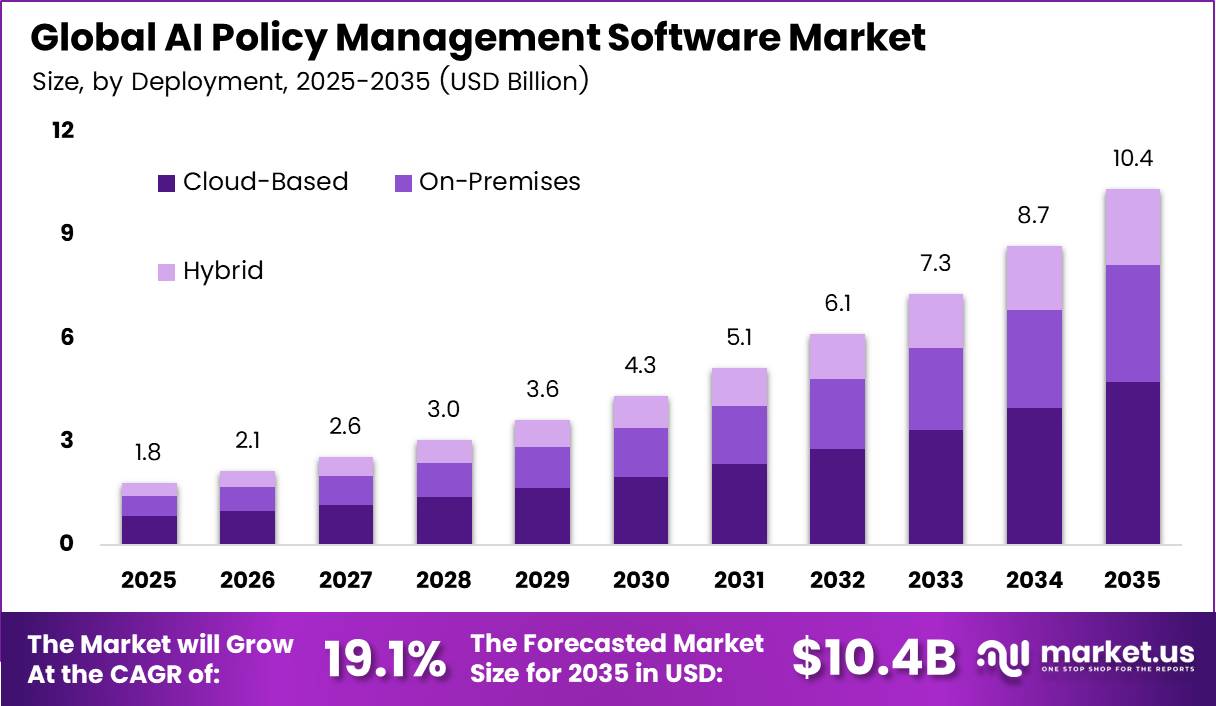
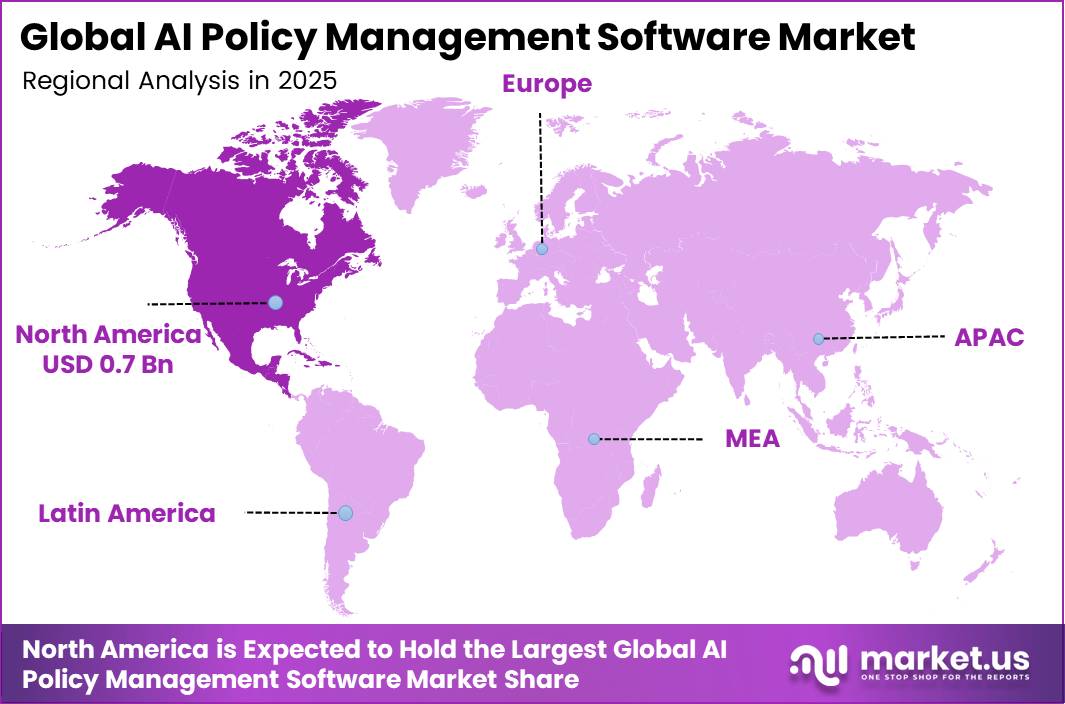
In 2025, the Global AI Policy Management Software Market was valued at USD 1.8 billion. The market is projected to grow at a CAGR of 19.1% during 2026–2035, reaching approximately USD 10.4 billion by 2035. North America dominated the global market in 2025, accounting for more than 42.0% of the total market share and generating approximately USD 0.7 billion in revenue.
Firms buy this software to set rules for AI use, track models, and prove compliance. New rules drive this demand. The European Commission states that the EU AI Act allows fines of up to EUR 35 million or 7% of global turnover for banned AI practices. AI use is also spreading fast.
The ITU reported that 5.5 billion people, or 68% of the world, used the internet in 2024. This gives AI tools a huge user base that needs control. The WTO reported that trade in AI goods rose 20% in the first half of 2025. Each new AI system adds to the need for policy, audit, and risk tools.
North America region has the largest base of AI buyers and vendors. Microsoft reported Microsoft Cloud revenue of USD 168.9 billion in FY2025, up 23%. Large cloud spending like this brings AI into daily business work, and each use needs rules.
The US Office of Management and Budget issued memo M-25-21 in April 2025. It requires federal agencies to name Chief AI Officers and keep AI use case lists. Canada set aside CAD 2.4 billion for AI in its Budget 2024. Both moves push public and private buyers toward formal AI governance tools.
Key Takeaways
- The Global AI Policy Management Software Market reached USD 1.8 billion in 2025 and will hit USD 10.4 billion by 2035. The market will grow at a CAGR of 19.1% from 2026 to 2035.
- By Component, Software leads with a 62.0% share, while Services grows fastest.
- By Deployment Mode, Cloud-Based leads with a 61.0% share, while Hybrid grows fastest.
- By Organization Size, Large Enterprises lead with a 73.0% share, while SMEs grow fastest.
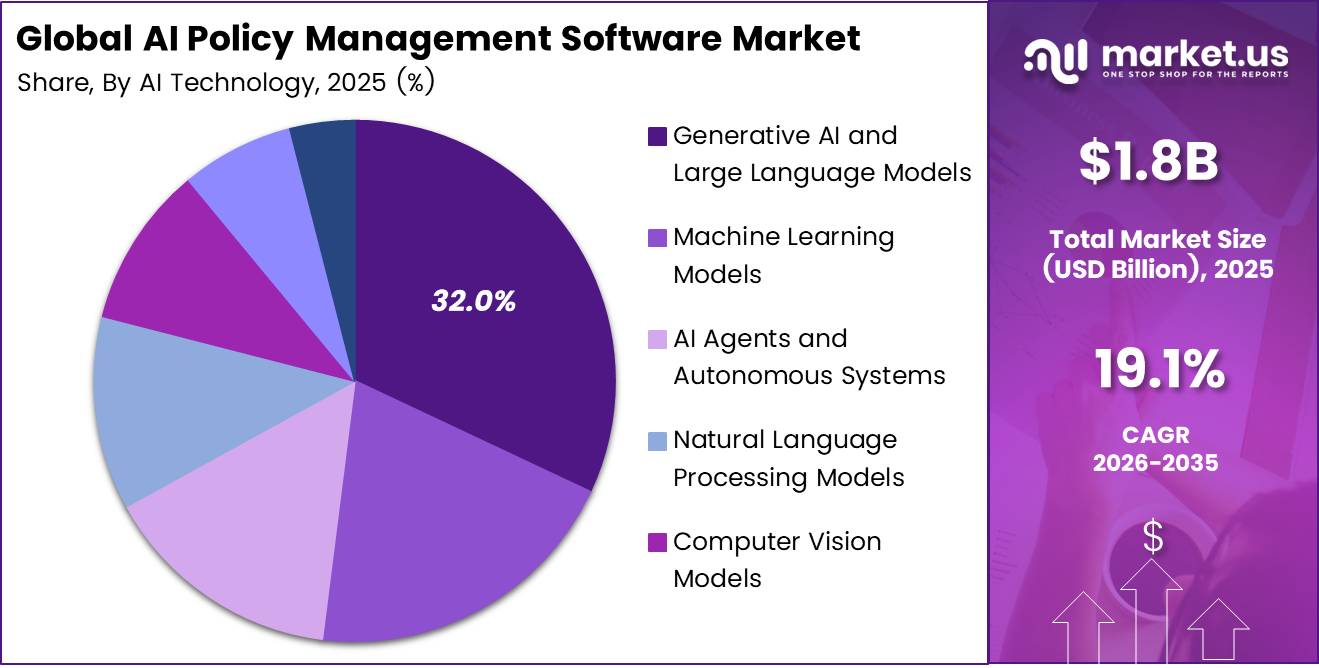
- By AI Technology, Generative AI and Large Language Models lead with a 32.0% share, while AI Agents and Autonomous Systems grow fastest.
- By End-Use Industry, IT and Telecommunications lead with a 24.0% share, while Healthcare and Life Sciences grow fastest.
- North America leads with a 42.0% share and USD 0.7 billion in revenue.
By Component
Software dominates with 62.0% due to automated rule checks across AI systems.
Software leads in the supplied share because companies need a repeatable way to apply AI rules across teams, models, and business tools. Central platforms help users record model details, assign owners, check access, and keep evidence for reviews.
IBM reported software revenue of $27.085 billion in 2024 and growth of 8.3%, showing wider demand for enterprise software, not the size of this specific market. Its annual filing also describes watsonx products that help companies govern AI models throughout their life cycle. Services offer a credible growth opportunity as buyers move from buying tools to making them work within existing processes.
Advisers can help teams write policies, map risks, connect systems, and train staff. IBM reported consulting signings growth of 3.3% in 2024, which provides broader context for this delivery work. However, the supplied data and approved sources do not establish that services grow fastest within AI policy management.
By Deployment Mode
Cloud-Based dominates with 61.0% due to shared controls and rapid software updates.
Cloud-Based deployment holds the leading share because it lets companies manage AI policies through a shared service without building every supporting system themselves. Teams can update rules centrally, add users, and connect new AI tools as business needs change. Eurostat reported that 45.2% of EU enterprises purchased cloud services in 2023, while cloud purchasing increased by 4.2 percentage points from 2021.
IBM’s annual filing identifies hybrid cloud and AI as linked areas of business investment. That connection supports demand for policies that cover both settings. However, neither the input nor these sources confirms hybrid as the fastest-growing deployment mode. Its growth case rests on helping buyers manage mixed systems without forcing every workload into the same location.
By Organization Size
Large Enterprises dominate with 73.0% due to complex oversight across many business units.
Large Enterprises lead in the supplied share because they manage more AI systems, business units, suppliers, and approval steps than smaller firms. Their scale creates a stronger need for shared policy records, clear ownership, and consistent checks.
Larger budgets also help them fund dedicated legal, security, and risk teams that can support software purchases. Eurostat found that 41.17% of large EU enterprises used AI in 2024, compared with 11.21% of small enterprises and 20.97% of medium enterprises. These adoption figures support the link between business size and governance needs, although they do not measure policy software revenue.
By AI Technology
Generative AI and Large Language Models dominate with 32.0% due to widespread text generation and data exposure.
Generative AI and Large Language Models hold the leading share because they bring policy questions directly into everyday work. Employees use these tools to draft text, search information, and assist customers, which creates a need to control inputs, review outputs, and define acceptable use. Microsoft’s 2025 annual report states that Azure AI Foundry offers access to more than 11,000 models and that 80% of Fortune 500 companies use Foundry for AI workloads.
These figures cover its wider AI platform rather than this technology group alone, but they show the scale and variety that governance teams must handle. AI Agents and Autonomous Systems present a strong growth opportunity because they can move beyond producing answers toward taking actions within business processes. Policy tools therefore need to check permissions, set action limits, and identify when people must approve decisions.
By End-Use Industry
IT and Telecommunications dominate with 24.0% due to extensive AI use across digital operations.
IT and Telecommunications lead in the supplied share because digital businesses develop, supply, and use AI across many connected services. They need common rules for internal tools, customer applications, and supplier models. Frequent product changes also create a continuing need to review access, information handling, and model use.
OECD data show that AI adoption reached almost 45% among firms in the information and communications technology sector in 2024. That figure provides adoption context rather than a measure of policy software sales. Banking, Financial Services, and Insurance offers a strong growth case because AI can influence decisions that affect customers, financial losses, and business trust.
The Bank of England and Financial Conduct Authority found that 75% of surveyed financial firms used AI in 2024. They also reported that 55% of AI use cases involved some automated decision-making. Such activity creates practical demand for records, human review, and clear decision limits.
Key Market Segments
By Component
- Software
- Services
By Deployment Mode
- Cloud-Based
- On-Premises
- Hybrid
By Organization Size
- Large Enterprises
- Small and Medium-Sized Enterprises (SMEs)
By AI Technology
- Generative AI and Large Language Models
- Machine Learning Models
- AI Agents and Autonomous Systems
- Natural Language Processing Models
- Computer Vision Models
- Predictive Analytics and Decision Intelligence Models
- Others
By End-Use Industry
- IT and Telecommunications
- Banking, Financial Services, and Insurance (BFSI)
- Healthcare and Life Sciences
- Government and Public Sector
- Manufacturing
- Energy and Utilities
- Media and Entertainment
- Other
Geopolitical Impact Analysis
AI policy software runs on cloud servers, chips, and network gear. Trade tensions raise the cost of this base layer. The WTO noted that higher US tariffs took effect in August 2025, on top of a baseline reciprocal tariff of 10%. The WTO expects world goods trade growth to drop from 2.4% in 2025 to just 0.5% in 2026. Vendors that host governance tools pay more for servers, and they pass part of that cost into subscription prices.
Chip supply faces direct pressure. AI goods such as chips, servers, and telecom gear drove nearly half of trade growth in the first half of 2025, according to the WTO. China placed export controls on gallium and germanium. Both metals go into chips and fiber optics. Supply limits push up the cost of the data centre gear that runs model monitoring and audit tools.
Shipping routes add delay. UNCTAD reported that Suez Canal transits fell by more than 50% after Red Sea attacks. Ships that reroute around the Cape of Good Hope add 10 to 14 days to Asia-to-Europe trips. Server and network hardware for new European and Middle East data centres arrives later. This slows on-premises and hybrid rollouts.
Energy prices shape hosting costs. The IEA estimates that data centres used about 415 TWh of power in 2024, a figure that could reach about 945 TWh by 2030. Conflict-driven gas price swings in Europe raise hosting bills. Data rules also split markets. Vendors must build local data centres to meet sovereignty rules, and this raises CapEx per region.
Regional Analysis
North America dominates the AI Policy Management Software Market, holding a 42.0% share and generating USD 0.7 billion in revenue. The region hosts most of the top vendors in this market. California and New York added rules on automated decisions and model safety. Banks face model risk rules under Federal Reserve guidance SR 11-7, which covers AI and machine learning models.
The FDA has cleared more than 1,000 AI-enabled devices. Canada adds to regional demand. Its Pan-Canadian AI Strategy and federal rules on automated decisions require impact checks for public sector AI. Large firms in both countries now set up AI ethics boards and need tools to track every model.
Asia Pacific is the fastest-growing region in this market. India approved the IndiaAI Mission with INR 10,372 crore in funding. China enforces interim rules on generative AI that require security reviews and algorithm filings. Japan passed its AI Promotion Act in 2025. South Korea passed its AI Basic Act, which takes effect in January 2026. Australia released voluntary AI safety standards with 10 guardrails.
Key Regions and Countries
North America
- US
- Canada
Europe
- Germany
- France
- The UK
- Spain
- Italy
- Rest of Europe
Asia Pacific
- China
- Japan
- South Korea
- India
- Australia
- Rest of APAC
Latin America
- Brazil
- Mexico
- Rest of Latin America
Middle East and Africa
- GCC
- South Africa
- Rest of MEA
Market Dynamics
Drivers
| Driver | (~) % Impact on CAGR Forecast | Geographic Relevance | Impact Timeline |
|---|---|---|---|
| Statutory Compliance Activation | +1.2% | Europe with global extraterritorial effects | Short term (2 years or less) |
| Enterprise AI Estate Expansion | +0.8% | Global, led by advanced digital economies | Short term (2 years or less) |
| Executive Accountability Structures | +0.6% | North America, Europe, and developed APAC | Short term (2 years or less) |
| Cross-Functional GRC Consolidation | +0.5% | Global large enterprises | Medium term (2 to 4 years) |
| Third-Party Model Scrutiny | +0.4% | Global regulated industries | Medium term (2 to 4 years) |
Statutory Compliance Activation
The root cause is the conversion of voluntary AI governance into enforceable operating obligations: the European Commission records the EU AI Act entering force on 1 August 2024, general-purpose AI obligations applying from 2 August 2025, and enforcement and transparency requirements beginning on 2 August 2026. Demand density is rising simultaneously.
Eurostat measured EU enterprise AI use at 13.5% in 2024 and 20.0% in 2025, while the OECD measured firm adoption at 20.2% in 2025 versus 14.2% in 2024. These milestones support the estimated +1.2% CAGR contribution because every governed system creates recurring inventory, policy-mapping, documentation, incident, disclosure, and audit-evidence workflows.
Commercially, the requirement shifts spending from episodic legal assessments toward multi-year SaaS control planes, improving recurring-revenue visibility and renewal durability, while the stated 19.1% baseline already incorporates most near-term compliance-led adoption.
Restraints
| Restraint | (~) % Impact on CAGR Forecast | Geographic Relevance | Impact Timeline |
|---|---|---|---|
| SME Budget Thresholds | -0.9% | Global, strongest in midmarket and emerging economies | Short term (2 years or less) |
| Data Sovereignty Restrictions | -0.6% | Europe, China, India, and Middle East | Medium term (2 to 4 years) |
| Procurement Liability Deadlocks | -0.5% | North America and Europe | Short term (2 years or less) |
| Legacy GRC Budget Lock-In | -0.4% | North America and Europe | Medium term (2 to 4 years) |
| Services-Heavy Deployment Economics | -0.3% | Global midmarket | Medium term (2 to 4 years) |
SME Budget Thresholds
The structural barrier is the mismatch between fixed governance implementation costs and smaller buyers’ limited software, legal, and security budgets: OECD data show that 40.0% of large firms used AI in 2024, compared with 20.4% of medium-sized firms and 11.9% of small firms.
Eurostat recorded a similarly wide 2025 gap, with AI adoption at 55.03% among large EU enterprises but only 17.0% among small enterprises. The IMF further estimates that a one-standard-deviation rise in economic-policy uncertainty can reduce investment by approximately 2.0%, with the effect peaking after roughly 2 years, reinforcing discretionary software deferrals.
This supports a near-term -0.9% CAGR deduction as SMEs postpone purchases or restrict deployments to pilots; vendors consequently absorb onboarding and advisory labor across smaller contracts, compressing gross margins and delaying customer CapEx conversion into recurring subscriptions.
Challenges
| Challenge | (~) % CAGR Friction Drag | Geographic Relevance | Mitigation Horizon |
|---|---|---|---|
| Unreliable AI Asset Inventories | -0.8% | Global enterprises and public institutions | Medium term (2 to 4 years) |
| Scarce Governance Talent | -0.5% | Global, strongest in emerging economies | Long term (4 years or more) |
| Continuous Model Drift | -0.4% | Global model-intensive industries | Long term (4 years or more) |
| Multijurisdiction Rule Mapping | -0.3% | Multinational enterprises | Long term (4 years or more) |
| Shadow AI Discovery | -0.2% | Global knowledge-work sectors | Medium term (2 to 4 years) |
Unreliable AI Asset Inventories
The structural vulnerability begins with incomplete ownership, lifecycle, risk-classification, and data-lineage records: the U.S. Office of Management and Budget required agencies to maintain annual AI use-case inventories and gave agency heads 60 days to designate accountable AI officers in 2024.
The U.S. Government Accountability Office found that 20 of 23 agencies reported approximately 1,200 current or planned AI use cases, yet only 5 of the 20 reporting agencies supplied comprehensive information across every use case.
The same institution subsequently found reported federal AI use cases rising from 571 in 2023 to 1,110 in 2024, while a separate assessment found that one agency had fully implemented only 4 of 11 selected accountability practices and had misclassified 1 of 2 cybersecurity inventory entries. The resulting reconciliation, remediation, and human-validation workload produces an estimated -0.8% friction drag without halting purchases.
Opportunities
| Opportunity | (~) % Potential CAGR Upside | Geographic Relevance | Execution Window |
|---|---|---|---|
| Machine-Readable Assurance Exchange | +0.8% | Global regulated industries | Medium term (2 to 4 years) |
| Agentic AI Control Plane | +0.6% | Global advanced AI markets | Medium term (2 to 4 years) |
| Regulated-Vertical Control Packs | +0.4% | Healthcare, finance, and critical infrastructure globally | Medium term (2 to 4 years) |
| Risk-Insurance Integrations | +0.3% | Developed insurance markets | Long term (4 years or more) |
| Assurance-Tool Roll-Ups | +0.2% | North America and Europe | Medium term (2 to 4 years) |
Machine-Readable Assurance Exchange
This is untapped future white space rather than a current driver because organizations can adopt governance frameworks today, but certification and interoperable evidence exchange remain voluntary: ISO describes its 51-page AI management-system standard as applicable across organization sizes and sectors while confirming that independent certification is optional.
NIST’s generative-AI profile, published on 26 July 2024, supplies cross-sector risk-management actions that can become reusable machine-readable controls rather than repeatedly prepared documents. The World Economic Forum found that 66% of organizations expected AI to materially affect cybersecurity, but only 37% had a process for assessing AI tools before deployment, while 69% of smaller organizations lacked adequate safeguards.
A deliberate assurance-exchange model—standardized control APIs, reusable attestations, and continuous evidence feeds—could therefore add an estimated +0.8% to CAGR; the forecast scenario assumes a 20%-30% reduction in cost per recurring control test and a 5-8-percentage-point gross-margin expansion as vendors replace bespoke evidence collection with scalable subscription and transaction-based monetization.
Key Players Analysis
Tier 1 leaders combine cloud scale with built-in governance tools. IBM reported software revenue of USD 29,962 million in 2025, up 10.6%. It spent USD 8,316 million on R&D, up 11.2%. IBM sells watsonx.governance as part of this software line. Microsoft reported Intelligent Cloud revenue of USD 106,265 million in FY2025. It spent USD 32,488 million on R&D and builds AI controls into Azure and Purview.
ServiceNow uses deals to build its AI Control Tower. It bought Moveworks for USD 2.85 billion and closed the deal in December 2025. It then agreed to buy Armis for USD 7.75 billion in cash. Google, AWS, and SAP also hold Tier 1 positions. They place model monitoring and policy tools inside their cloud and ERP stacks, where large firms already store their data.
Tier 2 challengers focus on governance alone. Veeam bought Securiti AI for USD 1.725 billion, a strong sign of how much buyers value AI trust tools. OneTrust and Collibra extend privacy and data catalog tools into AI risk. Their large client bases in regulated industries give them a strong cross-sell path.
Specialists such as Credo AI, Holistic AI, Fiddler AI, ModelOp, Monitaur, and Arthur AI compete on depth of features. They offer bias tests, model inventories, and audit trails that map to the EU AI Act and NIST rules. Most of them are private, so they do not report revenue. They win deals with banks, insurers, and health firms that need proof for regulators.
Top Key Players in the Market
- IBM Corporation
- Microsoft Corporation
- OneTrust LLC
- Google LLC (Alphabet Inc.)
- ServiceNow, Inc.
- SAP SE
- Amazon Web Services, Inc.
- Credo AI, Inc.
- Holistic AI Ltd.
- Fiddler AI, Inc.
- ModelOp, Inc.
- Monitaur, Inc.
- Arthur AI, Inc.
- Collibra, Inc.
- Securiti AI, Inc.
Recent Developments
- In April 2026, ServiceNow completed its USD 7.75 billion all-cash buy of Armis, paid with cash on hand and debt, to add AI security and asset risk tools to its AI Control Tower. Moveworks for USD 2.85 billion in cash and stock to extend agentic AI across its platform.
- In December 2025, IBM agreed to buy Confluent for about USD 11 billion to strengthen the real-time database for governed AI agents.
- In December 2025, Veeam completed its USD 1.725 billion buy of Securiti AI, bringing AI trust, privacy, and data governance into its data resilience platform. Securiti AI’s CEO joined as President of Security and AI.
Report Scope
| Report Features | Description |
|---|---|
| Market Value (2025) | USD 1.8 Billion |
| Forecast Revenue (2035) | USD 10.4 Billion |
| CAGR (2026-2035) | 19.1% |
| Base Year for Estimation | 2025 |
| Historic Period | 2020-2024 |
| Forecast Period | 2026-2035 |
| Report Coverage | Revenue Forecast, Market Dynamics, Competitive Landscape, Recent Developments |
| Segments Covered | By Component (Software, Services); By Deployment Mode (Cloud-Based, On-Premises, Hybrid); By Organization Size (Large Enterprises, Small and Medium-Sized Enterprises (SMEs)); By AI Technology (Generative AI and Large Language Models, Machine Learning Models, AI Agents and Autonomous Systems, Natural Language Processing Models, Computer Vision Models, Predictive Analytics and Decision Intelligence Models, Others); By End-Use Industry (IT and Telecommunications, Banking, Financial Services, and Insurance (BFSI), Healthcare and Life Sciences, Government and Public Sector, Manufacturing, Energy and Utilities, Media and Entertainment, Other) |
| Regional Analysis | North America – US, Canada; Europe – Germany, France, The UK, Spain, Italy, Rest of Europe; Asia Pacific – China, Japan, South Korea, India, Australia, Singapore, Rest of APAC; Latin America – Brazil, Mexico, Rest of Latin America; Middle East & Africa – GCC, South Africa, Rest of MEA |
| Competitive Landscape | IBM Corporation, Microsoft Corporation, OneTrust LLC, Google LLC (Alphabet Inc.), ServiceNow, Inc., SAP SE, Amazon Web Services, Inc., Credo AI, Inc., Holistic AI Ltd., Fiddler AI, Inc., ModelOp, Inc., Monitaur, Inc., Arthur AI, Inc., Collibra, Inc., Securiti AI, Inc. |
| Customization Scope | Customization for segments, region/country-level will be provided. Moreover, additional customization can be done based on the requirements. |
| Purchase Options | We have three licenses to opt for: Single User License, Multi-User License (Up to 5 Users), Corporate Use License (Unlimited Users and Printable PDF) |





























