


Report Overview
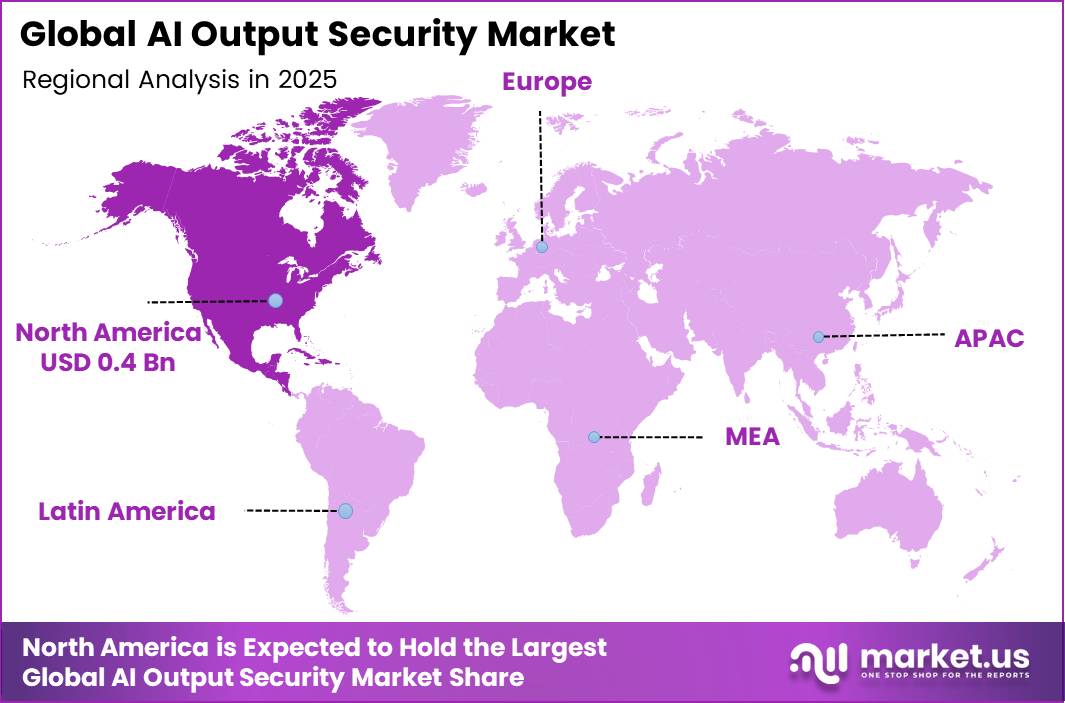
In 2025, the Global AI Output Security Market was valued at USD 1.1 billion. The market is projected to grow at a CAGR of 33.2% during 2026–2035, reaching approximately USD 20.0 billion by 2035. North America dominated the global market in 2025, accounting for more than 38.0% of the total market share and generating approximately USD 0.4 billion in revenue.
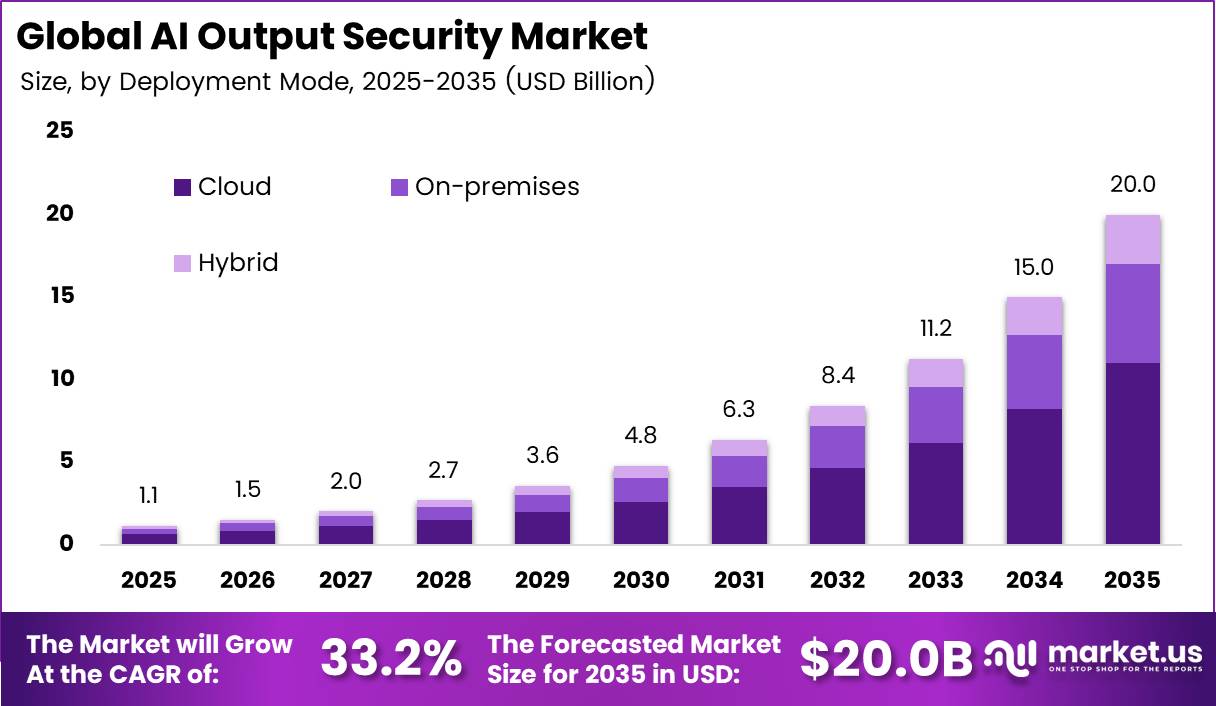
These figures reflect the client’s forecast, not an independently verified market measurement. Expanding business use of AI supports the demand case: according to the OECD, 20.2% of firms used AI in 2025, up from 14.2% in 2024. However, adoption figures alone cannot establish market revenue.
As AI use grows, companies need to check more outputs before customers or employees act on them. Banking assistants need safeguards against private-data leaks, healthcare tools need checks for unsupported answers, and retail chatbots need controls against unsafe content and false product claims. These needs support spending on redaction, content controls, groundedness checks, and output validation.
Microsoft’s annual report describes Barclays’ rollout of AI tools to 100,000 employees and Mercy’s use of automated clinical documentation to save caregivers more than 100,000 hours. These examples illustrate adoption in sensitive workflows that North American providers can serve through established cloud platforms and security teams.
Key Takeaways
- The AI Output Security Market value reaches USD 1.1 billion in 2025 and USD 20.0 billion in 2035. at a CAGR of 33.2% for 2026-2035.
- Software/Platforms leads the Component group with a supplied share of 72.0%.
- Output content safety and policy enforcement leads the Output Security Function group with a supplied share of 31.0%.
- Cloud leads the Deployment Mode group with a supplied share of 55.0%.
- Large enterprises lead the Organisation Size group with a supplied share of 74.0%.
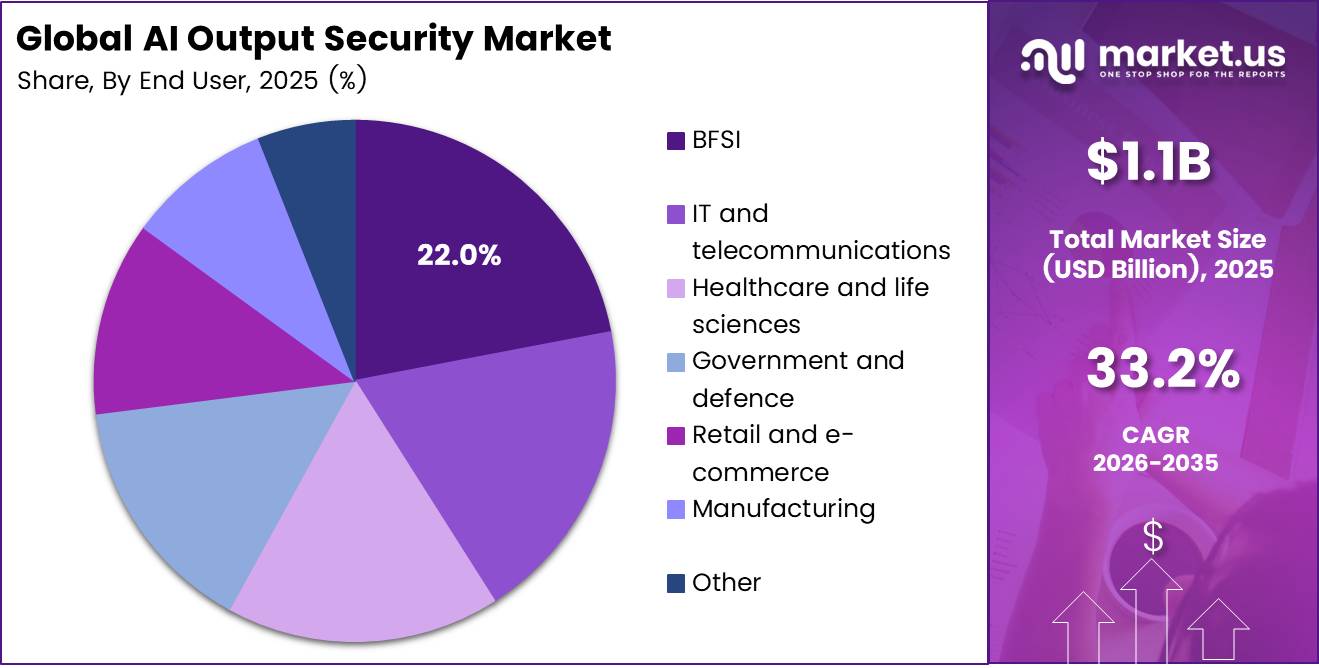
- BFSI leads the End-Use Industry group with a supplied share of 22.0%.
- North America leads with a supplied share of 38.0% and approximately USD 0.4 billion in revenue.
By Component
Software/Platforms dominates with 72.0% due to automated checks across connected AI applications.
Software/Platforms leads in the supplied share because businesses need repeatable checks across many AI tools. A common platform lets teams apply content rules, remove private details, record decisions, and review alerts without checking every answer by hand.
This approach supports wider use while keeping control costs manageable. IBM reported a generative AI book of business above $5 billion in 2024, covering software transactions, subscription contract value, and consulting signings. That figure shows broader AI demand, not output security revenue.
By Output Security Function
Output content safety and policy enforcement dominates with 31.0% due to direct screening of harmful AI responses.
Output content safety and policy enforcement leads in the supplied share because it checks what users actually receive. Businesses can apply rules against harmful language, unsafe advice, and answers that break company policy.
These checks serve many uses, from customer chat to internal writing tools. NIST’s generative AI risk profile identifies 12 risk categories, including dangerous content, privacy, false information, and security. This range supports the need for several controls rather than a single filter.
Hallucination and groundedness detection offers a strong, fast-growing candidate, but the input provides no measured growth ranking. This function checks whether an answer matches reliable source material. Its value rises when companies ask AI to explain contracts, summarize records, or answer questions from business documents.
By Deployment Mode
Cloud dominates with 55.0% due to rapid rollout across hosted AI workloads.
Cloud leads in the supplied share because buyers can add security checks near the hosted AI services they already use. Central updates help teams change policies, review alerts, and support new applications without installing separate systems at every location.
Microsoft reported that Azure revenue exceeded $75 billion in fiscal 2025. This figure describes the wider cloud business, not output security spending, but it illustrates the large base of hosted workloads that security providers can serve.
By Organisation Size
Large enterprises dominate with 74.0% due to broad AI use across business departments.
Large enterprises lead in the supplied share because extensive AI use creates more outputs, more users, and more control needs. Large firms often need common rules across customer service, finance, human resources, and other departments. Their purchasing teams can support dedicated security tools and staff.
The U.S. Census Bureau reported that 37% of firms with at least 250 employees used AI in its recent survey period. That finding supports the adoption context, not the stated output security share. This growth case depends on wider adoption and affordable products.
By End-Use Industry
BFSI dominates with 22.0% due to strict controls over sensitive financial information.
BFSI leads in the supplied share because banks, financial services firms, and insurers must protect customer information and control the advice they provide. Wrong figures, exposed account details, or misleading answers can create direct business harm.
Output security helps teams screen responses before customers or staff rely on them. A joint UK regulatory survey found that 75% of responding financial firms used AI in 2024. This national finding supports sector demand, not the global market share.
For comparison, the financial survey found that 55% of AI use cases involved some automated decision-making. That finding explains why financial buyers need oversight alongside technical filters. Healthcare buyers face a similar need to keep human judgment in important decisions.
Key Market Segments
By Component
- Software/Platforms
- Services
By Output Security Function
- Output content safety and policy enforcement
- Sensitive-data, PII, and secret redaction
- Hallucination and groundedness detection
- Output integrity and factuality validation
- Others
By Deployment Mode
- Cloud
- On-premises
- Hybrid
By Organisation Size
- Large enterprises
- Small and medium-sized enterprises
By End-Use Industry
- BFSI
- IT and telecommunications
- Healthcare and life sciences
- Government and defence
- Retail and e-commerce
- Manufacturing
- Other
Geopolitical Impact Analysis
AI output security primarily involves software and services, so geopolitical shocks affect its supporting infrastructure more directly than software delivery. UNCTAD’s 2025 maritime analysis includes an additional 25% tariff on India scheduled for August 2025. Such measures can affect imported equipment, depending on product classification and exemptions.
Red Sea disruption creates another infrastructure risk. UNCTAD documented an additional 12 sailing days for vessels travelling from Shanghai to Rotterdam around the Cape of Good Hope. Its 2025 review describes continued rerouting and freight volatility. Longer voyages can delay server racks, cooling equipment, and power systems that support cloud capacity.
Commodity movements create mixed cost pressures. In its April 2025 outlook, the World Bank forecast a 17% decline in its energy price index and a 10% decline in copper prices for that year. These forecasts could ease some energy and electrical-equipment costs.
Trade fragmentation also affects investment timing. UNCTAD simulated a 6% to 10% decline in world seaborne trade under alternative additional-tariff scenarios. These figures represent modelled outcomes, not observed declines. For this market, the relevant channels include hardware sourcing, infrastructure spending, and enterprise budgets.
Regional Analysis
North America dominates the AI Output Security Market, holding a 38.0% share and generating USD 0.4 billion in revenue. These figures come from the supplied input and describe the client’s market estimate. Statistics Canada offers separate evidence of an expanding addressable customer base: 19.2% of Canadian firms used AI to produce goods or deliver services in 2026.
Its earlier industry analysis reported adoption rates of 35.6% in information and cultural industries, 31.7% in professional, scientific and technical services, and 30.6% in finance and insurance during the second quarter of 2025. Those industries create different output-security needs. Financial firms need controls over customer records, investment explanations, and internal documents.
Asia Pacific has no verified fastest-growing designation in the supplied input. ITU estimates that 77% of people in its Asia-Pacific region used the Internet in 2025. That connectivity supports digital channels where businesses may deploy AI assistants. China, Japan, South Korea, India, Australia, and other APAC markets require separate assessments of enterprise adoption, language coverage, and infrastructure access.
Europe offers a growing enterprise customer base, although the input provides no regional revenue or growth ranking. Eurostat reports that 20.0% of EU enterprises with at least 10 employees used AI in 2025. Written-language analysis reached 11.8%, a relevant use case for checking text outputs.
Key Regions and Countries
North America
- US
- Canada
Europe
- Germany
- France
- The UK
- Spain
- Italy
- Rest of Europe
Asia Pacific
- China
- Japan
- South Korea
- India
- Australia
- Rest of APAC
Latin America
- Brazil
- Mexico
- Rest of Latin America
Middle East and Africa
- GCC
- South Africa
- Rest of MEA
Market Dynamics
Drivers
| Driver | (~) % Impact on CAGR Forecast | Geographic Relevance | Impact Timeline |
|---|---|---|---|
| Production deployment of enterprise generative AI | +1.6% | Global; North America-led | Short term (2 years or less) |
| Downstream exposure to executable AI outputs | +1.2% | Global; software-intensive industries | Short term (2 years or less) |
| Customer-facing hallucination containment | +0.9% | Global; financial and professional services | Short term (2 years or less) |
| Protection against proprietary-content reproduction | +0.7% | North America; Europe; developed Asia-Pacific | Medium term (2 to 4 years) |
| Operationalization of AI risk-management frameworks | +0.6% | Global; regulated enterprises | Medium term (2 to 4 years) |
Production deployment of enterprise generative AI
Moving generative AI into production creates recurring demand for screening outputs before customers or enterprise systems consume them: the U.S. Census Bureau reported business AI usage of 17%–20% during December 2025–May 2026, although its broader questionnaire measures any business function rather than output-security adoption specifically.
The analyst-assigned +1.6 percentage-point sensitivity is an incremental scenario adjustment to the supplied 33.2% baseline, not a Census Bureau, NIST, or Microsoft forecast; it assumes deeper paid coverage within deployed applications rather than treating every AI-using business as an immediate buyer.
Across all tables, the analyst-assigned adjustments are percentage-point sensitivities, not independently measured causal contributions: Drivers total +5.0 points, Restraints −3.5 points, Challenges −3.0 points, and contingent Opportunities +3.0 points, producing a conservative all-factor scenario of 34.7%; the positive-only envelope is 41.2%, and the negative-only envelope is 26.7%.
Restraints
| Restraint | (~) % Impact on CAGR Forecast | Geographic Relevance | Impact Timeline |
|---|---|---|---|
| Unapproved external processing of sensitive outputs | −1.1% | European Economic Area; privacy-sensitive global enterprises | Short term (2 years or less) |
| Native-platform substitution for standalone purchases | −0.8% | Global; concentrated cloud ecosystems | Short term (2 years or less) |
| Insufficient paid workload for minimum commitments | −0.6% | Global; small and midsize enterprises | Short term (2 years or less) |
| Unfunded standalone security procurement | −0.5% | Global; discretionary enterprise budgets | Short term (2 years or less) |
| Unacceptable liability and indemnity terms | −0.5% | North America; Europe; regulated procurement | Medium term (2 to 4 years) |
Unapproved external processing of sensitive outputs
External output screening can become a procurement hard stop when generated responses contain personal data and the proposed processor lacks an approved contractual or transfer arrangement. Under the European Union’s GDPR, Article 28 requires binding processor terms, while Article 44 subjects international transfers to the regulation’s transfer conditions.
The European Data Protection Board’s December 2024 opinion separately requires case-by-case assessment of model anonymity and describes a 3-step legitimate-interest test where that legal basis is proposed. NIST’s generative AI profile identifies data privacy as a deployment risk, reinforcing the need to assess the screening service’s own handling of sensitive information.
The analyst-assigned −1.1 percentage-point deduction models contracts that cannot close until lawful processing arrangements are established, rather than ordinary implementation delays. Commercially, suppliers may need customer-controlled deployment or approved regional processing.
Challenges
| Challenge | (~) % CAGR Friction Drag | Geographic Relevance | Mitigation Horizon |
|---|---|---|---|
| Adaptive adversarial detection reliability | −1.0% | Global; externally exposed AI applications | Long term (4 years or more) |
| Inline inspection latency overhead | −0.7% | Global; real-time AI services | Medium term (2 to 4 years) |
| Multilingual safety calibration gaps | −0.5% | Asia-Pacific; Middle East; Africa; multilingual Europe | Long term (4 years or more) |
| Model update regression burden | −0.4% | Global; multi-model enterprise environments | Medium term (2 to 4 years) |
| Scarce security evaluation expertise | −0.4% | Global; specialist engineering hubs | Medium term (2 to 4 years) |
Adaptive adversarial detection reliability
Adaptive attackers create continuing reliability friction because language models process instructions and untrusted content through closely related channels; OWASP’s prevention guidance therefore recommends separating trust boundaries, screening outputs, and enforcing permissions outside the model rather than relying on keyword filtering alone.
Microsoft distinguishes 2 attack channels: direct user-prompt attacks and indirect document attacks—while NIST’s generative AI profile places evaluation within ongoing risk management rather than treating initial testing as permanent assurance.
For commercial planning, an analyst-designed evaluation scenario of 10,000 adversarial cases with a residual miss rate of 0.5%–1.0% would leave 50–100 missed cases; these are illustrative calculations, not institution-reported detection results or production incident probabilities. This mechanism supports the analyst-assigned −1.0 percentage-point friction drag.
Opportunities
| Opportunity | (~) % Potential CAGR Upside | Geographic Relevance | Execution Window |
|---|---|---|---|
| Cross-platform provenance verification services | +1.0% | Global; media, advertising, and enterprise publishing | Medium term (2 to 4 years) |
| Industrial instruction-output assurance | +0.7% | Europe; North America; industrial Asia-Pacific | Long term (4 years or more) |
| Insurer-integrated assurance subscriptions | +0.5% | North America; United Kingdom; Europe | Medium term (2 to 4 years) |
| Independent outcome-based security contracts | +0.4% | Global; mature enterprise buyers | Medium term (2 to 4 years) |
| Specialist vendor consolidation platforms | +0.4% | North America; Europe; selected Asia-Pacific hubs | Medium term (2 to 4 years) |
Cross-platform provenance verification services
The future white space lies in selling independent verification of generated assets across organizational boundaries, not merely adding provenance metadata at creation: NIST’s November 2024 synthetic-content guidance identifies authentication and provenance as technical approaches to content transparency, while C2PA describes cryptographically bound credentials and trusted signing infrastructure.
An analyst-designed unit-economic scenario assumes standardized validation reduces variable processing and support cost per asset by 15%–25%; at unchanged pricing and an illustrative starting gross margin of 60%, that would expand gross margin by 6–10 percentage points.
These are execution targets, not C2PA, NIST, or industry-reported margins. The analyst-assigned +1.0 percentage-point upside requires vendors to secure interoperable distribution partnerships and monetize verification APIs, trust-policy management, and auditable validation records without promising factual accuracy.
Key Players Analysis
Tier 1 groups large platform suppliers by distribution scale, not verified output-security market share. AWS reported USD 107.6 billion in segment sales for 2024. Microsoft reported Azure revenue above USD 75 billion for FY2025. These broader cloud businesses provide substantial customer access, but neither figure measures AI output-security revenue.
Google Cloud reported USD 11.4 billion in third-quarter 2024 revenue. Microsoft also reported more than 400 data centres across 70 regions and over 2 gigawatts of added capacity in its FY2025 annual report. These figures show platform reach and infrastructure scale. They do not identify spending dedicated to output-security development or establish comparable market shares.
Tier 2 includes specialist challengers whose public financial disclosure offers less basis for comparison. Arthur AI, Fiddler AI, and Guardrails AI require separate verification of revenue and research spending. Check Point announced its Lakera agreement in September 2025, but the official announcement did not disclose a transaction price.
Palo Alto Networks reported USD 2.5 billion in revenue for its first quarter of FY2026. Its wider security business offers a different competitive route from cloud infrastructure. The remaining listed companies require product-level revenue mapping before the report can assign defensible tiers.
Top Key Players in the Market
- Amazon Web Services, Inc.
- Microsoft Corporation
- Google LLC / Google Cloud
- IBM Corporation
- Palo Alto Networks, Inc.
- Cisco Systems, Inc.
- Check Point Software Technologies Ltd. / Lakera
- Cloudflare, Inc.
- Akamai Technologies, Inc.
- F5, Inc.
- NVIDIA Corporation
- Arthur AI, Inc.
- Fiddler AI, Inc.
- Guardrails AI, Inc
Recent Developments
- In February 2025, IBM completed its HashiCorp acquisition at an enterprise value of USD 6.4 billion. HashiCorp adds infrastructure automation and security capabilities that support hybrid-cloud applications and generative AI.
- In November 2025, Palo Alto Networks agreed to acquire Chronosphere for USD 3.35 billion in total consideration, subject to adjustments. The transaction adds observability capabilities relevant to monitoring AI-era infrastructure, rather than dedicated output-security capacity.
- In March 2026, Google completed its Wiz acquisition, following the USD 32 billion agreement announced the previous year. Wiz joined Google Cloud while retaining its brand and support for customers across cloud environments.
Report Scope
| Report Features | Description |
|---|---|
| Market Value (2025) | USD 1.1 Billion |
| Forecast Revenue (2035) | USD 20.0 Billion |
| CAGR (2026-2035) | 33.2% |
| Base Year for Estimation | 2025 |
| Historic Period | 2020-2024 |
| Forecast Period | 2026-2035 |
| Report Coverage | Revenue Forecast, Market Dynamics, Competitive Landscape, Recent Developments |
| Segments Covered | By Component (Software/Platforms, Services); By Output Security Function (Output content safety and policy enforcement, Sensitive-data, PII, and secret redaction, Hallucination and groundedness detection, Output integrity and factuality validation, Others); By Deployment Mode (Cloud, On-premises, Hybrid); By Organisation Size (Large enterprises, Small and medium-sized enterprises); By End-Use Industry (BFSI, IT and telecommunications, Healthcare and life sciences, Government and defence, Retail and e-commerce, Manufacturing, Other) |
| Regional Analysis | North America – US, Canada; Europe – Germany, France, The UK, Spain, Italy, Rest of Europe; Asia Pacific – China, Japan, South Korea, India, Australia, Singapore, Rest of APAC; Latin America – Brazil, Mexico, Rest of Latin America; Middle East & Africa – GCC, South Africa, Rest of MEA |
| Competitive Landscape | Amazon Web Services, Inc., Microsoft Corporation, Google LLC / Google Cloud, IBM Corporation, Palo Alto Networks, Inc., Cisco Systems, Inc., Check Point Software Technologies Ltd. / Lakera, Cloudflare, Inc., Akamai Technologies, Inc., F5, Inc., NVIDIA Corporation, Arthur AI, Inc., Fiddler AI, Inc., Guardrails AI, Inc |
| Customization Scope | Customization for segments and region/country-level will be provided. Moreover, additional customization can be done based on the requirements. |
| Purchase Options | We have three licenses to opt for: Single User License, Multi-User License (Up to 5 Users), Corporate Use License (Unlimited Users and Printable PDF) |





























