


Report Overview
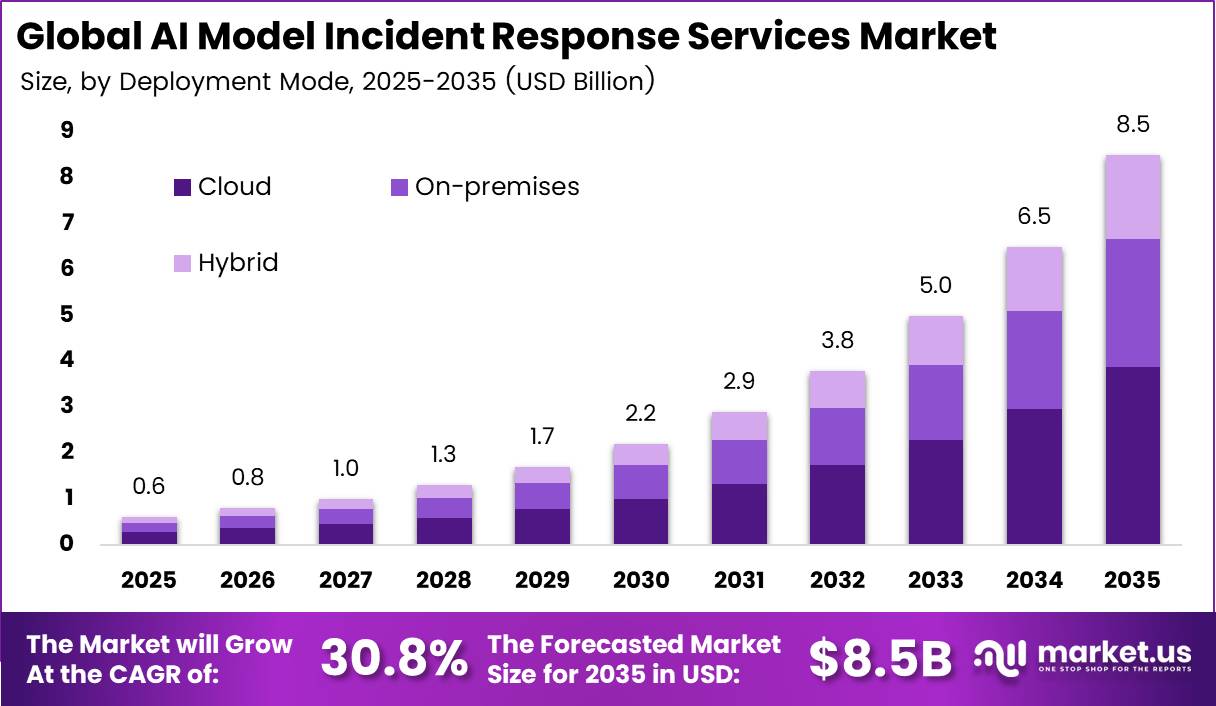
In 2025, the Global AI Model Incident Response Services Market was valued at USD 0.6 billion. The market is projected to grow at a CAGR of 30.8% during 2026–2035, reaching approximately USD 8.5 billion by 2035. North America dominated the global market in 2025, accounting for more than 40.0% of the total market share and generating approximately USD 0.2 billion in revenue.
Fast growth in AI computing is the main driver. The IEA reports that data centres used about 415 TWh of electricity in 2024, or 1.5% of global power use. The IEA expects this to reach 945 TWh by 2030. Power use by AI servers will rise about 30% each year, against 9% for regular servers. Every new AI model that companies deploy adds new risks.
These include prompt injection, data leaks, model drift, and attacks by AI agents. Firms in IT, telecom, banking, and healthcare now need special teams that can find, contain, and fix AI model failures fast. This need is turning AI incident response from a niche service into a core budget line.
North American region runs the largest base of AI systems in the world. The IEA projects that US data centre power use will rise by about 240 TWh by 2030, up 130% from 2024 levels. The IEA also finds that data centres will drive almost half of US power demand growth over this period.
Key Takeaways
- The Global AI Model Incident Response Services Market reached USD 0.6 billion in 2025 and will reach USD 8.5 billion by 2035. grow at a CAGR of 30.8% during 2026 to 2035.
- By service type, Incident Detection and Monitoring leads with a 22.0% share.
- By deployment mode, Cloud-Based leads with a 48.0% share.
- By organization size, Large Enterprises lead with a 68.0% share.
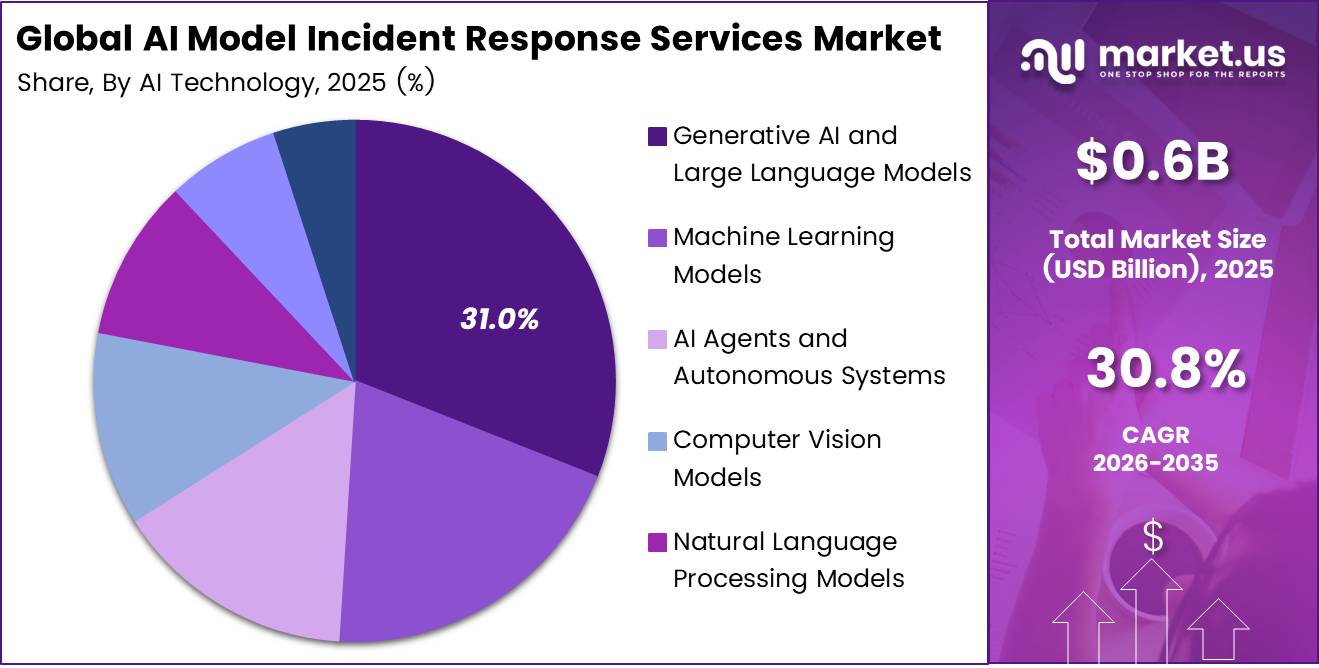
- By AI technology, Generative AI and Large Language Models lead with a 31.0% share.
- By end-use industry, Information Technology and Telecommunications lead with a 24.0% share.
- North America leads with a 40.0% share and USD 0.2 billion in revenue.
By Service Type
Incident Detection and Monitoring dominates with 22.0% due to the constant need for early threat alerts.
Incident Detection and Monitoring leads because firms cannot fix what they cannot see. IBM’s Cost of a Data Breach Report 2025 found that 13% of organizations suffered breaches of their AI models or apps. Another 8% did not know whether attackers had reached their models.
Monitoring also pays back quickly. Firms that used security AI and automation widely cut the breach lifecycle by 80 days. They also saved USD 1.9 million on average. Clear savings like these keep detection at the top of most security budgets.
Post-Incident Review and Compliance Reporting is the fastest-growing service. Among breached firms, 63% had no AI governance policy or were still writing one. Only 34% of firms with a policy ran regular audits for unapproved AI. New rules now ask companies to record, explain, and report serious AI failures. Buyers want partners who can turn each incident into clean audit records and stronger controls.
By Deployment Mode
Cloud-Based dominates with 48.0% due to fast setup across distributed AI workloads.
Cloud-based delivery holds first place because most AI models now run on rented computing power. Eurostat reports that 52.7% of EU enterprises paid for cloud computing services in 2025. That figure rose by 7.4 percentage points from 2023. When the model lives in the cloud, response teams work best there too.
Hybrid deployment is growing the fastest. Many firms train models in the cloud but keep sensitive records on their own servers, and this split leaves gaps. Shadow AI incidents exposed customer personal data in 65% of cases, against a 53% global average.
By Organization Size
Large Enterprises dominate with 68.0% due to wide AI use and big budgets.
Large enterprises lead because they run the most AI and have the most to lose. Eurostat data show that 55.03% of large EU firms used AI technologies in 2025. Only 17% of small firms did the same. More models mean more ways in for attackers, so big firms sign multi-year response contracts.
SMEs form the fastest-growing group. The share of EU firms using AI climbed from 13.5% in 2024 to 20.0% in 2025. Among medium-sized firms, use has already reached 30.36%. Most smaller firms lack in-house security staff, so they call outside experts when an AI tool fails or leaks data. Providers now sell packaged subscription plans at fixed prices.
By AI Technology
Generative AI and Large Language Models dominate with 31.0% due to rapid chatbot and copilot rollouts.
Generative AI and large language models lead because companies moved them into daily work faster than any other AI type. Eurostat found that 31.68% of large EU enterprises used AI that writes text, speech, or code in 2025.
These tools face prompt attacks, data leaks, and harmful outputs, which keep response teams busy. Attackers use the same tools. IBM reports that 16% of breaches involved attackers using AI. Of those, 37% used AI-written phishing, and 35% used deepfake impersonation.
AI Agents and Autonomous Systems is the fastest-growing area. Agents can log in, move files, and trigger payments with little human input, so one flaw can spread fast. Among firms with AI-related breaches, 97% lacked proper AI access controls. These AI incidents also caused operational disruption in 31% of cases.
By End-Use Industry
Information Technology and Telecommunications dominate with 24.0% due to heavy AI use in networks.
IT and telecom firms lead because they build, host, and sell many of the AI models other sectors rely on. ENISA’s Threat Landscape 2025 shows that telecommunications made up 25.1% of incidents among digital infrastructure entities. Digital service providers added another 13.4%. A single breach here can reach thousands of downstream customers.
BFSI is the fastest-growing industry. ENISA counted 4,875 incidents from July 2024 to June 2025. Finance drew 11.7% of hacktivist activity in the EU. Banks and insurers use AI for credit scoring, fraud checks, and claims, so a faulty model can cause direct money losses. Financial regulators expect quick reporting and clear proof of fixes.
Key Market Segments
By Service Type
- Incident Detection and Monitoring
- Incident Assessment and Triage
- Digital Forensics and Root-Cause Analysis
- Incident Containment and Eradication
- Recovery and Remediation Services
- Post-Incident Review and Compliance Reporting
- Others
By Deployment Mode
- Cloud-Based
- On-Premises
- Hybrid
By Organization Size
- Large Enterprises
- Small and Medium-Sized Enterprises (SMEs)
By AI Technology
- Generative AI and Large Language Models
- Machine Learning Models
- AI Agents and Autonomous Systems
- Computer Vision Models
- Natural Language Processing Models
- Predictive Analytics and Decision Intelligence Models
- Others
By End-Use Industry
- Information Technology and Telecommunications
- Banking, Financial Services, and Insurance (BFSI)
- Healthcare and Life Sciences
- Manufacturing
- Energy and Utilities
- Media and Entertainment
- Transportation and Logistics
- Other
Geopolitical Impact Analysis
Trade tensions now shape the cost of the hardware behind AI incident response. The WTO cut its 2026 world goods trade growth forecast to 0.5% from 1.8%, citing rising tariff rates and policy uncertainty. AI-related goods drive this market. These include GPUs, servers, and network gear used for monitoring and forensics.
The WTO found that trade in these goods grew to USD 1.92 trillion in the first half of 2025, up from USD 1.61 trillion a year earlier. Firms rushed to buy hardware ahead of new tariffs, and this raised short-term costs. AI goods made up about 15% of world goods trade but drove 43% of trade growth. Service providers that build their own forensic labs and security operations centres now pay more for servers and face longer lead times.
Shipping routes add more risk. UNCTAD reported that container tonnage through the Suez Canal fell 82% as ships rerouted around the Cape of Good Hope. This makes a Singapore to Rotterdam route about 29% longer. An India to Europe round trip can stretch from 56 to 63 days, adding 7 days of transit. This delay slows delivery of AI security appliances to Europe.
The WTO also flags energy prices and choke points such as the Strait of Hormuz as 2026 risks. AI-enabling goods supported global trade even so, with trade in them growing 21.9% in 2025. Vendors now spread their data centres across regions to keep response times stable.
Regional Analysis
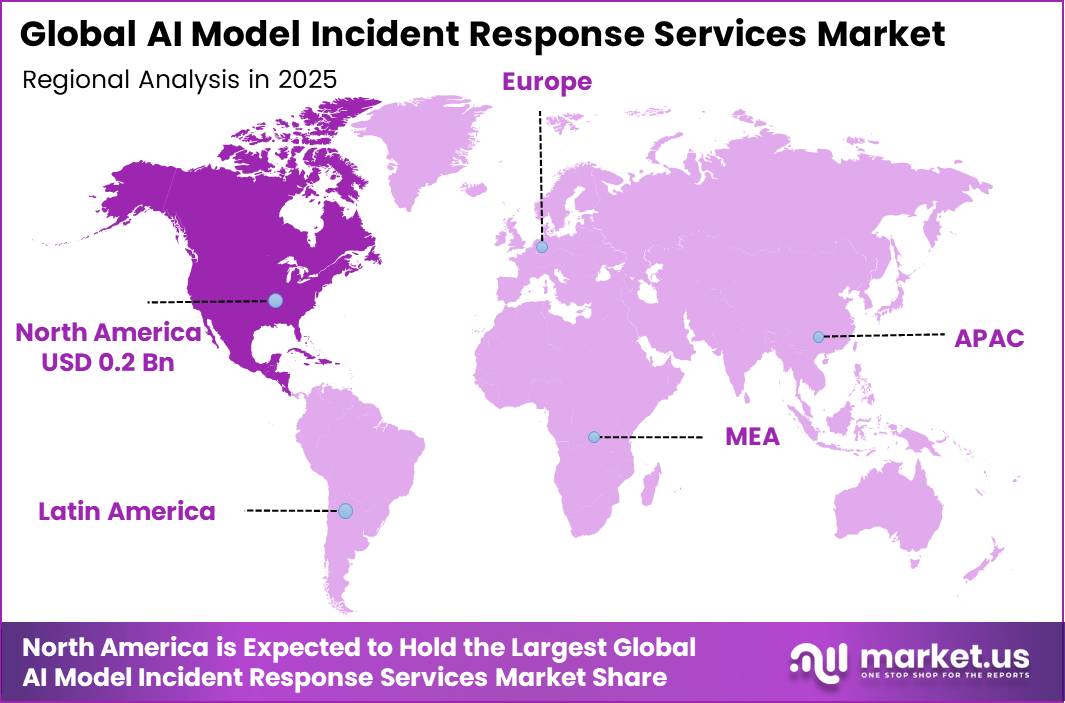
North America dominates the AI Model Incident Response Services Market, holding a 40.0% share and generating USD 0.2 billion in revenue. The US drives most of this demand. It hosts the top AI model builders, the top cloud platforms, and most of the leading security vendors.
The IEA shows that the US and China together will account for nearly 80% of global growth in data centre power use to 2030. This confirms that North America will keep a large and growing base of AI systems that need protection.
Asia Pacific is the fastest-growing region in this market. The WTO reports that Asia accounts for 62% of total AI-enabling trade. The IEA expects China’s data centre power use to grow by about 175 TWh by 2030, up 170%, and Japan’s to rise more than 80%. India, South Korea, and Australia are quickly adding AI in banking, telecom, and public services. This creates strong new demand for detection and containment services.
Europe holds the second position, led by Germany, France, and the UK. The EU AI Act pushes firms to document, monitor, and report serious AI incidents, and this lifts demand for compliance services. The IEA projects that European data centre power use will grow by about 45 TWh by 2030, up 70%. Banks in Germany and France and public bodies in the UK spend heavily on AI audits.
Key Regions and Countries
North America
- US
- Canada
Europe
- Germany
- France
- The UK
- Spain
- Italy
- Rest of Europe
Asia Pacific
- China
- Japan
- South Korea
- India
- Australia
- Rest of APAC
Latin America
- Brazil
- Mexico
- Rest of Latin America
Middle East and Africa
- GCC
- South Africa
- Rest of MEA
Market Dynamics
Drivers
| Driver | (~) % Impact on CAGR Forecast | Geographic Relevance | Impact Timeline |
|---|---|---|---|
| Production AI security incidents | +1.2% | Global enterprise markets | Short term (2 years or less) |
| Post-deployment monitoring adoption | +0.8% | North America, Europe, developed Asia | Short term (2 years or less) |
| Third-party model response ownership | +0.6% | Global cloud-dependent enterprises | Short term (2 years or less) |
| AI-specific containment controls | +0.5% | Global enterprise deployments | Short term (2 years or less) |
| Critical-infrastructure response coordination | +0.4% | United States and partner jurisdictions | Medium term (2 to 4 years) |
Production AI security incidents
Production AI incidents are converting model security from discretionary assessment into an operational response requirement: according to IBM’s 2025 breach research, based on 600 breached organizations observed from March 2024 through, 13% reported breaches involving AI models or applications, and 97% of that subset lacked proper AI access controls.
The table’s +1.2 percentage-point contribution is an analyst scenario assumption rather than an institutional forecast. All table percentages represent incremental percentage-point sensitivities around the user-supplied 30.8% baseline CAGR
Combined positive adjustments total 6.0 points, combined deductions total 4.0 points, and simultaneous realization produces an illustrative 32.8% CAGR, not a validated forecast or a claim that these effects are absent from the supplied baseline.
Restraints
| Restraint | (~) % Impact on CAGR Forecast | Geographic Relevance | Impact Timeline |
|---|---|---|---|
| Unresolved cross-border evidence permissions | -0.7% | EEA-linked international engagements | Short term (2 years or less) |
| Unfunded AI response mandates | -0.5% | Global budget-constrained enterprises | Short term (2 years or less) |
| Provider-restricted forensic access | -0.4% | Global proprietary-model users | Short term (2 years or less) |
| Unaccepted contractual liability allocation | -0.2% | Global outsourced-response contracts | Short term (2 years or less) |
| Unqualified external-response suppliers | -0.2% | Security-sensitive enterprise procurement | Medium term (2 to 4 years) |
Unresolved cross-border evidence permissions
Cross-border evidence restrictions become a sales restraint when an external responder cannot lawfully receive or access personal data needed for an investigation, rather than merely experiencing a slower technical workflow.
For the analyst scenario, assume affected engagements represent 10% of otherwise obtainable new bookings and unresolved permissions prevent 20% of those engagements from closing within the forecast period: the resulting 2% booking leakage supports a cautious -0.7 percentage-point CAGR sensitivity, although bookings do not translate mechanically into CAGR.
Challenges
| Challenge | (~) % CAGR Friction Drag | Geographic Relevance | Mitigation Horizon |
|---|---|---|---|
| Non-deterministic incident reconstruction | -0.7% | Global generative-AI deployments | Medium term (2 to 4 years) |
| Specialist responder skills shortages | -0.5% | Global; smaller delivery markets | Medium term (2 to 4 years) |
| Rapid adversarial technique evolution | -0.4% | Global model-security operations | Long term (4 years or more) |
| Multi-agent causal attribution complexity | -0.2% | Enterprise agentic-AI deployments | Medium term (2 to 4 years) |
| Remediation validation workload escalation | -0.2% | Global frequently updated models | Medium term (2 to 4 years) |
Non-deterministic incident reconstruction
Non-deterministic reconstruction creates delivery friction because reproducing an observed failure can require preserving model configuration, retrieved context, tool activity, and execution evidence rather than replaying a conventional application log.
ENISA identifies cybersecurity workforce shortages and widening skills gaps that constrain the staffing of such investigations. In an illustrative analyst workload model, assume difficult reconstruction affects 25% of cases and increases analyst effort on those cases by 40%; average effort then rises 10%, reducing fixed-team case capacity by approximately 9.1%.
A conservative -0.7 percentage-point CAGR friction allowance recognizes that additional hiring and better evidence capture can recover some capacity without stopping current sales. Providers consequently need reproducibility engineering, standardized evidence packages, and differentiated service levels to protect utilization and gross margins while avoiding unsustainable fixed-fee commitments.
Opportunities
| Opportunity | (~) % Potential CAGR Upside | Geographic Relevance | Execution Window |
|---|---|---|---|
| Productized automated recovery orchestration | +0.9% | Global repeatable AI workflows | Medium term (2 to 4 years) |
| Insurer-distributed response subscriptions | +0.6% | Established cyber-insurance markets | Medium term (2 to 4 years) |
| OEM-embedded edge-AI recovery services | +0.4% | Industrial Asia, Europe, North America | Long term (4 years or more) |
| Response-provider consolidation platforms | +0.3% | Fragmented regional service markets | Medium term (2 to 4 years) |
| Independent post-remediation assurance | +0.2% | High-assurance enterprise buyers | Medium term (2 to 4 years) |
Productized automated recovery orchestration
Productized recovery orchestration is future upside rather than an established demand driver: it requires providers to turn bespoke response procedures into customer-authorized, repeatable software workflows and monetize execution separately from labor-intensive retainers.
NSA’s deployment guidance supports automated alerts and rapid disconnection of compromised AI systems, NIST calls for maintained recovery and incident-response processes, and IBM’s 2025 research associates extensive security AI and automation with a breach lifecycle shortened by 80 days, although that finding concerns broader security operations rather than AI-model recovery services specifically.
For an analyst unit-economic scenario, assume reusable orchestration reduces direct labor per eligible case by 15%, labor represents 60% of delivery cost, and initial gross margin is 45%; unchanged pricing would yield a 9% delivery-cost reduction and approximately 5.0 percentage points of gross-margin expansion before incremental software, integration, and support costs.
Those figures are modeling assumptions, not institutional findings. The conditional +0.9 percentage-point CAGR upside depends on proving safe rollback, maintaining human approval for consequential actions, and securing paid adoption; its commercial value lies in higher case throughput and recurring workflow revenue, not merely automating existing monitoring.
Key Players Analysis
Tier 1 market leaders combine large security revenue with fast AI security deals. Palo Alto Networks reported FY2025 revenue of USD 9.2 billion, up 15%, with Next-Generation Security ARR of USD 5.6 billion. The company agreed to buy CyberArk for USD 25 billion and closed its purchase of Protect AI to build out its Prisma AIRS AI security platform.
CrowdStrike posted FY2026 revenue of USD 4.81 billion, up 22%. Its ending ARR grew 24% to USD 5.25 billion. Net new ARR hit a record USD 1.01 billion, and Falcon Flex ARR reached USD 1.69 billion. Google closed its USD 32 billion cash purchase of Wiz, its largest deal ever, to build a unified AI-driven security platform.
Tier 2 challengers compete through focused AI security deals. SentinelOne agreed to buy Prompt Security, with the deal reported at about USD 250 million, to protect AI in runtime and secure AI agents. Check Point agreed to acquire Lakera, whose platform shows detection rates above 98% and latency below 50 milliseconds.
Fortinet, Trend Micro, and Rapid7 hold strong positions in mid-market detection and response. HiddenLayer and Lakera AI AG lead the specialist AI model protection segment. Lakera supports more than 100 languages. Microsoft, IBM, Cisco, and Accenture use their global cloud, consulting, and network reach to package AI incident response with wider security retainers.
Top Key Players in the Market
- Accenture plc
- CrowdStrike Holdings, Inc.
- IBM Corporation
- Palo Alto Networks, Inc.
- Google LLC
- Microsoft Corporation
- Cisco Systems, Inc.
- SentinelOne, Inc.
- Fortinet, Inc.
- Check Point Software Technologies Ltd.
- Trend Micro Incorporated
- Rapid7, Inc.
- HiddenLayer, Inc.
- Lakera AI AG
Recent Developments
- In March 2025, Google announced an agreement to acquire cloud and AI security firm Wiz for USD 32 billion in cash, a 39% premium over its earlier USD 23 billion offer.
- In April 2025, Palo Alto Networks signed a definitive agreement to acquire AI model security firm Protect AI for about USD 700 million and closed the deal in July 2025. Palo Alto Networks announced its plan to acquire identity security firm CyberArk for an implied total value of USD 25 billion.
Report Scope
| Report Features | Description |
|---|---|
| Market Value (2025) | USD 0.6 Billion |
| Forecast Revenue (2035) | USD 8.5 Billion |
| CAGR (2026-2035) | 30.8% |
| Base Year for Estimation | 2025 |
| Historic Period | 2020-2024 |
| Forecast Period | 2026-2035 |
| Report Coverage | Revenue Forecast, Market Dynamics, Competitive Landscape, Recent Developments |
| Segments Covered | By Service Type (Incident Detection and Monitoring, Incident Assessment and Triage, Digital Forensics and Root-Cause Analysis, Incident Containment and Eradication, Recovery and Remediation Services, Post-Incident Review and Compliance Reporting, Others); By Deployment Mode (Cloud-Based, On-Premises, Hybrid); By Organization Size (Large Enterprises, Small and Medium-Sized Enterprises (SMEs)); By AI Technology (Generative AI and Large Language Models, Machine Learning Models, AI Agents and Autonomous Systems, Computer Vision Models, Natural Language Processing Models, Predictive Analytics and Decision Intelligence Models, Others); By End-Use Industry (Information Technology and Telecommunications, Banking, Financial Services, and Insurance (BFSI), Healthcare and Life Sciences, Manufacturing, Energy and Utilities, Media and Entertainment, Transportation and Logistics, Other) |
| Regional Analysis | North America – US, Canada; Europe – Germany, France, The UK, Spain, Italy, Rest of Europe; Asia Pacific – China, Japan, South Korea, India, Australia, Singapore, Rest of APAC; Latin America – Brazil, Mexico, Rest of Latin America; Middle East & Africa – GCC, South Africa, Rest of MEA |
| Competitive Landscape | Accenture plc, CrowdStrike Holdings, Inc., IBM Corporation, Palo Alto Networks, Inc., Google LLC, Microsoft Corporation, Cisco Systems, Inc., SentinelOne, Inc., Fortinet, Inc., Check Point Software Technologies Ltd., Trend Micro Incorporated, Rapid7, Inc., HiddenLayer, Inc., Lakera AI AG |
| Customization Scope | Customization for segments and region/country-level will be provided. Moreover, additional customization can be done based on the requirements. |
| Purchase Options | We have three licenses to opt for: Single User License, Multi-User License (Up to 5 Users), Corporate Use License (Unlimited Users and Printable PDF) |





























