


Report Overview
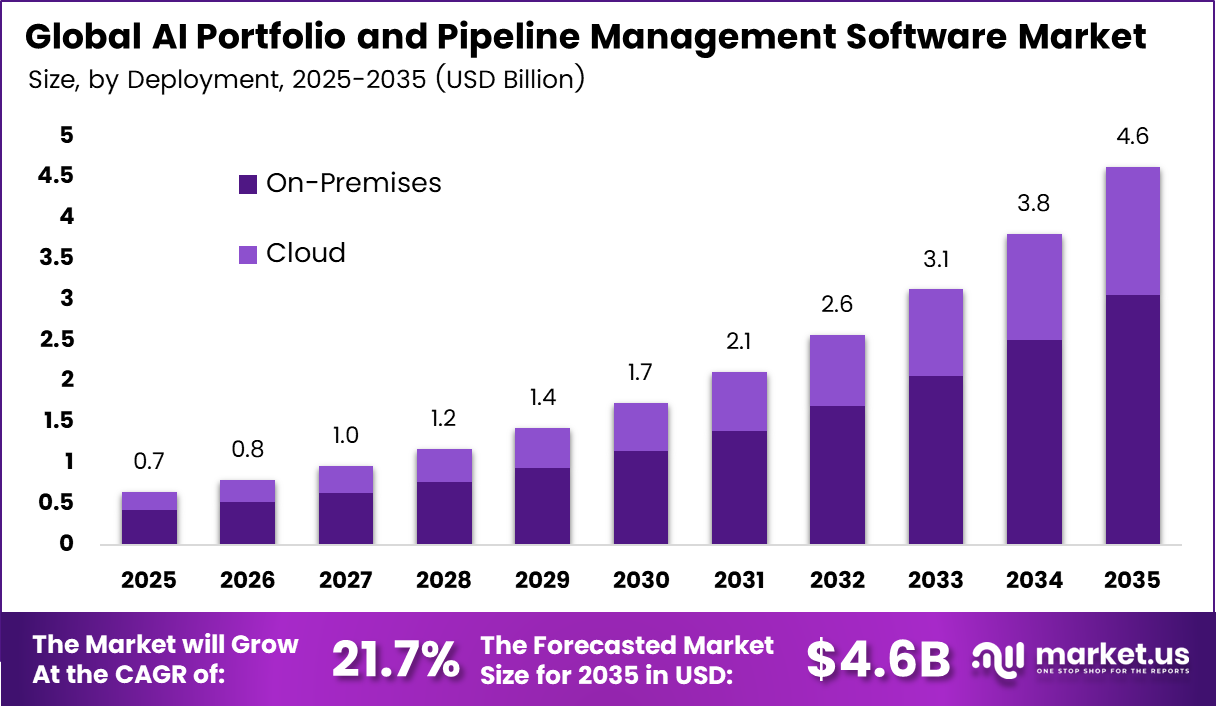
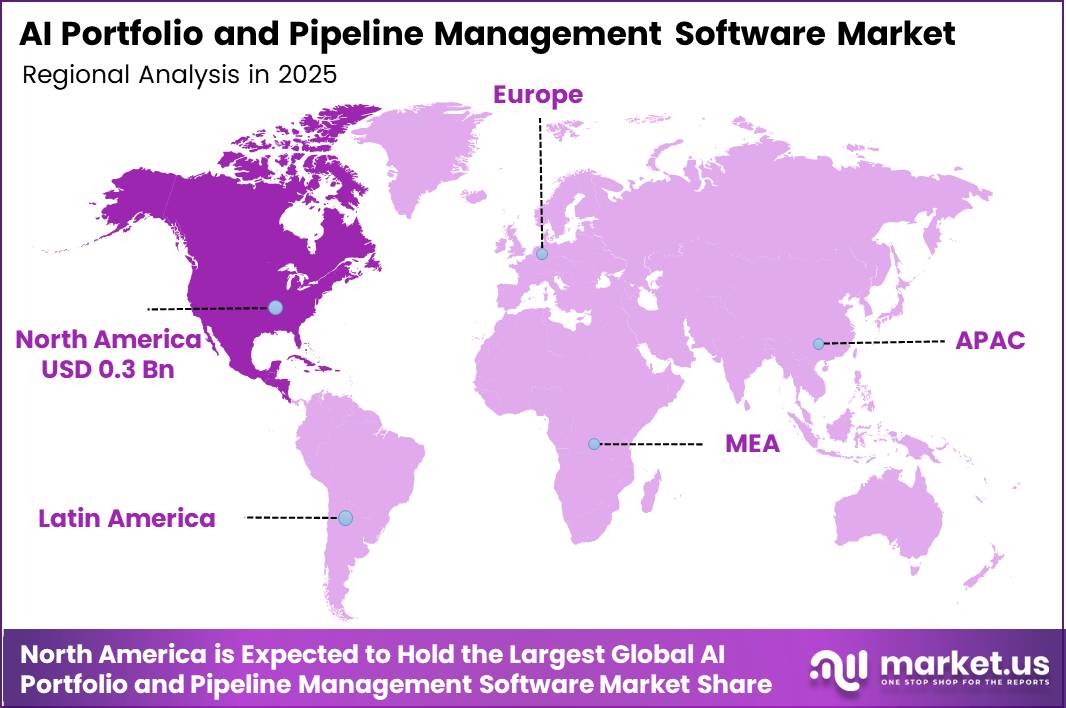
In 2025, the Global AI Portfolio and Pipeline Management Software Market was valued at USD 0.7 billion. The market is projected to grow at a CAGR of 21.7% during 2026–2035, reaching approximately USD 4.6 billion by 2035. North America dominated the global market in 2025, accounting for more than 43.2% of the total market share and generating approximately USD 0.3 billion in revenue.
Fast growth in AI computing drives this demand. The IEA expects data centre power use to roughly double, from 485 TWh in 2025 to 950 TWh in 2030. It also expects power use in accelerated servers, which AI mainly drives, to grow by 30% each year. Investment firms, private equity funds and corporate project teams now use this computing power to screen deals, read documents and track portfolio risk.
North America region has the deepest pool of asset managers, private equity sponsors and software vendors. The IEA projects that US data centre power use will rise by about 240 TWh, or 130%, from its 2024 level by 2030. That gives the region a large head start in AI computing capacity. The WTO also expects North America to post 5.7% export volume growth in 2026, the second highest of any region.
Key Takeaways
- The AI Portfolio and Pipeline Management Software Market was worth USD 0.7 billion in 2025 and should reach USD 4.6 billion by 2035, at a CAGR of 21.7% from 2026 to 2035.
- Portfolio Monitoring and Risk Alerts leads the functionality segment with a 24.3% share.
- Cloud leads the deployment segment with a 79.6% share and is also the fastest-growing deployment mode.
- Private Equity and Venture Capital Portfolios lead the portfolio type segment with a 46.2% share.
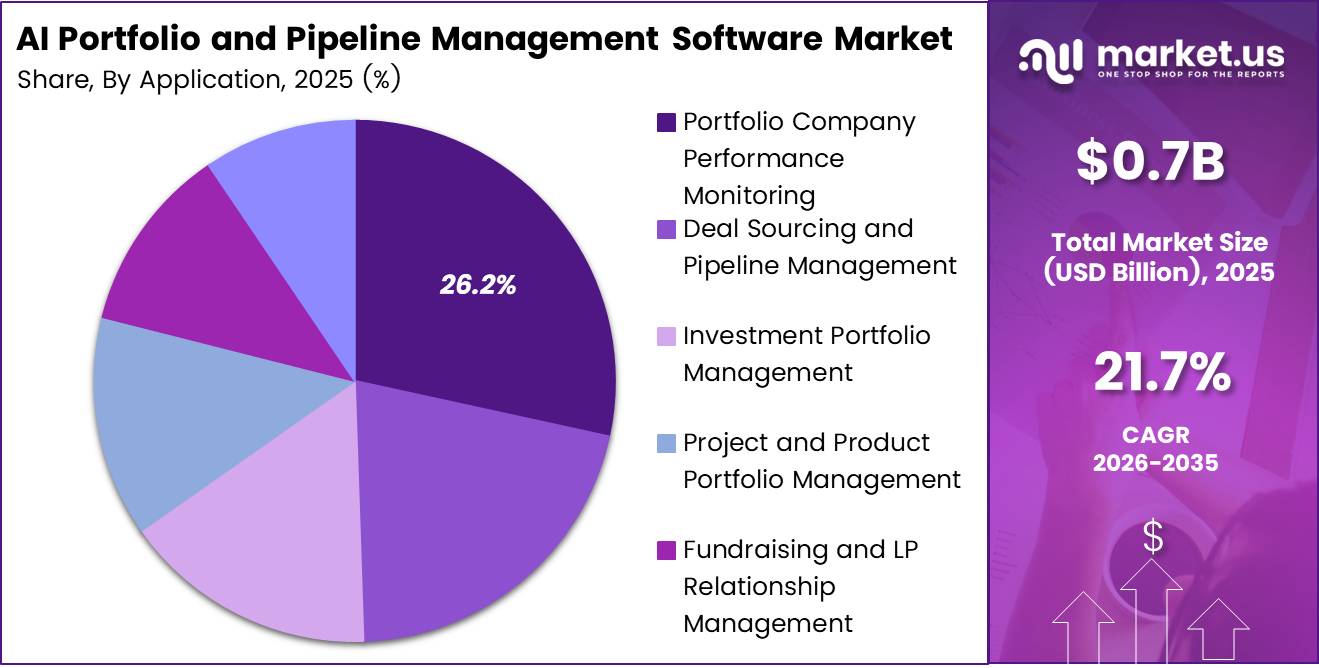
- Portfolio Company Performance Monitoring leads the application segment with a 26.2% share.
- North America leads with a 43.2% share and USD 0.3 billion in revenue.
By Functionality
Portfolio Monitoring and Risk Alerts dominates with 24.3% due to rising private fund assets needing oversight.
Portfolio Monitoring and Risk Alerts holds a 24.3% share because fund managers must watch a fast-growing pool of assets every day. SEC Form PF data shows that private funds held $29.6 trillion in gross assets in 2025Q4, up 18.5% year over year. Bigger books mean more holdings to track, more covenant checks, and more early warnings for deal teams and investors.
The number of reporting firms drives this need further. In the same period, 4,153 advisers filed for 58,891 private funds, and each fund produces its own stream of monthly and quarterly reports. Monitoring tools turn this flood of data into simple dashboards and alerts, so teams can act on risk before it hurts returns.
By Deployment
Cloud dominates with 79.6% due to lower setup costs and faster AI rollouts.
Cloud leads with a 79.6% share and also grows the fastest, as financial firms move core work off their own servers. A U.S. Treasury report cites a survey that put SaaS adoption in banking at about 91%. Investment firms follow the same path, since cloud tools need no hardware setup and update their features automatically.
Wider use keeps building momentum. The American Bankers Association found that more than 90% of surveyed banks keep at least some data, apps, or operations in the cloud. Among those with cloud setups, 43% use PaaS applications. These habits make the cloud the natural home for AI models, which need computing power that few firms can run in-house.
Room for growth remains large. Only 5% of surveyed banks call their cloud use mature, while more than 80% are still in the adoption or early adoption stage. On-Premises still serves firms with strict data rules, but its role keeps shrinking. As managers add AI features, they choose cloud vendors that offer quick launches, shared data rooms, and secure access for global teams and limited partners.
By Portfolio Type
Private Equity and Venture Capital Portfolios dominate with 46.2% due to large holdings counts needing constant tracking.
Private Equity and Venture Capital Portfolios hold a 46.2% share because these funds carry the largest number of separate holdings to manage. SEC data shows that private equity funds held $7.958 trillion in gross assets across 25,155 funds in 2025Q3. Each fund owns many private companies, and each company sends its own financial pack. This pushes managers to buy dedicated software.
Venture capital adds even more volume. The SEC counted 3,616 venture funds with $474 billion in gross assets in the same quarter. Venture books hold many small, early-stage firms, so managers need tools that track funding rounds, valuations, and ownership tables in one place.
Real Estate and Infrastructure Portfolios form the fastest-growing sub-segment, as public spending opens a large pipeline of long-life projects. The U.S. Infrastructure Investment and Jobs Act authorized $1.2 trillion, including $550 billion in new spending on roads, energy, broadband, and water. Investors who back these assets must track building stages, cash flows, and permits across many sites.
By Application
Portfolio Company Performance Monitoring dominates with 26.2% due to strict limited partner quarterly reporting demands.
Portfolio Company Performance Monitoring leads with a 26.2% share because limited partners expect regular, clear updates on every holding. Fund managers collect revenue, margin, and debt data from each company and turn it into investor reports. Software that automates this work saves staff time and cuts errors in quarterly reporting.
Deal Sourcing and Pipeline Management grows the fastest as new fund launches keep coming. SEC Form D data shows that new funds filing their first notice in 2026 Q2 had already sold $125.1 billion to 127,361 investors. Private equity funds made up 2,596 of these filings, or 23.8% of the total. More new funds put more capital to work chasing the same deals, which raises competition for good targets.
Key Market Segments
By Functionality
- Portfolio Monitoring and Risk Alerts
- AI Due Diligence and Document Intelligence
- Portfolio Data Aggregation and Normalization
- Deal Pipeline and Intake Management
- Investment-Committee Workflow and Decision Support
- Other
By Deployment
- On-Premises
- Cloud
By Portfolio Type
- Private Equity and Venture Capital Portfolios
- Real Estate and Infrastructure Portfolios
- Public Markets and Multi-Asset Portfolios
- Corporate Project and Product Portfolios
- Other
By Application
- Portfolio Company Performance Monitoring
- Deal Sourcing and Pipeline Management
- Investment Portfolio Management
- Project and Product Portfolio Management
- Fundraising and LP Relationship Management
- Investment Operations and Compliance
Geopolitical Impact Analysis
Geopolitical stress mostly hits this market through the cost of computing hardware and cloud capacity. The software itself does not cross borders as physical goods. Vendors rent GPU servers, storage, and network gear from cloud providers. All of these depend on chip and electronics supply chains that run through Asia and North America.
The West Asia conflict disrupted energy supplies and shipping routes in 2026. In March, the WTO cut its 2026 goods trade forecast to 1.9% because it feared an oil shock. Higher energy and freight costs raise the price of moving servers and running data centres. Cloud vendors then pass these costs to software buyers through higher hosting fees.
Trade has proven stronger than feared. The WTO raised its 2026 trade volume forecast to 3.9% and expects 4.1% growth in 2027. AI-related goods made up 47% of global goods trade growth. Steady flows of AI hardware keep cloud capacity growing. This supports the cloud deployment model that leads this market.
The WTO forecasts global GDP growth of 2.6% in 2026 and 2.9% in 2027. Modest economic growth makes investors careful with capital. This raises demand for AI risk alerts and portfolio monitoring tools, since funds want early warning on weak assets. Vendors that host data in several regions also lower their exposure to trade and data rules in any one country.
Regional Analysis
North America dominates the AI Portfolio and Pipeline Management Software Market, holding a 43.2% share and generating USD 0.3 billion in revenue. The US hosts most of the world’s largest private equity sponsors, credit funds, and asset managers. These firms run thousands of portfolio companies and deal pipelines.
Local vendors also show strong financial health. Allvue Systems, based in Miami, earns more than USD 200 million in annual recurring revenue. It grows at more than 15% each year and runs margins above 30%. Large institutions keep moving to these platforms. Guggenheim Investments chose Allvue for public credit and private debt portfolio management.
Asia Pacific is the fastest-growing region in the market. China, Japan, South Korea, India and Australia all have growing private capital and infrastructure investment. The IEA expects China’s data centre power use to rise by about 175 TWh, or 170%, by 2030. The WTO projects Asia will lead 2026 trade growth, with imports up 9.5% and exports up 9.9%.
Europe holds the second largest position in the market. Germany, France and the UK host major asset managers and several vendors, including Planisware, cplace and Babele. The IEA expects European data centre power use to grow by more than 45 TWh, or 70%, by 2030. This gives regional cloud providers room to expand. Strict EU data and AI rules shape how buyers pick vendors.
Key Regions and Countries
North America
- US
- Canada
Europe
- Germany
- France
- The UK
- Spain
- Italy
- Rest of Europe
Asia Pacific
- China
- Japan
- South Korea
- India
- Australia
- Rest of APAC
Latin America
- Brazil
- Mexico
- Rest of Latin America
Middle East and Africa
- GCC
- South Africa
- Rest of MEA
Market dynamics
Drivers
| Driver | (~) % Impact on CAGR Forecast | Geographic Relevance | Impact Timeline |
|---|---|---|---|
| Enterprise AI Normalization | +1.9% | Global | Short term (2 years or less) |
| Hybrid-Work Coordination Demand | +1.3% | North America, Europe and Asia-Pacific | Short term (2 years or less) |
| Cloud PPM Migration | +1.1% | Global enterprise markets | Medium term (2 to 4 years) |
| Portfolio Complexity Growth | +0.9% | Global | Short term (2 years or less) |
| Executive Visibility Mandates | +0.7% | North America and Europe | Short term (2 years or less) |
| Open API Ecosystem Maturity | +0.5% | North America, Europe and Asia-Pacific | Medium term (2 to 4 years) |
Enterprise AI Normalization
Eurostat recorded EU enterprise AI usage rising by 6.47 percentage points to 19.95% in 2025, compared with an implied 13.48% in 2024, demonstrating that AI moved from isolated experimentation toward routine business deployment across the two years preceding the baseline.
An operating scenario calibrated to these Eurostat, Microsoft and PMI signals indicates that vendors can shift from dashboard-only seat licensing toward premium copilots, agent-consumption tiers and enterprise portfolio subscriptions, potentially reducing acquisition friction by approximately 8%–12% and lifting expansion revenue per established account by 5%–9%, thereby supporting the estimated +1.9% contribution to the baseline CAGR.
Restraints
| Restraint | (~) % Impact on CAGR Forecast | Geographic Relevance | Impact Timeline |
|---|---|---|---|
| Regulated-Use Compliance Exposure | -1.4% | Europe-led, with global spillover | Short term (2 years or less) |
| Unproven Enterprise-Level ROI | -1.0% | Global | Short term (2 years or less) |
| Long Public Procurement Cycles | -0.7% | Europe, North America and Asia-Pacific | Medium term (2 to 4 years) |
| Legacy-Suite Switching Costs | -0.6% | Mature enterprise markets | Medium term (2 to 4 years) |
| High Implementation Prepayment | -0.5% | Small and mid-sized enterprises globally | Short term (2 years or less) |
| Vendor-Consolidation Policies | -0.4% | North America and Europe | Medium term (2 to 4 years) |
Regulated-Use Compliance Exposure
The European Commission states that the AI Office and national authorities began implementing, supervising and enforcing the EU AI Act on 2 August 2026, turning governance deficiencies from prospective concerns into immediate procurement blockers for AI systems influencing employment, resource allocation or other consequential decisions.
The EU AI Act Service Desk specifies maximum penalties of €35 million or 7% of worldwide annual turnover for prohibited practices, while other operator breaches can attract up to €15 million or 3%, materially increasing the downside considered by legal and risk committees.
The European Data Protection Board separately places severe GDPR infringements at up to €20 million or 4% of worldwide annual turnover, and NIST’s generative-AI profile identifies personal-data leakage, unauthorized disclosure, data poisoning and weak provenance as controls that deployers must address.
EDPB and NIST requirements indicate that security assessments, impact classification, human-oversight design and audit logging can extend regulated-enterprise evaluations by approximately 8–16 weeks, raise implementation expenditure by 12%–20% and compress initial contract gross margin by 3–6 percentage points.
Challenges
| Challenge | (~) % CAGR Friction Drag | Geographic Relevance | Mitigation Horizon |
|---|---|---|---|
| AI-PMO Talent Scarcity | -0.9% | Global | Medium term (2 to 4 years) |
| Fragmented Project Data | -0.7% | Global enterprise markets | Medium term (2 to 4 years) |
| Prediction Reliability Drift | -0.6% | Global | Long term (4 years or more) |
| Integration Maintenance Burden | -0.5% | North America, Europe and Asia-Pacific | Medium term (2 to 4 years) |
| Expanding Cyber Attack Surface | -0.4% | Global | Long term (4 years or more) |
| User Workflow Resistance | -0.3% | Global | Medium term (2 to 4 years) |
AI-PMO Talent Scarcity
The World Economic Forum’s 2025 employer survey found that 63% of employers considered skills gaps a leading barrier to transformation, that 59 out of every 100 workers would require training by 2030, and that 77% of employers planned workforce upskilling, indicating sustained competition for personnel who combine portfolio governance, data engineering, and AI-control capabilities.
PMI’s 2024 research similarly found that 64% of senior leaders believed project teams needed new technical skills, while the International Labour Organization’s 2025 task-level analysis concluded that 1 in 4 workers held occupations with some generative-AI exposure but that human input would remain necessary across most affected roles.
A workforce-cost sensitivity anchored to the WEF, PMI and ILO findings indicates that this gap can raise implementation labor costs by approximately 12%–18%, extend time to measurable value by 3–6 months and create a recurring 2–4 percentage-point services-margin drag unless vendors invest in certification programs, implementation partners, explainable workflows and role-based customer academies.
Opportunities
| Opportunity | (~) % Potential CAGR Upside | Geographic Relevance | Execution Window |
|---|---|---|---|
| Packaged Midmarket AI PPM | +1.1% | Global, especially Asia and Latin America | Medium term (2 to 4 years) |
| Outcome-Based Portfolio Pricing | +0.8% | Mature SaaS markets | Medium term (2 to 4 years) |
| Verticalized Delivery Intelligence | +0.7% | Healthcare, construction and manufacturing | Medium term (2 to 4 years) |
| Emerging-Market Localization | +0.6% | India, Southeast Asia, Africa and Latin America | Long term (4 years or more) |
| Cross-Tool Autonomous Agents | +0.5% | North America, Europe and Asia-Pacific | Medium term (2 to 4 years) |
| Managed AI-PMO Services | +0.4% | Global | Medium term (2 to 4 years) |
Packaged Midmarket AI PPM
This opportunity remains future white space rather than a current driver because OECD evidence for 2024 showed AI adoption of approximately 40% among firms with at least 250 employees, versus only 20.4% among firms with 50–249 employees and 11.9% among firms with 10–49 employees.
Eurostat’s 2025 enterprise survey preserved the same size gradient, with adoption at 55.03% for large EU enterprises, 30.36% for medium enterprises and 17% for small enterprises, showing that the installed market remains concentrated above the midmarket.
A product-and-channel scenario calibrated to these OECD, Eurostat and World Bank gaps indicates that preconfigured portfolio templates, guided data mapping, capped usage bundles and partner-led onboarding could reduce implementation hours per customer by approximately 30%–40%.
Lower customer-acquisition cost by 15%–20% and expand gross margin by 4–7 percentage points; this would open a meaningful share of currently unmet demand without depending on enterprise-scale customization and could add approximately +1.1% to the baseline CAGR if executed consistently.
Key Players Analysis
BlackRock leads Tier 1 by financial scale. Its total revenue rose 19% to USD 24.2 billion in 2025. Technology services and subscription revenue, led by Aladdin and eFront, reached USD 2.0 billion, up 24%. Annual contract value grew 31% including Preqin and 16% without it. This gives BlackRock a strong position in private markets data and workflow.
Planisware leads in project and product portfolios. In the first half of 2025, it spent 11.7% of revenue, or EUR 11.2 million, on R&D. Its capitalized development costs rose 23.4% to EUR 3.1 million in 2025. Planview also holds Tier 1 status in strategic portfolio management. In February 2025, it bought Sciforma to widen its project portfolio offering.
Allvue Systems leads Tier 2 in alternative investment software. Vista Equity Partners created the firm in 2019 by merging AltaReturn and Black Mountain Systems. Vista then added PFA Solutions in 2024. Chronograph and Dynamo Software compete in LP and GP portfolio monitoring. Dynamo also grows by buying smaller firms, such as InvestHub.
cplace, Babele, Acuity PPM and Completix serve niche project and portfolio buyers. Knoh AI and DiligenceVault focus on AI deal workflow and due diligence data. None of these firms publish public revenue figures. They compete on how fast they deploy and how specialized their AI features are.
Top Key Players in the Market
- Allvue Systems, LLC
- Acuity PPM, LLC
- Babele S.r.l.
- BlackRock, Inc.
- cplace GmbH
- Chronograph, Inc.
- Completix, Inc.
- Dynamo Software, Inc.
- Knoh AI, Inc.
- Planisware SA
- Planview, Inc.
- DiligenceVault, Inc.
Recent Developments
- In March 2025, BlackRock completed its purchase of 100% of Preqin Holding Limited for GBP 2.5 billion (about USD 3.2 billion) in cash, adding private markets data to its Aladdin and eFront platforms.
- In February 2026, Planisware reported full-year 2025 revenue of EUR 198.0 million, up 7.9%, with SaaS and hosting subscriptions growing 16.7% in constant currencies.
- In June 2026, Chronograph secured a minority growth investment of more than USD 140 million from Sixth Street Growth to expand its AI products and launch a private credit portfolio monitoring platform.
- In August 2026, Vista Equity Partners hired Evercore and Barclays to explore a sale of Allvue Systems that could value the firm at up to USD 3 billion, including debt.
Report Scope
| Report Features | Description |
|---|---|
| Market Value (2025) | USD 0.7 billion |
| Forecast Revenue (2035) | USD 4.6 billion |
| CAGR (2026-2035) | 21.7% |
| Base Year for Estimation | 2025 |
| Historic Period | 2020-2024 |
| Forecast Period | 2026-2035 |
| Report Coverage | Revenue Forecast, Market Dynamics, Competitive Landscape, Recent Developments |
| Segments Covered | By Functionality (Portfolio Monitoring and Risk Alerts, AI Due Diligence and Document Intelligence, Portfolio Data Aggregation and Normalization, Deal Pipeline and Intake Management, Investment-Committee Workflow and Decision Support, Other); By Deployment (On-Premises, Cloud); By Portfolio Type (Private Equity and Venture Capital Portfolios, Real Estate and Infrastructure Portfolios, Public Markets and Multi-Asset Portfolios, Corporate Project and Product Portfolios, Other); By Application (Portfolio Company Performance Monitoring, Deal Sourcing and Pipeline Management, Investment Portfolio Management, Project and Product Portfolio Management, Fundraising and LP Relationship Management, Investment Operations and Compliance) |
| Regional Analysis | North America – US, Canada; Europe – Germany, France, The UK, Spain, Italy, Rest of Europe; Asia Pacific – China, Japan, South Korea, India, Australia, Singapore, Rest of APAC; Latin America – Brazil, Mexico, Rest of Latin America; Middle East & Africa – GCC, South Africa, Rest of MEA |
| Competitive Landscape | Allvue Systems, LLC, Acuity PPM, LLC, Babele S.r.l., BlackRock, Inc., cplace GmbH, Chronograph, Inc., Completix, Inc., Dynamo Software, Inc., Knoh AI, Inc., Planisware SA, Planview, Inc., DiligenceVault, Inc. |
| Customization Scope | Customization for segments, region/country-level will be provided. Moreover, additional customization can be done based on the requirements. |
| Purchase Options | We have three licenses to opt for: Single User License, Multi-User License (Up to 5 Users), Corporate Use License (Unlimited Users and Printable PDF) |





























