


Report Overview
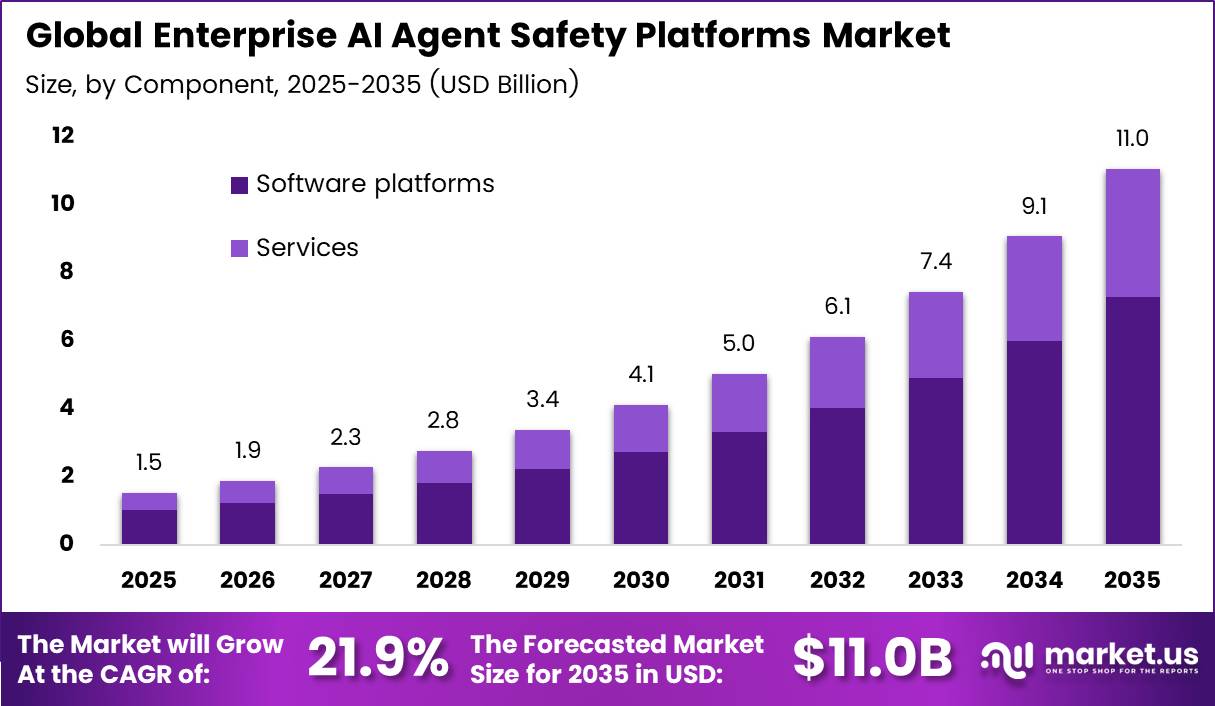
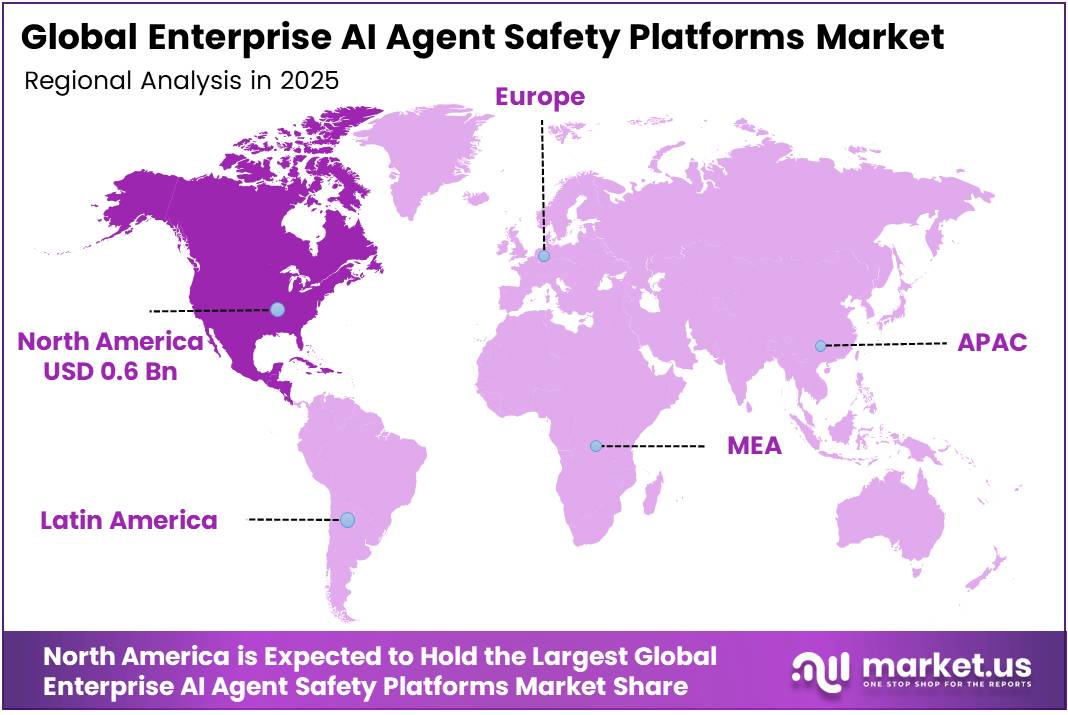
In 2025, the Global Enterprise AI Agent Safety Platforms Market was valued at USD 1.5 billion. The market is projected to grow at a CAGR of 21.9% during 2026–2035, reaching approximately USD 11.0 billion by 2035. North America dominated the global market in 2025, accounting for more than 37.0% of the total market share and generating approximately USD 0.6 billion in revenue.
Digital growth drives this demand. The ITU reports that about 5.5 billion people used the internet in 2024, or 68% of the world’s population. That gives AI agents a huge pool of users, data, and transactions to handle. Big cloud providers keep spending more on AI. Microsoft reported about USD 88 billion in capital spending in FY2025, mostly on AI and cloud systems.
North American region holds the main AI model builders, the largest cloud platforms, and the biggest security vendors. The IMF puts US GDP above USD 29 trillion in 2024, the largest of any nation. That wealth funds heavy enterprise IT budgets. Rules also push buyers to act. The US SEC requires listed firms to report material cyber incidents within 4 business days.
Key Takeaways
- The Enterprise AI Agent Safety Platforms Market reached USD 1.5 billion in 2025 and will reach USD 11.0 billion by 2035. at a CAGR of 21.9% during the 2026 to 2035 forecast period.
- Software platforms lead the Component segment with a 68.0% share.
- Cloud-based deployment leads the Deployment Mode segment with a 56.0% share.
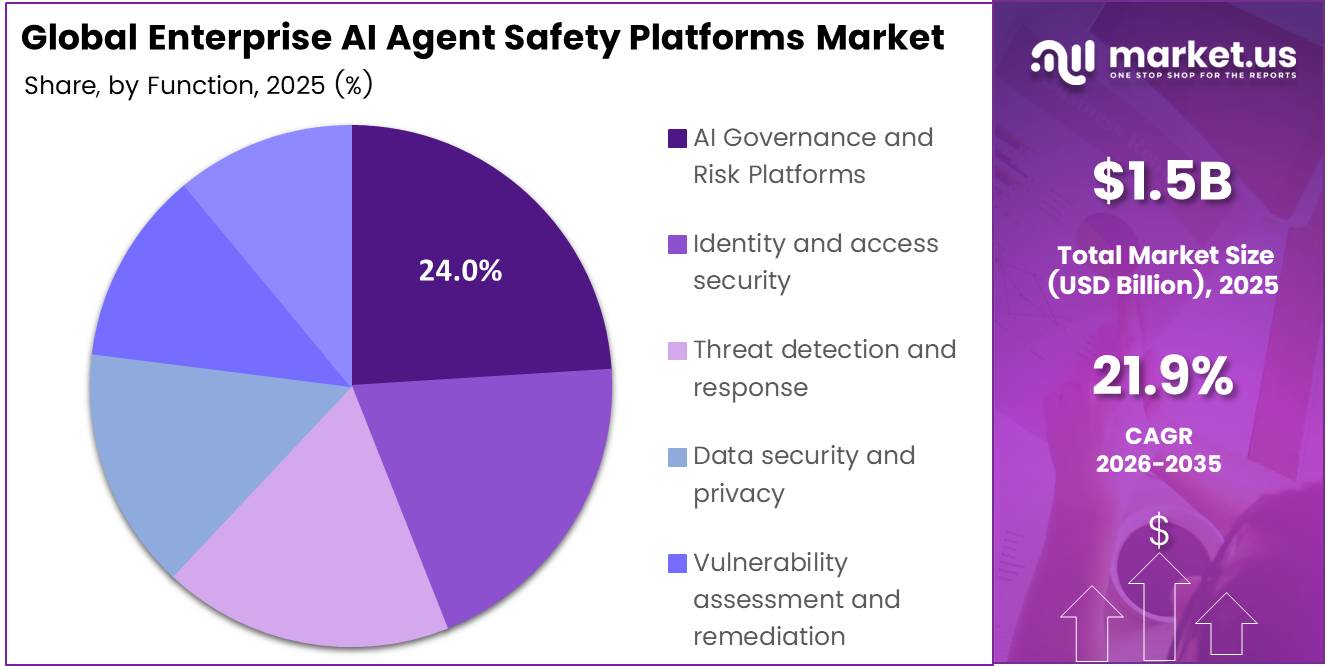
- AI governance and risk platforms lead the Function segment with a 24.0% share.
- Large enterprises lead the Organisation Size segment with a 74.0% share.
- IT and telecommunications lead the End-Use Industry segment with a 25.0% share.
- North America leads with a 37.0% share and USD 0.6 billion in revenue.
By Component
Software platforms dominate with 68.0% due to reusable, always-on agent control layers.
Software platforms lead because companies want one control layer that watches every AI agent all the time. Buyers prefer software they can pay for each year and add to over time. IBM’s SEC annual report shows this pattern: its software revenue reached $29,962 million in 2025, up 10.6%. Its annual recurring software revenue hit $23.6 billion, about $2 billion more than the year before.
Software also now makes up about 45% of IBM’s total revenue. That share shows how much large buyers favor software they can roll out across many teams at once. Services is the fastest-growing sub-segment because most firms lack the skills to set up and run agent safety controls.
In an OECD survey, 75% of firms use ready-made AI tools, only 5% use customised AI, and just 3.6% run agentic AI. Only 19% use AI across the whole company. This gap pushes buyers toward consulting, integration, and managed services.
By Deployment Mode
Cloud-based dominates with 56.0% due to fast rollout across agent environments.
Cloud-based tools lead because most AI agents already run on cloud systems, so safety controls sit right next to them. Eurostat reports that 52.74% of EU enterprises bought paid cloud services in 2025. That is 7.42 percentage points more than in 2023.
Among large enterprises, cloud use reached 84.67%. Of large firms that buy cloud services, 87.67% buy infrastructure services. These are the main buyers of agent safety tools. Hybrid is the fastest-growing mode because regulated firms want cloud speed but need to keep sensitive data on their own servers.
By Function
AI governance and risk platforms dominate with 24.0% due to rising board-level AI accountability demands.
Governance and risk platforms lead because boards must show who controls each AI agent and what it is allowed to do. NIST’s AI Risk Management Framework gives firms four core functions: Govern, Map, Measure, and Manage. Buyers use it as a checklist when they pick tools.
Identity and access security is growing fastest because every AI agent needs its own login, access rights, and audit trail. Attackers already target weak identity controls. The FBI’s IC3 logged 191,561 phishing and spoofing complaints in 2025. It also received more than 22,000 AI-related complaints with losses above $893 million.
By Organisation Size
Large enterprises dominate with 74.0% due to higher AI use and budgets.
Large enterprises lead because they run the most AI agents and have the largest security budgets. OECD data shows that 40% of firms with 250 or more employees used AI. Only 11.9% of firms with 10 to 49 employees did the same. The size gap is also getting wider. It reached 34.6 percentage points in 2025, up from 23.4 in 2023. More agents in large firms mean more need for safety controls.
Small and medium-sized enterprises are the fastest-growing group because simple generative AI tools have lowered the cost of getting started. AI use among small firms rose from 7.1% in 2023 to 17.4% in 2025. Across all OECD firms, AI use climbed to 20.2% from 14.2% a year earlier. As these firms add agents, they need low-cost, packaged safety tools.
By End-Use Industry
IT and Telecommunications dominate with 25.0% due to the earliest, deepest AI agent use.
IT and telecom firms lead because they build, test, and run AI agents before any other sector. Eurostat found that 48.72% of information and communication firms used AI, far above the EU average of 13.48%. Within this sector, 43.46% of firms use AI mainly for research and new product work.
BFSI is the fastest-growing industry because banks and insurers face heavy fraud losses and strict rules. The FBI’s IC3 recorded 24,768 business email compromise complaints in 2025, with losses of about $3.05 billion. Reported investment fraud losses reached about $8.65 billion. Financial firms that put AI agents into payments and customer service need strong guardrails to stop agent-driven fraud.
Key Market Segments
By Component
- Software platforms
- Services
By Deployment Mode
- Cloud-based
- On-premises
- Hybrid
By Function
- AI governance and risk platforms
- Identity and access security
- Threat detection and response
- Data security and privacy
- Vulnerability assessment and remediation
- Other
By Organisation Size
- Large enterprises
- Small and medium-sized enterprises
By End-Use Industry
- IT and Telecommunications
- BFSI
- Healthcare and life sciences
- Government and defence
- Retail and e-commerce
- Manufacturing
- Energy and utilities
- Other
Geopolitical Impact Analysis
AI agent safety platforms are software, but they run on chips, servers, and cloud data centers. Trade policy raises the cost of that hardware. In April 2025, the US set a baseline reciprocal tariff of 10% on most imports, with higher rates for many Asian suppliers. The WTO cut its 2025 forecast for world merchandise trade to a 0.2% decline, down from expected growth.
Chip export controls split the market. NVIDIA reported a USD 4.5 billion charge in Q1 FY2026 tied to US limits on H20 sales to China. In return, China banned exports of gallium and germanium to the US in December 2024. Both metals go into chip and optical networking supply chains. Vendors must now build separate stacks for Chinese and Western clients, which raises their development costs.
Shipping problems slow hardware delivery. UNCTAD reported that Red Sea attacks cut Suez Canal transits by more than 50%. Ships rerouted around the Cape of Good Hope, adding about 10 to 14 days to Asia-to-Europe voyages. Late GPU and server deliveries push back on-premises installs for banks and defence buyers.
Data rules add another layer of friction. The World Bank tracks a steady rise in data localization laws. The EU AI Act allows fines of up to 7% of global turnover for banned AI practices. Vendors must host data in each region, which favors cloud giants with local data centers.
Regional Analysis
North America dominates the Enterprise AI Agent Safety Platforms Market, holding a 37.0% share and generating USD 0.6 billion in revenue. The US hosts most of the leading model labs, cloud giants, and security vendors, so buyers and sellers sit in the same market.
The Bureau of Economic Analysis reports that the US digital economy adds more than USD 2.6 trillion in value each year. That base gives firms large budgets for AI safety tools. Federal guidance also shapes demand. NIST released its AI Risk Management Framework and a Generative AI Profile that lists more than 200 suggested actions.
Asia Pacific is the fastest-growing region in the market. China, India, Japan and South Korea are scaling AI agents across telecom, manufacturing and finance. India’s IndiaAI Mission approved more than INR 10,000 crore for compute and AI projects. Japan and South Korea passed national AI laws that set new oversight duties.
Europe holds the second position. The EU AI Act drives demand, with rules for high-risk systems taking effect in stages from 2025 to 2027. Germany, France and the UK lead adoption in banking, automotive and public services. Eurostat reports that about 13.5% of EU enterprises used AI in 2024, up from 8% the year before.
Key Regions and Countries
North America
- US
- Canada
Europe
- Germany
- France
- The UK
- Spain
- Italy
- Rest of Europe
Asia Pacific
- China
- Japan
- South Korea
- India
- Australia
- Rest of APAC
Latin America
- Brazil
- Mexico
- Rest of Latin America
Middle East and Africa
- GCC
- South Africa
- Rest of MEA
Market Dynamics
Drivers
| Driver | (~) % Impact on CAGR Forecast | Geographic Relevance | Impact Timeline |
|---|---|---|---|
| Agent hijacking exposure | +1.4% | Global | Short term (2 years or less) |
| Enterprise agent deployment expansion | +1.0% | North America, Europe, Asia-Pacific | Short term (2 years or less) |
| Operational audit-trail demand | +0.7% | Global regulated enterprises | Short term (2 years or less) |
| Centralized agent policy enforcement | +0.5% | Global multi-business enterprises | Medium term (2 to 4 years) |
| Production incident-response integration | +0.4% | North America, Europe | Short term (2 years or less) |
Agent Hijacking Exposure
Agent access to external messages, files, and websites creates an immediate need for runtime safety because malicious instructions can redirect legitimate workflows rather than merely produce undesirable text: according to NIST’s January 2025 evaluation work, the underlying weakness is insufficient separation between trusted instructions and untrusted data.
The table’s +1.4-percentage-point contribution is an analyst scenario assumption, not an institutional forecast: it represents stronger conversion of production deployments into recurring, protected-workflow subscriptions instead of occasional assessment engagements.
All table percentages are incremental percentage-point sensitivities to the user-supplied 21.9% baseline, not independently measured causal effects; across the four sections, positive sensitivities total 6.7 points and negative sensitivities total 4.7 points, giving an illustrative all-factor CAGR of 23.9%, with positive-only and negative-only stress cases of 28.6% and 17.2%, respectively. Evidence is restricted to information available through October 9, 2026.
Restraints
| Restraint | (~) % Impact on CAGR Forecast | Geographic Relevance | Impact Timeline |
|---|---|---|---|
| Unresolved personal-data processing legality | -1.0% | EU, EEA, EU-facing enterprises | Short term (2 years or less) |
| Prohibited agent application categories | -0.6% | EU, EU-facing suppliers | Short term (2 years or less) |
| Unavailable discretionary procurement budgets | -0.5% | Global budget-constrained enterprises | Short term (2 years or less) |
| Managed-service deployment prohibitions | -0.4% | Sovereign, defense, sensitive-data enterprises | Medium term (2 to 4 years) |
| Unaccepted vendor liability allocation | -0.3% | Global high-consequence workflows | Short term (2 years or less) |
Unresolved Personal-Data Processing Legality
The structural sales barrier is the inability to authorize a specific processing arrangement, not a blanket prohibition on AI safety platforms: according to the European Data Protection Board’s December 2024 opinion, models trained on personal data cannot automatically be treated as anonymous.
Under the European Data Protection Board’s legitimate-interest guidance, the relevant assessment comprises 3 stages: legitimate purpose, necessity, and balancing of rights, so contracts requiring identifiable prompts, traces, or model outputs can remain blocked when the customer cannot establish an appropriate lawful basis. The modeled -1.0-percentage-point deduction applies only to those blocked purchases; it is not a published estimate of regulatory impact.
Challenges
| Challenge | (~) % CAGR Friction Drag | Geographic Relevance | Mitigation Horizon |
|---|---|---|---|
| Inspection Cost And Latency | -0.7% | Global high-volume agent deployments | Short term (2 years or less) |
| Safety Evaluation Coverage Gaps | -0.4% | Global | Medium term (2 to 4 years) |
| Legacy Workflow Integration Complexity | -0.3% | Global established enterprises | Medium term (2 to 4 years) |
| Specialist Safety Engineering Capacity | -0.3% | North America, Europe, Asia-Pacific | Medium term (2 to 4 years) |
| Multilingual Policy Calibration Drift | -0.2% | Multilingual enterprise markets | Long term (4 years or more) |
Inspection Cost And Latency
The operational vulnerability is that inspecting every intermediate agent interaction adds processing to workflows already burdened by large tool definitions and results; according to Anthropic’s November 2025 engineering measurements, a conventional tool-loading example consumed approximately 77,000 tokens before substantive work, versus approximately 8,700 with on-demand discovery.
Per Anthropic’s code-execution example, moving intermediate processing outside the model context reduced token usage from 150,000 to 2,000, a reported 98.7% reduction in that specific demonstration—not a general safety-platform cost saving. As recommended in Anthropic’s tool-engineering guidance, enterprises should separately measure runtime, tool-call counts, token consumption, and tool errors.
The analyst-modeled -0.7-percentage-point friction reflects slower expansion when additional inspection costs weaken per-workflow economics without preventing initial sales. Sustained mitigation requires tiered inspection, deterministic checks where appropriate, and risk-sensitive escalation, with vendors validating both security coverage and processing economics before committing to high-volume subscription prices.
Opportunities
| Opportunity | (~) % Potential CAGR Upside | Geographic Relevance | Execution Window |
|---|---|---|---|
| Delegated agent identity assurance | +1.0% | Global, initially North America | Medium term (2 to 4 years) |
| Insurer-integrated safety attestation | +0.6% | North America, Europe | Medium term (2 to 4 years) |
| Industrial and physical-agent safety | +0.5% | Manufacturing-intensive economies | Long term (4 years or more) |
| Agent transaction escrow controls | +0.3% | Global digital commerce ecosystems | Medium term (2 to 4 years) |
| Independent safety certification services | +0.3% | Global enterprise supply networks | Long term (4 years or more) |
Delegated Agent Identity Assurance
The white space is a portable service that verifies an agent’s principal, delegated authority, and authorization boundaries across organizational domains, rather than another instance of existing internal policy enforcement.
As reflected in NIST’s initiative announcement, standards, open protocols, and security-and-identity research constitute 3 complementary workstreams, but do not guarantee immediate interoperability or commercial adoption.
The analyst scenario assigns +1.0 percentage point of potential CAGR upside and tests a 15–25% reduction in implementation hours per connected enterprise plus a 2–4-percentage-point gross-margin improvement from reusable authorization connectors; these are explicit commercial assumptions, not NIST estimates.
Key Players Analysis
Tier 1 leaders control the cloud layer where most AI agents run. Microsoft reported FY2025 revenue of USD 281.7 billion and R&D spending of USD 32.5 billion. It builds agent controls into Entra, Purview, and Defender. Amazon Web Services posted 2024 revenue of USD 107.6 billion and offers Bedrock Guardrails. Google Cloud posted USD 43 billion in 2024 revenue, backed by Alphabet’s large AI capex plan.
Security platform leaders use acquisitions to grow fast. Palo Alto Networks agreed to buy CyberArk for about USD 25 billion in July 2025 to secure human, machine, and AI agent identities. It closed the deal in February 2026. Cisco paid about USD 28 billion for Splunk in 2024. NVIDIA supplies NeMo Guardrails on top of data center revenue of more than USD 115 billion in FY2025. IBM sells watsonx. Governance to regulated buyers.
Tier 2 challengers hold strong niche positions. CrowdStrike reported FY2025 revenue of USD 3.95 billion. SentinelOne agreed to buy Prompt Security for about USD 250 million in August 2025 to add runtime protection against prompt injection and data leaks. Check Point closed its Lakera deal in October 2025 to build a full AI security stack. Zscaler extends its zero trust cloud to cover AI traffic.
Specialist vendors such as HiddenLayer, Fiddler AI and Galileo focus on model scanning, monitoring and evaluation. Their small size makes them likely buyout targets as Tier 1 firms fill gaps in their portfolios.
Top Key Players in the Market
- Microsoft Corporation
- Amazon Web Services, Inc.
- Google LLC / Google Cloud
- Palo Alto Networks, Inc.
- Cisco Systems, Inc.
- IBM Corporation
- NVIDIA Corporation
- CrowdStrike Holdings, Inc.
- Check Point Software Technologies Ltd. / Lakera
- SentinelOne, Inc. / Prompt Security
- CyberArk Software Ltd.
- HiddenLayer, Inc.
- Fiddler AI, Inc.
- Galileo Technologies, Inc.
- Zscaler, Inc.
Recent Developments
- In February 2026, Palo Alto Networks completed its acquisition of CyberArk, valued at about USD 25 billion in equity, and made identity security a core pillar of its platform for human, machine, and AI agent identities. Palo Alto Networks agreed to acquire Protect AI, at a reported value of more than USD 500 million, to secure AI models and applications through its Prisma AIRS platform.
- In October 2025, Check Point Software Technologies closed its acquisition of Lakera, a Zurich-based AI-native security platform for agentic AI, at a reported value of about USD 300 million.
- In September 2025, CrowdStrike agreed to acquire Pangea for about USD 260 million to add AI detection and response for prompts and agent activity to its Falcon platform.
- In August 2025, SentinelOne signed a definitive agreement to acquire Prompt Security for about USD 250 million in cash and stock to protect enterprise generative AI use in real time.
Report Scope
| Report Features | Description |
|---|---|
| Market Value (2025) | USD 1.5 Billion |
| Forecast Revenue (2035) | USD 11.0 Billion |
| CAGR (2026-2035) | 21.9% |
| Base Year for Estimation | 2025 |
| Historic Period | 2020-2024 |
| Forecast Period | 2026-2035 |
| Report Coverage | Revenue Forecast, Market Dynamics, Competitive Landscape, Recent Developments |
| Segments Covered | By Component (Software Platforms, Services); By Deployment Mode (Cloud-based, On-premises, Hybrid); By Function (AI Governance and Risk Platforms, Identity and Access Security, Threat Detection and Response, Data Security and Privacy, Vulnerability Assessment and Remediation, Other); By Organisation Size (Large Enterprises, Small and Medium-sized Enterprises); By End-Use Industry (IT and Telecommunications, BFSI, Healthcare and Life Sciences, Government and Defence, Retail and E-commerce, Manufacturing, Energy and Utilities, Other) |
| Regional Analysis | North America – US, Canada; Europe – Germany, France, The UK, Spain, Italy, Rest of Europe; Asia Pacific – China, Japan, South Korea, India, Australia, Singapore, Rest of APAC; Latin America – Brazil, Mexico, Rest of Latin America; Middle East & Africa – GCC, South Africa, Rest of MEA |
| Competitive Landscape | Microsoft Corporation, Amazon Web Services, Inc., Google LLC / Google Cloud, Palo Alto Networks, Inc., Cisco Systems, Inc., IBM Corporation, NVIDIA Corporation, CrowdStrike Holdings, Inc., Check Point Software Technologies Ltd. / Lakera, SentinelOne, Inc. / Prompt Security, CyberArk Software Ltd., HiddenLayer, Inc., Fiddler AI, Inc., Galileo Technologies, Inc., Zscaler, Inc. |
| Customization Scope | Customization for segments, region/country-level will be provided. Moreover, additional customization can be done based on the requirements. |
| Purchase Options | We have three licenses to opt for: Single User License, Multi-User License (Up to 5 Users), Corporate Use License (Unlimited Users and Printable PDF) |





























