


Report Overview
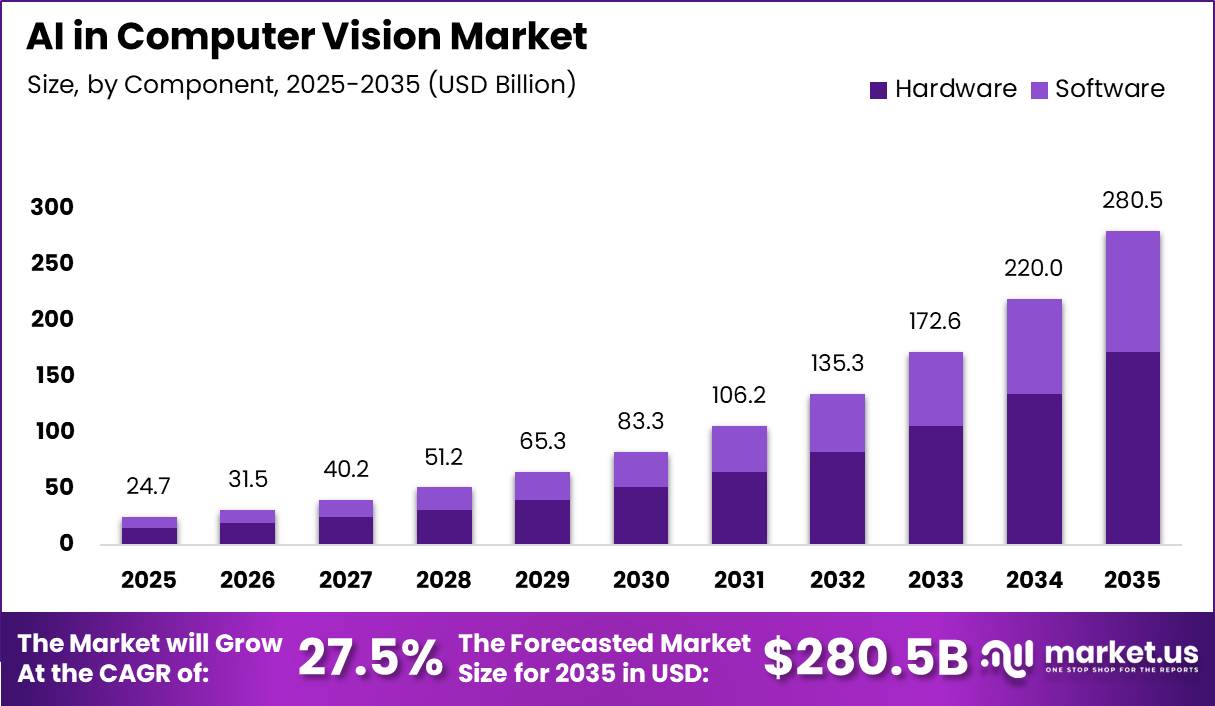
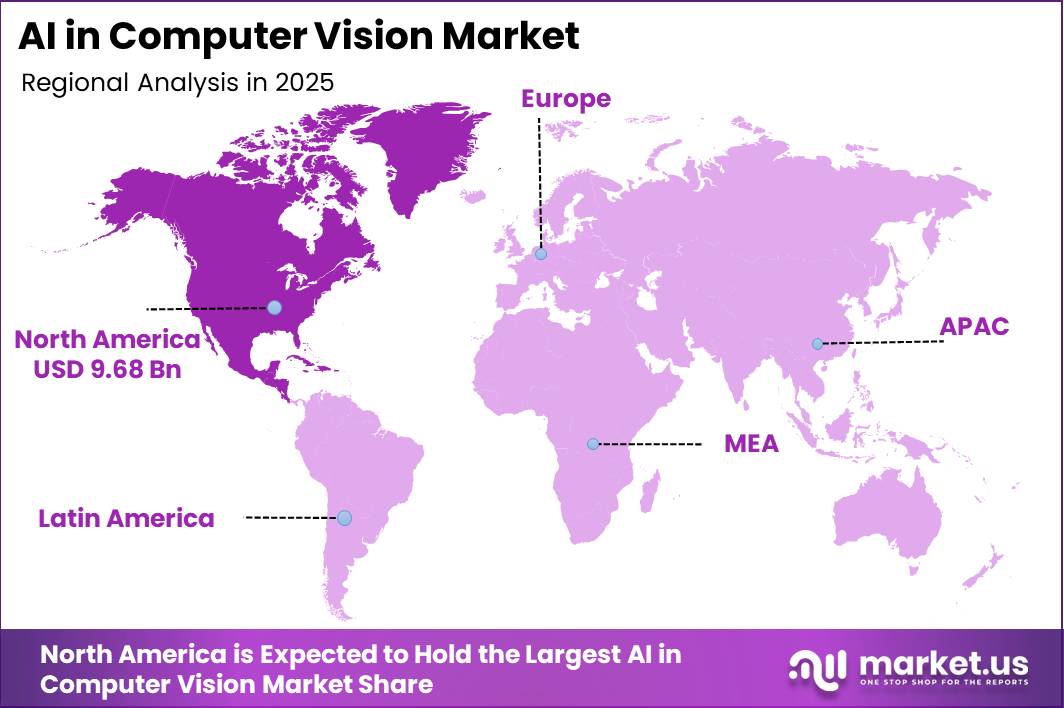
In 2025, the Global AI in Computer Vision Market was valued at USD 24.7 billion. The market is projected to grow at a CAGR of 27.5% during 2026–2035, reaching approximately USD 280.5 billion by 2035. North America dominated the global market in 2025, accounting for more than 39.2% of the total market share and generating approximately USD 9.6 billion in revenue.
Global industrial robot installations reached a record 542,000 units in 2024, nearly doubling over the previous decade. These robots increasingly use AI-based vision systems for product picking, sorting, assembly monitoring, and automated quality inspection. China installed 295,000 industrial robots in 2024, representing more than half of global installations.
Collaborative robot installations also increased by 13% year-on-year to more than 64,500 units. Cobots depend on real-time cameras, sensors, and visual analysis to safely operate alongside workers. In addition, global manufacturing value added reached approximately USD 16.8 trillion in 2024, increasing pressure on factories to improve productivity while reducing defects and production losses.
North America’s leading position is supported by strong automotive, electronics, aerospace, and advanced manufacturing industries. The United States produced 10.24 million vehicles in 2025, creating significant demand for vision systems used to inspect welds, paint quality, component placement, and assembly accuracy.
Global vehicle production also increased by 3.9% to 96.4 million units in 2025. As manufacturers deploy more robots and cobots, demand for computer vision cameras, processors, software, and AI models is expected to rise steadily, supporting an almost elevenfold market expansion through 2035.
Key Takeaway
- The AI in Computer Vision Market was valued at USD 24.7 billion in 2025 and is projected to reach USD 280.5 billion by 2035, growing at a 27.5% CAGR.
- The software component dominated the market in 2025, accounting for 61.5% of the total share.
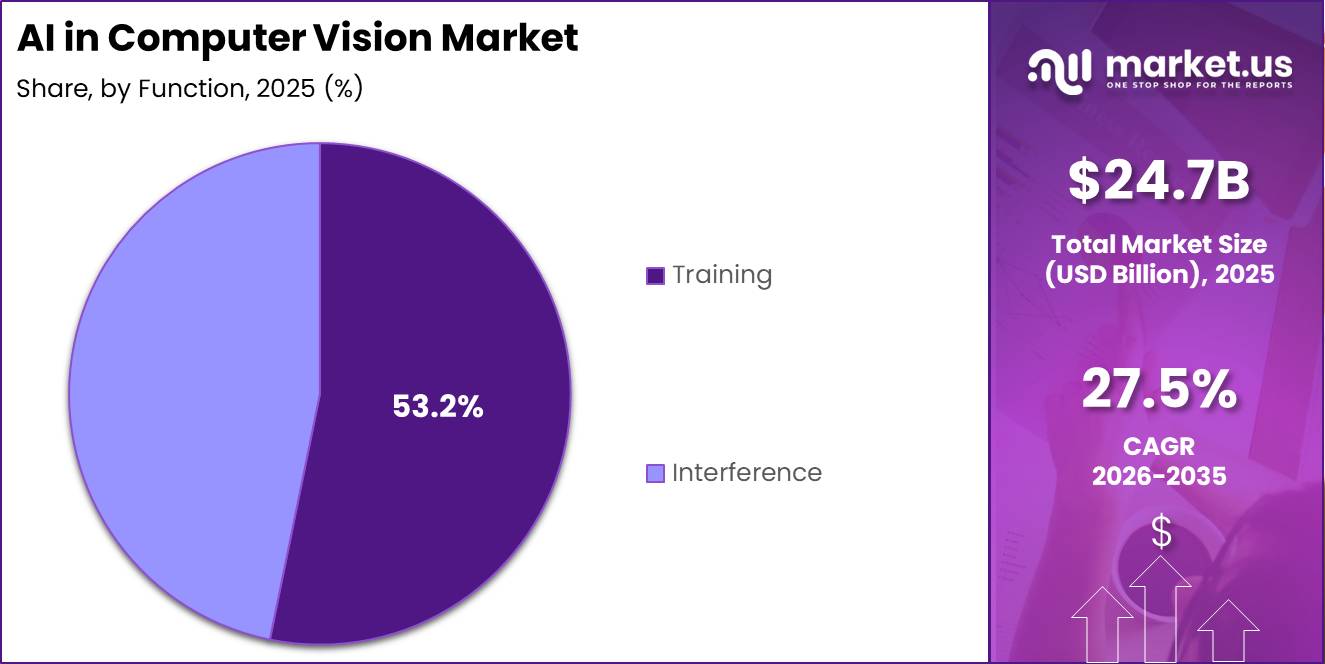
- The training function held the leading position in 2025, capturing 53.2% of the total market share.
- Non-industrial applications dominated in 2025, representing 56.3% of the overall market.
- Consumer electronics emerged as the leading end-user segment in 2025, accounting for 19.5% of the total share.
- North America led the global market in 2025, holding more than 39.2% share and generating approximately USD 9.6 billion in revenue.
Market Statistics and Data Insights
- Global industrial robot installations reached 542,000 units in 2024, more than double the level recorded 10 years earlier, creating a larger installed base for AI-powered vision systems used in robotic guidance, inspection, and automation.
- China installed 295,000 industrial robots in 2024, representing 54% of global installations, making it the largest automation market and a major demand center for machine vision cameras, sensors, and AI inspection systems.
- AI PCs are accelerating edge-based computer vision adoption. Global AI PC shipments are projected to reach 77.8 million units in 2025, representing 31% of the worldwide PC market.
- A U.S. manufacturing AI adoption study covering approximately 28,500 establishments identified implementation barriers, including cost, limited applicable use cases, and a shortage of expertise, showing that organizational readiness remains a key factor for computer vision adoption.
- Industrial robot installations worldwide exceeded 500,000 units annually for the fourth consecutive year, showing sustained automation investment and increasing demand for AI-powered visual control systems.
- A 2025 computer vision face-detection evaluation found that reducing image resolution from 320 × 320 pixels to 160 × 160 pixels caused only a 4.38% reduction in F1-score for YOLOv7-tiny, showing resilience under lower-resolution inputs.
- The same 2025 face-detection evaluation showed that combined lighting variation and image occlusion reduced precision by 48.2%, while recall declined by 5.5%, highlighting environmental challenges for AI vision accuracy.
- NVIDIA’s 2026 Alpha-Vision edge vision processor achieved face-detection latency of 787 microseconds, detection accuracy of 99.3%, power consumption of 4.6 mW, and operation at 60 FPS for always-on vision applications.
- A 2025 UAV computer vision deployment study showed YOLOv8n achieved 52 FPS on NVIDIA Jetson Orin NX and improved to 65 FPS using INT8 quantization for edge-based drone vision processing.
- A 2025 Microsoft Research experiment analyzing AI-generated image detection collected approximately 287,000 image evaluations from more than 12,500 participants, with humans achieving only 62% accuracy in identifying AI-generated images.
By Component
In 2025, the software component held a dominant position in the AI in computer vision market, accounting for 61.5% of the total share. This leadership is supported by rising investment in digital infrastructure, artificial intelligence platforms, and cloud-based software solutions. In the United States, private fixed investment in information-processing equipment and software reached USD 1.1 trillion in 2024, highlighting the strong financial focus on enterprise technology.
Global software spending also reached USD 675 billion in 2024, with the United States contributing USD 368.5 billion, representing more than half of the worldwide total. Computer vision systems rely heavily on software because cameras and sensors only collect images, while AI algorithms process the data and perform object detection, image classification, quality inspection, and automated decision-making.
By Function
In 2025, the Training function held a dominant position in the AI in computer vision market, capturing 53.2% of the total share. This leadership is mainly driven by the high computing power required to build, test, and improve computer vision models before deployment.
AI-focused data centres consumed approximately 155 TWh of electricity in 2025. Training a single large AI model, such as Grok 4, reportedly required nearly 0.31 TWh of electricity, showing the significant energy and computing resources involved in model development.
Data centre electricity consumption in the United States also increased from 58 TWh in 2014 to 176 TWh in 2023. It is projected that data centres could account for up to 12% of total U.S. electricity consumption by 2028.
By Application
In 2025, Non-industrial applications held a dominant position in the AI in computer vision market, accounting for 56.3% of the total share. This leadership is supported by the broad use of computer vision across transportation safety, retail, healthcare, smart cities, security, and consumer electronics.
Road safety represents a major area of adoption. Around 1.1 million people die in road traffic accidents each year, encouraging governments and automotive companies to use AI-powered traffic cameras, number-plate recognition, pedestrian detection, and driver-monitoring systems. These technologies help identify unsafe driving, improve traffic control, and support faster emergency responses.
Retail also creates strong demand for computer vision solutions. Global business e-commerce sales reached nearly USD 27 trillion in 2022, while online retail accounted for approximately 25% to 30% of total retail activity in markets such as China, the United Kingdom, and South Korea. Retailers increasingly use vision-based systems for automated checkout, shelf monitoring, inventory management, customer analysis, and store security.
By End-User
In 2025, the Consumer Electronics end-user segment held a leading position in the AI in computer vision market, accounting for 19.5% of the total share. This dominance is supported by the large global use of smartphones, smart televisions, wearable devices, tablets, and other camera-enabled electronics.
According to the ITU, worldwide mobile-cellular subscriptions reached 9.1 billion in 2024, exceeding the global population by 12.1%. Modern mobile devices increasingly include AI-supported camera features such as facial recognition, face unlock, scene detection, image stabilization, background removal, and automatic photo enhancement.
China’s General Administration of Customs also reported that the country exported 814 million mobile phone units in 2024, marking the first annual increase in 8 years. This growth indicates renewed consumer demand and rising production of advanced mobile devices across international markets. Each smartphone, smart TV, and wearable camera requires embedded processors, vision chips, sensors, and AI software to analyse images directly on the device.
Key Market Segments
By Component
- Hardware
- Software
By Function
- Training
- Interference
By Application
- Industrial
- Non-Industrial
By End-User
- Automotive
- Consumer Electronics
- Healthcare
- Retail
- Transportation and Logistics
- Others
Geopolitical Impact Analysis
Geopolitical tensions are increasing costs and supply risks across the AI in computer vision hardware value chain. In January 2026, the United States imposed a 25% tariff on selected advanced semiconductor imports under a chip-related trade agreement. Earlier, tariffs on Chinese semiconductors increased to 50% in 2025. These measures raise the cost of GPUs, processors, and image-processing chips used for computer vision training and inference.
Supply pressure is also rising because China accounts for nearly 95% of global gallium and germanium production. These materials are important for manufacturing semiconductors, sensors, and optical components. China’s export restrictions introduced in December 2024 reduced international access to these inputs, creating sourcing challenges for camera, sensor, and processor manufacturers.
Shipping disruptions have added further pressure. During the 2024 Red Sea crisis, container ship transits through the region declined by 67% year-on-year. Many shipping companies redirected vessels around Africa, increasing travel distances, delivery times, and fuel expenses. Shanghai-to-Europe freight rates also rose by more than 3 times within a few weeks. This affected the timely supply of cameras, imaging modules, sensors, and edge-computing equipment.
The United States also lacks sufficient domestic production capacity for approximately 60% of the specialty chemicals required for semiconductor manufacturing. As a result, computer vision hardware companies are expanding supplier networks, relocating selected production activities, and purchasing materials from regions facing lower tariff exposure.
Regional Analysis
In 2025, North America held a dominant position in the global AI in computer vision market, capturing 39.2% of the total share and generating approximately USD 9.6 billion in revenue. The region’s leadership is supported by its advanced technology ecosystem, strong venture capital activity, and early adoption of computer vision across automotive, healthcare, defense, retail, and industrial applications.
Asia Pacific is expected to remain the fastest-growing regional market during the forecast period. China’s AI-related capital expenditure was projected to reach as much as USD 98 billion in 2025, representing growth of up to 48% compared with 2024. Government-backed organizations were expected to contribute nearly USD 56 billion of this investment.
India’s Production-Linked Incentive program has attracted more than USD 17 billion in manufacturing investment since 2020. Electronics exports also increased by 32.4% year-on-year to USD 38.5 billion. Rising public investment, electronics production, data center capacity, and local AI infrastructure are therefore expected to support faster adoption of computer vision solutions across Asia Pacific.
Key Regions and Countries
North America
- US
- Canada
Europe
- Germany
- France
- The UK
- Spain
- Italy
- Rest of Europe
Asia Pacific
- China
- Japan
- South Korea
- India
- Australia
- Rest of APAC
Latin America
- Brazil
- Mexico
- Rest of Latin America
Middle East & Africa
- GCC
- South Africa
- Rest of MEA
Market Dynamics
Drivers
| Driver | (~) % CAGR | Geographic Relevance | Impact Timeline |
|---|---|---|---|
| Edge inference chip adoption in industrial cameras | +3.2% | North America, East Asia | Short term (2 years or less) |
| Retail loss-prevention vision deployment scaling | +2.1% | North America, Western Europe | Short term (2 years or less) |
| Automotive ADAS mandate-driven camera integration | +2.8% | Europe, East Asia | Medium term (2 to 4 years) |
| Manufacturing quality-inspection automation uptake | +1.9% | East Asia, Europe | Short term (2 years or less) |
| Healthcare diagnostic imaging AI reimbursement approvals | +1.4% | North America | Medium term (2 to 4 years) |
| Smart-city surveillance infrastructure rollouts | +1.2% | Middle East, South Asia | Medium term (2 to 4 years) |
Edge inference chip adoption in industrial cameras
The growth of this driver is supported by the increasing availability of purpose-built, low-power inference chips. These processors have reduced on-device processing costs and allowed vision workloads to shift from centralized cloud systems to embedded modules within industrial cameras and sensors. NVIDIA and semiconductor supplier disclosures for 2024 to 2025 indicated double-digit growth in edge-AI accelerator shipments to industrial customers, supported by improved production yields and early design corrections. U.S. Census Bureau trade data also showed rising exports of vision-processing chips through 2025.
This transition is estimated to reduce per-unit inference costs by 15% to 20% as vendors move from cloud subscription models to integrated hardware-and-software solutions. Pre-integrated vision systems have also shortened sales cycles and lowered customer acquisition costs for hardware manufacturers. These factors are estimated to contribute an additional +3.2% to market CAGR, with North America and East Asia expected to capture most near-term deployments due to their high concentration of manufacturing automation assets through 2025.
Restraints
| Restraint | (~) % CAGR | Geographic Relevance | Impact Timeline |
|---|---|---|---|
| EU AI Act biometric-use prohibition | -2.6% | European Union | Short term (2 years or less) |
| Advanced AI accelerator supply shortage | -2.2% | Global, concentrated East Asia | Short term (2 years or less) |
| High interest-rate CapEx freeze on camera fleets | -1.5% | North America, Europe | Short term (2 years or less) |
| Export-control restrictions on high-end vision chips | -1.1% | China, East Asia | Short term (2 years or less) |
| Data-privacy litigation halting deployments | -0.9% | North America | Short term (2 years or less) |
EU AI Act biometric-use prohibition
The European Union’s restrictions on real-time remote biometric identification and social-scoring applications took effect on February 2, 2025, under Regulation 2024/1689. These rules have limited facial-recognition and behavioural-monitoring projects in public spaces, leading to delayed contracts and weaker demand across municipal, retail, and security applications. Compliance and conformity-assessment requirements are estimated to increase project deployment costs by around 10% to 18%.
Additional high-risk AI obligations are expected to phase in through December 2027, extending uncertainty for vendors and system integrators. Many companies are therefore redirecting investment toward lower-risk applications such as industrial inspection and automated quality control. Legal reviews, certification, and system redesign costs could reduce near-term regional operating margins by approximately 3 to 5 percentage points, while also delaying capital expenditure on biometric-enabled hardware.
Challenges
| Challenge | (~) % CAGR | Geographic Relevance | Mitigation Horizon |
|---|---|---|---|
| Computer vision talent deficit | -1.8% | Global, acute in North America | Medium term (2 to 4 years) |
| Model bias and validation drag | -1.3% | Global | Long term (4 years or more) |
| Fragmented industry data-labeling standards | -1.0% | Global | Medium term (2 to 4 years) |
| Legacy camera-fleet integration friction | -0.8% | Europe, North America | Medium term (2 to 4 years) |
| Power and thermal constraints at edge | -0.6% | Global | Long term (4 years or more) |
Computer vision talent deficit
The structural vulnerability stems from a persistent shortfall of engineers skilled in model optimization, sensor fusion, and MLOps for embedded vision, with labor-market data referenced in recent OECD digital skills assessments and U.S. Bureau of Labor Statistics occupational projections indicating a shortfall exceeding 1 million specialized AI-adjacent roles globally through 2026.
The quantitative friction manifests as extended hiring cycles averaging 4 to 6 months for senior computer-vision engineers and salary inflation of roughly 12% to 20% year-over-year in competitive hubs, per compensation benchmarking disclosed in technology-sector employer surveys, which raises effective R&D cost-per-model-iteration and slows feature-release cadence for mid-sized integrators.
Long-term corporate adjustments required include reliance on managed-service outsourcing, expanded university-industry apprenticeship pipelines tracked by national workforce agencies, and greater investment in low-code annotation tooling to offset the shortage, all of which require sustained multi-year budget commitments rather than one-time fixes, consistent with skills-gap trend lines published in World Economic Forum future-of-jobs analyses.
Opportunities
| Opportunity | (~) % CAGR | Geographic Relevance | Execution Window |
|---|---|---|---|
| Agricultural crop-monitoring vision white space | +2.4% | South Asia, Latin America, Sub-Saharan Africa | Medium term (2 to 4 years) |
| Outcome-based vision-as-a-service monetization | +2.0% | Global | Medium term (2 to 4 years) |
| Non-biometric compliant surveillance retrofit | +1.6% | European Union | Medium term (2 to 4 years) |
| Roll-up consolidation of niche vision startups | +1.3% | North America, Europe | Long term (4 years or more) |
| Underpenetrated SME manufacturing inspection adoption | +1.1% | Southeast Asia, Eastern Europe | Long term (4 years or more) |
Agricultural crop-monitoring vision white space
AI-based computer vision in agriculture remains an untapped opportunity because adoption is still concentrated among large agribusinesses and pilot projects. Through 2025, most smallholder and mid-sized farms across South Asia, Latin America, and Sub-Saharan Africa continued to lack vision-based crop and livestock monitoring systems, mainly due to weak connectivity and high equipment costs.
Future demand could rise as affordable drone-and-camera packages and seasonal subscription models become available. Vendors that localize hardware, support offline AI processing, and build regional distribution networks could improve margins by an estimated 8 to 12 percentage points. Partnerships with agricultural cooperatives, extension agencies, and local financial-service providers will be important for reaching underserved farming communities.
Key Players Analysis
The competitive landscape of the AI in computer vision market is led by NVIDIA, Microsoft, and Amazon, supported by their large investments in AI computing, cloud infrastructure, and advanced processors. NVIDIA generated USD 130.5 billion in FY2025 revenue, increasing 114% year-on-year. Its Data Center revenue reached USD 115.2 billion, rising 142%, mainly due to strong demand for Hopper and Blackwell GPUs used in computer vision model training. NVIDIA also invested USD 12.9 billion in research and development during FY2025.
Amazon Web Services generated USD 107.6 billion in revenue in 2024, representing 19% annual growth, while operating income reached USD 39.8 billion. Amazon’s total capital expenditure stood at USD 83.0 billion, supporting data centers, GPU clusters, and custom chips used for AI inference. Microsoft’s Intelligent Cloud revenue increased by USD 18.8 billion, or 21%, in FY2025, while Azure revenue expanded by 34%.
Alphabet and Qualcomm also maintain strong competitive positions. Google Cloud generated USD 43.2 billion in revenue in 2024, increasing 31%, while Alphabet invested USD 49.3 billion in R&D, equal to 14% of revenue. Qualcomm’s QCT segment recorded USD 33.2 billion in FY2024 revenue, including USD 2.9 billion from automotive applications. Intel’s Data Center and AI segment generated USD 16.1 billion, while IBM’s Software segment reached USD 27.1 billion, highlighting their focus on AI infrastructure and enterprise software.
Top Key Players in the Market
- NVIDIA Corporation
- Microsoft
- Intel Corporation
- IBM Corporation
- Qualcomm Technologies Inc.
- AWS
Recent Developments
- In September 2025, NVIDIA and Intel announced a strategic collaboration to develop multiple generations of AI data-centre and personal-computing products. NVIDIA agreed to invest USD 5.0 billion by purchasing 214.8 million Intel shares at USD 23.28 per share. Intel will develop custom x86 processors connected to NVIDIA platforms through NVLink, supporting high-performance AI and computer vision workloads.
- In September 2025, NVIDIA and OpenAI signed a letter of intent to deploy at least 10 gigawatts of NVIDIA-powered AI infrastructure. NVIDIA intends to invest up to USD 100 billion as each gigawatt becomes operational. The first 1-gigawatt phase is scheduled for the second half of 2026 using the NVIDIA Vera Rubin platform.
- In April 2025, Qualcomm acquired MovianAI, the former generative AI division of VinAI, to strengthen its computer vision, machine learning, and natural language processing capabilities. The deal built on Qualcomm’s more than 20 years of engagement with Vietnam’s technology sector. In the quarter ended March 30, 2025, Qualcomm invested USD 2.22 billion in research and development, equal to 20% of its revenue, supporting advanced on-device AI solutions for smartphones, PCs, and software-defined vehicles. The acquisition value was not disclosed.
Report Scope
| Report Features | Description |
|---|---|
| Market Value (2025) | USD 24.7 Billion |
| Forecast Revenue (2035) | USD 280.5 Billion |
| CAGR (2026-2035) | 27.5% |
| Base Year for Estimation | 2025 |
| Historic Period | 2020-2024 |
| Forecast Period | 2026-2035 |
| Report Coverage | Revenue Forecast, Market Dynamics, Competitive Landscape, Recent Developments |
| Segments Covered | By Component (Hardware, Software); By Function (Training, Interference); By Application (Industrial, Non-Industrial); By End-User (Automotive, Consumer Electronics, Healthcare, Retail, Transportation and Logistics, Others) |
| Regional Analysis | North America – US, Canada; Europe – Germany, France, The UK, Spain, Italy, Rest of Europe; Asia Pacific – China, Japan, South Korea, India, Australia, Singapore, Rest of APAC; Latin America – Brazil, Mexico, Rest of Latin America; Middle East & Africa – GCC, South Africa, Rest of MEA |
| Competitive Landscape | NVIDIA Corporation, Microsoft, Intel Corporation, IBM Corporation, Qualcomm Technologies Inc., AWS, Google |
| Customization Scope | Customization for segments, region/country-level will be provided. Additional customization can be done based on requirements. |
| Purchase Options | We have three licenses to opt for: Single User License, Multi-User License (Up to 5 Users), Corporate Use License (Unlimited Users and Printable PDF) |





























