


Report Overview
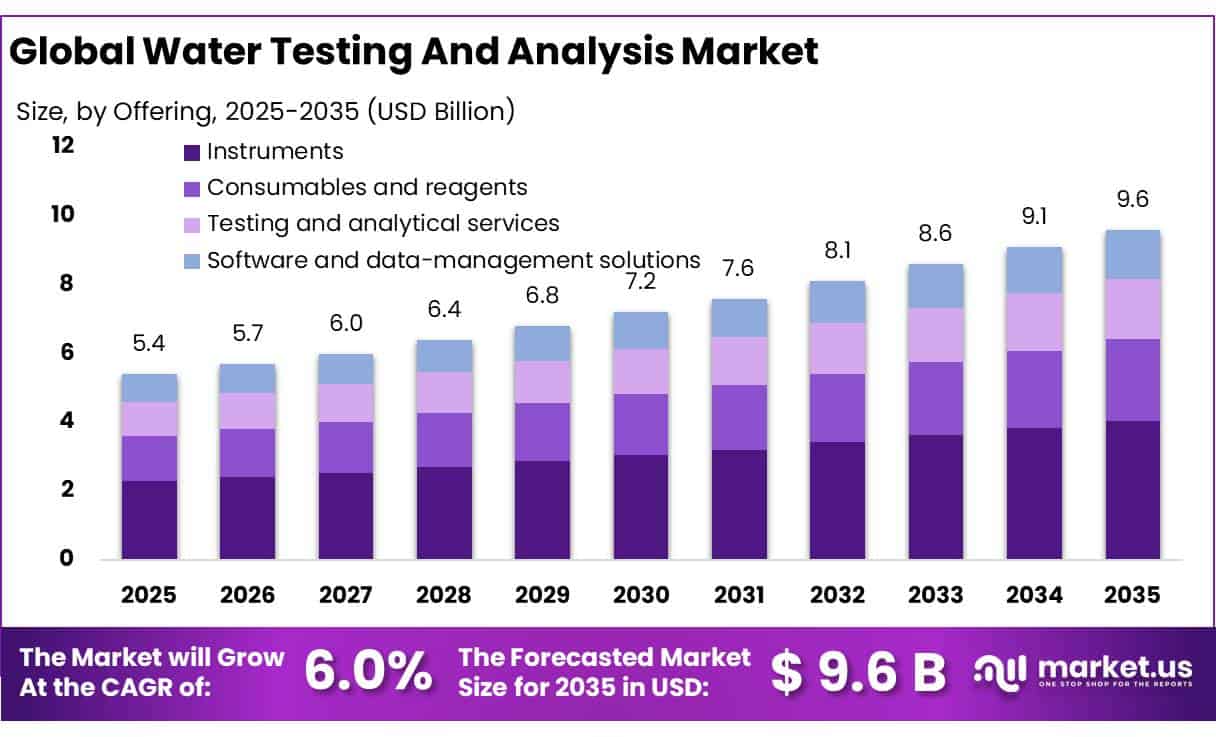
The Global Water Testing And Analysis Market size is expected to be worth around USD 9.6 Billion by 2035, from USD 5.4 Billion in 2025, growing at a CAGR of 6.0% during the forecast period from 2026 to 2035. In 2025, North America held a dominant market position, capturing more than a 35.00% share, holding USD 1.9 Billion revenue.
Water testing and analysis is an essential part of water quality management, public health protection, environmental monitoring, and industrial operations. The industry involves the collection, testing, and evaluation of water samples to identify physical, chemical, and microbiological contaminants. Common parameters include pH, turbidity, dissolved oxygen, hardness, heavy metals, pesticides, bacteria, and industrial chemicals. Testing is conducted across drinking water supplies, wastewater treatment plants, rivers, lakes, groundwater, swimming pools, and industrial process water.
- According to the World Health Organization (WHO) and UNICEF Joint Monitoring Programme, 2.2 billion people lacked safely managed drinking water services in 2022, representing approximately 27% of the global population. This gap highlights the need for regular water quality testing, improved sanitation infrastructure, and stronger monitoring systems. Water testing also supports the early detection of contamination and helps authorities and utility operators take corrective action before water quality problems become more serious.
Industrial demand is further supported by stricter environmental regulations and the need to monitor contaminants from manufacturing, chemical processing, mining, agriculture, and municipal wastewater. The United States Environmental Protection Agency (EPA) sets legal limits for more than 90 drinking water contaminants and establishes testing schedules and analytical methods for regulated substances. These requirements create recurring demand for laboratory testing, compliance services, and reliable measurement equipment. The EPA also provides approved analytical procedures for inorganic contaminants, organic chemicals, radionuclides, and microbiological indicators.
Technological developments are changing the way water samples are tested and monitored. Laboratories increasingly use chromatography, mass spectrometry, spectroscopy, biosensors, and automated testing instruments to detect contaminants at low concentrations. Emerging concerns about per- and polyfluoroalkyl substances (PFAS), heavy metals, pharmaceutical residues, and microbial contamination are increasing the importance of accurate analytical methods. For example, the EPA has developed testing methods that enable laboratories to measure 29 PFAS compounds in drinking water using Methods 533 and 537.1. This demonstrates the growing need for specialized chemical analysis and validated testing procedures.
Future growth opportunities are expected in rapid testing kits, portable water analyzers, real-time monitoring systems, advanced laboratory services, and wastewater reuse testing. Industrial facilities can use regular testing to improve treatment efficiency, identify contamination early, and reduce the risk of regulatory violations. Municipal utilities can benefit from digital monitoring systems that support faster reporting and more consistent quality control. The WHO Guidelines for Drinking-water Quality also promote risk-based water safety plans, health-based targets, and independent surveillance, reinforcing the need for systematic testing throughout water supply networks.
Key Takeaways
- Water Testing And Analysis Market size is expected to be worth around USD 9.6 Billion by 2035, from USD 5.4 Billion in 2025, growing at a CAGR of 6.0%.
- Instruments held a dominant market position, capturing more than a 42.00% share.
- Chemical testing held a dominant market position, capturing more than a 37.00% share.
- Electrochemical sensors held a dominant market position, capturing more than a 26.00% share.
- Drinking-water testing held a dominant market position, capturing more than a 30.00% share.
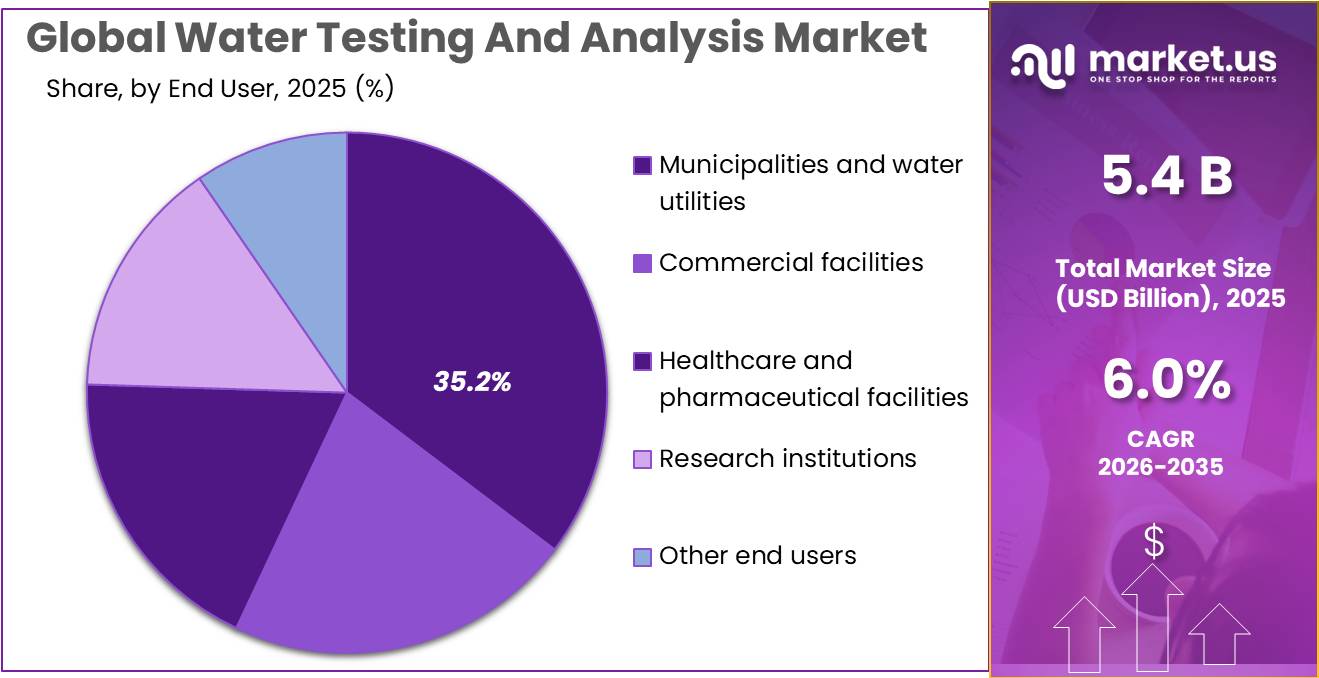
- Municipalities and water utilities held a dominant market position, capturing more than a 35.00% share.
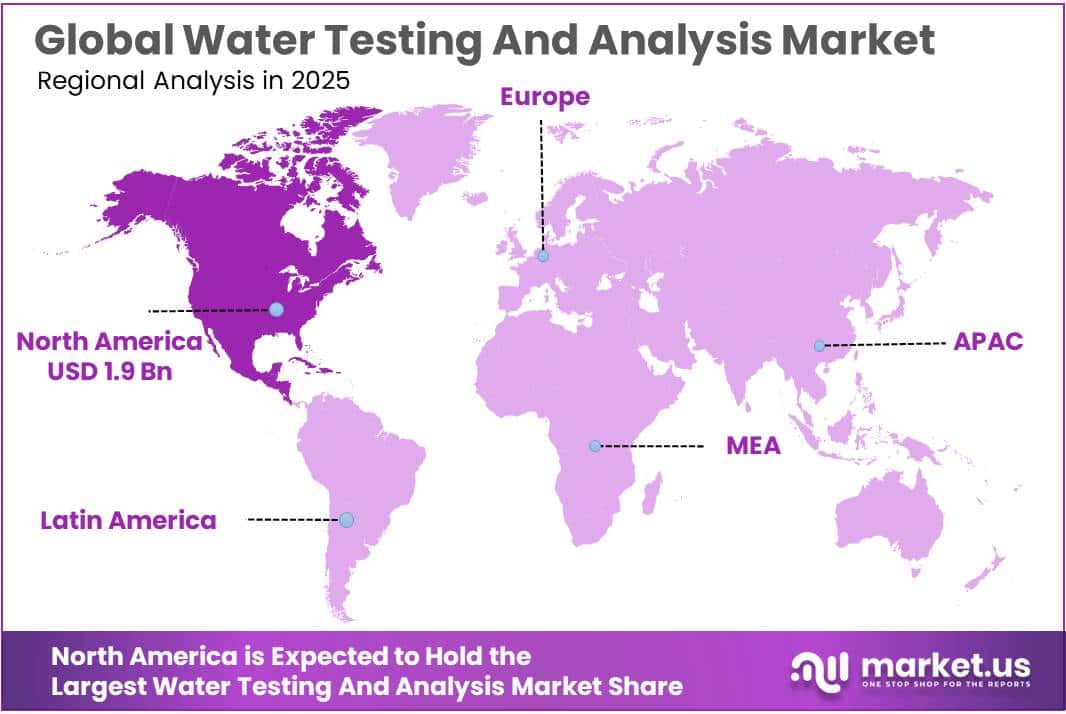
- North America held a dominant position in the Water Testing and Analysis Market in 2025, accounting for 35.00% of the market, valued at USD 1.9 billion.
By Offering Analysis
Instruments lead the market through accurate measurement, reliable detection, and efficient water quality monitoring.
In 2025, “Instruments” held a dominant market position, capturing more than a 42.00% share. Instruments play an important role in water testing and analysis by helping laboratories, water utilities, and industrial facilities identify chemical, physical, and microbiological contaminants. Equipment such as spectrometers, chromatographs, pH meters, and turbidity meters supports routine testing and regulatory compliance. Demand is also supported by the need for accurate results, consistent monitoring, and early detection of harmful substances.
Consumables and reagents are essential for preparing samples, detecting contaminants, and completing routine water quality assessments. These products include chemical reagents, test strips, calibration solutions, sample containers, filters, and microbiological testing materials. Their recurring use in laboratories, municipal water facilities, and industrial testing operations supports continued demand. In 2026, the United States Environmental Protection Agency reported that its drinking water regulations cover more than 90 contaminants, with requirements for monitoring schedules and analytical methods.
By Test Type Analysis
Chemical testing leads through its role in detecting contaminants and ensuring water quality compliance.
In 2025, “Chemical testing” held a dominant market position, capturing more than a 37.00% share. Chemical testing helps laboratories, water utilities, and industrial facilities measure substances such as heavy metals, pesticides, nitrates, and other chemical pollutants in water. It supports drinking water safety, wastewater monitoring, and industrial process control by identifying contaminants that may affect human health or the environment. In 2025, chemical testing remained important for regulatory compliance, as the United States Environmental Protection Agency maintained standards for more than 90 drinking water contaminants. These requirements support the use of reliable analytical methods for monitoring chemical water quality.
Physical testing helps laboratories, municipal water suppliers, and industrial facilities evaluate water characteristics such as turbidity, temperature, colour, and conductivity. These measurements help identify changes in water quality, assess treatment performance, and determine whether additional testing is required. In 2025, physical testing remained an important part of water monitoring, particularly for drinking water treatment and wastewater management. The United States Environmental Protection Agency identifies approved methods for measuring parameters such as turbidity, pH, and conductivity, supporting standardized water quality assessment. Its guidance also includes turbidity monitoring at intervals as frequent as every 4 hours in specified treatment testing procedures, highlighting the importance of regular physical measurements.
By Technology Analysis
Electrochemical sensors lead through fast measurements, reliable detection, and practical on-site water quality monitoring.
In 2025, “Electrochemical sensors” held a dominant market position, capturing more than a 26.00% share. These sensors help measure water quality by detecting chemical properties and substances through electrical signals. They are widely suited to monitoring pH, dissolved oxygen, conductivity, and selected ionic contaminants in drinking water, wastewater, and industrial processes. Their compact design and ability to provide rapid readings make them useful for field testing and continuous monitoring. The United States Geological Survey (USGS) provides guidance on water quality monitoring using field instruments, including measurements of pH, specific conductance, dissolved oxygen, and temperature.
Optical sensors are used to measure turbidity, suspended particles, organic matter, nutrients, and other water quality indicators. These sensors help laboratories, water utilities, and environmental agencies monitor changes in water conditions and assess treatment performance. In 2025, optical sensing remained relevant for continuous monitoring because it can provide frequent readings without relying entirely on manual sample collection. The United States Geological Survey (USGS) has documented the use of in-situ optical sensors to continuously measure water constituents through absorbance and fluorescence, helping identify changes that traditional sampling may miss. The USGS monitoring approach includes organic carbon, nutrients, and sediment, alongside water temperature and discharge measurements.
By Application Analysis
Drinking-water testing leads through its role in protecting public health and ensuring safe water supplies.
In 2025, “Drinking-water testing” held a dominant market position, capturing more than a 30.00% share. This segment covers the testing of treated and untreated water for chemical, physical, and microbiological contaminants that may affect human health. Municipal water suppliers, laboratories, and regulatory authorities use these tests to check water quality and identify contamination risks. Demand is supported by drinking water safety requirements, routine compliance monitoring, and the need to maintain reliable public water supplies. The United States Environmental Protection Agency sets standards for more than 90 drinking water contaminants, creating an ongoing need for testing and monitoring.
Wastewater and effluent analysis is essential for monitoring water released from municipal treatment plants, factories, and industrial processing facilities. Testing helps identify pollutants such as suspended solids, organic matter, nutrients, heavy metals, and harmful microorganisms before treated wastewater is discharged into the environment. In 2025, demand for these services was supported by environmental regulations and the need to protect rivers, lakes, and other receiving water bodies. The United States Environmental Protection Agency requires facilities covered by National Pollutant Discharge Elimination System permits to follow applicable discharge limits, monitoring requirements, and reporting rules.
By End User Analysis
Municipalities and water utilities lead through regular water quality monitoring and public drinking water safety requirements.
In 2025, “Municipalities and water utilities” held a dominant market position, capturing more than a 35.00% share. These organizations require regular testing to ensure that drinking water meets quality standards and that treatment and distribution systems operate effectively. Testing programs help detect microbial contamination, chemical pollutants, changes in pH, and other water quality issues. Municipal authorities also use analytical services to monitor wastewater treatment and support environmental compliance. The United States Environmental Protection Agency regulates public water systems serving approximately 90% of the US population, creating a substantial need for routine water quality monitoring and laboratory analysis.
Wastewater and commercial facilities require regular water testing to maintain safe operations and meet environmental requirements. Wastewater treatment plants test effluent before discharge, while commercial facilities such as hotels, hospitals, laboratories, offices, and restaurants monitor water used for daily operations, cooling systems, and sanitation. In 2025, demand was supported by the need to identify pollutants, improve treatment performance, and reduce risks associated with contaminated water. According to the United States Environmental Protection Agency (EPA), the commercial and institutional sector accounts for 17% of withdrawals from publicly supplied water in the United States, highlighting its substantial water use and need for effective water management.
Key Market Segments
By Offering
- Instruments
- Consumables and reagents
- Testing and analytical services
- Software and data-management solutions
By Test Type
- Physical testing
- Chemical testing
- Microbiological testing
- Toxicity testing
- Radiological testing
- Emerging contaminants and organic-compound testing
By Technology
- Electrochemical sensors
- Optical sensors
- Chromatography
- Spectroscopy
- Immunoassay-based analysis
- Other technologies
By Application
- Drinking-water testing
- Wastewater and effluent analysis
- Industrial-water monitoring
- Environmental-water testing
- Medical and pharmaceutical-water testing
- Other applications
By End User
- Municipalities and water utilities
- Commercial facilities
- Healthcare and pharmaceutical facilities
- Research institutions
- Other end users
Driver Analysis
PFAS compliance testing
U.S. PFAS regulation creates a near-term analytical workload that is more resilient than the associated treatment-equipment procurement cycle: the 2024 drinking-water rule requires initial monitoring by 2027, while the enforceable limits for PFOA and PFOS remain 4.0 parts per trillion each. EPA’s May 18, 2026 proposal would allow eligible systems to request an extension of treatment compliance from 2029 to 2031, but its implementation framework expressly preserves monitoring and reporting schedules; the EPA page updated October 8, 2026 still describes this extension as proposed, rather than finalized.
The agency is also proposing rescission of requirements for several other PFAS, making a PFOA/PFOS-led demand case more defensible than assuming an unchanged six-PFAS regulatory package. Commercially, the opportunity extends beyond instrument placements into repeat analytical services, sample preparation, standards, contamination-control consumables, quality assurance, and customer reporting.
The strategic distinction is between a temporary initial-monitoring surge and recurring compliance work: laboratories should size capacity against both, rather than extrapolate the 2027 deadline into permanently elevated sample growth. The +1.1 pp scenario contribution assumes 10% global revenue exposure and an 11-percentage-point annual growth premium within that allocated pool; the relatively high premium reflects the approaching monitoring deadline, while the limited exposure recognizes that U.S. PFAS testing is only one component of the global market.
Drivers Impact Analysis
| Driver | (~) % Impact on CAGR | Geographic Relevance | Impact Timeline |
|---|---|---|---|
| PFAS compliance testing | +1.1 pp | North America: U.S. core | Short term (≤ 2 years) |
| EU wastewater monitoring expansion | +0.8 pp | EU-27 | Medium term (2-4 years) |
| Lead sampling intensification | +0.6 pp | North America: U.S. core | Short term (≤ 2 years) |
| India’s decentralized testing network | +0.6 pp | APAC: India core | Short term (≤ 2 years) |
| Industrial and municipal water reuse | +0.9 pp | APAC, Middle East, North America, Southern Europe | Medium term (2-4 years) |
Restraint Analysis
Utility funding constraints
The principal financial restraint is the gap between water-quality obligations and customers’ ability to fund equipment replacement, recurring consumables, and analytical contracts. WHO’s GLAAS 2025 findings, released in January 2026, identify a 46% funding gap across 20 countries supplying comparable needs-and-financing data; fewer than 20% of participating countries reported sufficient funding to achieve national WASH targets, while government WASH budgets across 27 countries increased by approximately 2.6% annually during 2021–2024 but remained stagnant after inflation.
Procurement execution compounds the shortage: about half of reporting countries used less than 75% of domestic capital commitments, and fewer than one-third reported that tariffs and household contributions covered at least 80% of operating and maintenance costs. These are wider water, sanitation, and hygiene indicators—not testing-market expenditure estimates—but they establish the financial conditions affecting public-sector testing customers. Even in the U.S., EPA’s latest comprehensive Clean Watersheds Needs Survey identifies US$630.1 billion of requirements over 20 years, including US$151.1 billion for conveyance and US$115.3 billion for stormwater, illustrating the competing infrastructure demands facing utility budgets rather than an addressable analytical-equipment market.
The commercial consequence is delayed analyzer replacement and network expansion, substitution of outsourced testing for instrument ownership, and pressure on suppliers to offer financing or longer payment terms; outsourcing can preserve laboratory revenue, but it does not fully offset deferred capital purchases or reduced discretionary testing. The −0.8 pp scenario assumes 20% revenue exposure to financially constrained customers and a 4-percentage-point growth shortfall within that pool, making funding the largest modeled restraint without treating infrastructure investment needs as lost testing sales.
Restraint Impact Analysis
| Restraint | (~) % Impact on CAGR | Geographic Relevance | Impact Timeline |
|---|---|---|---|
| Utility funding constraints | −0.8 pp | U.S.; South Asia; Sub-Saharan Africa | Medium term (2-4 years) |
| PFAS policy uncertainty | −0.4 pp | U.S. federal market | Short term (≤ 2 years) |
| Trace-analysis cost burden | −0.5 pp | U.S.; EU; advanced APAC labs | Medium term (2-4 years) |
| Sample-logistics bottlenecks | −0.3 pp | Rural India; ASEAN; Africa; Latin America | Short term (≤ 2 years) |
| Weak surveillance execution | −0.6 pp | South Asia; Sub-Saharan Africa; Southeast Asia | Long term (≥ 4 years) |
Opportunity Analysis
Small-system subscriptions
The strategic white space is to convert fragmented, intermittently served water systems into recurring analytical-service customers through pooled procurement, standardized sampling kits, scheduled collection, and digital compliance records—not merely to relabel existing laboratory invoices as subscriptions. EPA reports that more than 97% of approximately 156,000 U.S. public water systems serve 10,000 or fewer people; these include community and non-community systems and therefore cannot all be assigned the same service package or annual contract value.
A practical initial serviceable obtainable market could comprise 300 qualified systems within a geographically concentrated territory: at an assumed US$12,000 annual subscription, that represents US$3.6 million in annual contract revenue, but only the share attributable to previously unpurchased testing, additional parameters, or genuinely incremental software constitutes market expansion.
At an illustrative 40% gross-margin target, direct fulfillment costs must remain within US$7,200 per customer annually, requiring parameter-specific sample schedules, dense collection routes, and explicit exclusions for extraordinary investigations; these are commercial design assumptions, not observed industry averages. Acquisition of small laboratories could accelerate route density and customer access, but ownership consolidation alone adds no market revenue.
The opportunity differs from the existing compliance driver because suppliers must create an affordable delivery model that activates underserved demand; successful execution depends on customer-level purchasing validation, service-cost discipline, and contract renewal rather than the mere existence of small systems. The +0.6 pp sensitivity assumes 10% exposed revenue and a 6-percentage-point growth premium from additional customer penetration, excluding simple migration of existing purchases into recurring billing.
Opportunity Impact Analysis
| Opportunity | (~) % Potential CAGR | Geographic Relevance | Execution Window |
|---|---|---|---|
| Small-system subscriptions | +0.6 pp | U.S.; Canada; rural India | Short term (≤ 2 years) |
| Data-center assurance | +0.5 pp | U.S.; EU; Singapore; India | Short term (≤ 2 years) |
| Private-site biosurveillance | +0.4 pp | U.S.; EU; Japan; Singapore | Medium term (2-4 years) |
| PFAS destruction verification | +0.4 pp | U.S.; EU; Australia | Medium term (2-4 years) |
| Reuse quality-assurance contracts | +0.3 pp | U.S.; Southern EU; GCC; India | Medium term (2-4 years) |
Challenges Analysis
Cross-Matrix Method Transfer
Scaling analytical services across wastewater, groundwater, leachate, biosolids, and other matrices requires laboratories to reproduce performance under materially different interference conditions, even when the target compounds and instrument platform remain unchanged. EPA’s December 2024 Method 1633A covers 40 PFAS across aqueous, solid, biosolids, and tissue samples, with formal performance criteria developed from multi-laboratory validation; the method requires matrix-specific initial performance demonstrations, so purchasing equipment or transferring a standard operating procedure does not by itself establish equivalent capability at another site.
The operational friction is recurring method-transfer work: extraction recovery, matrix effects, contamination, instrument maintenance, and data review must remain controlled as the customer mix changes. In an illustrative laboratory model, 1,000 monthly customer samples with an 8% repeat-analysis rate require 1,080 sample-analysis events, compared with 1,030 at a 3% rate; improving first-pass execution therefore releases 50 events monthly, approximately 4.6% of the higher workload, without adding an instrument. These are operating assumptions, not reported industry failure rates, and repeat analysis does not necessarily require repeating every preparation step.
The corporate response is matrix-specific competency qualification, controlled method versions, shared reference datasets, and inter-site proficiency comparisons rather than indiscriminate capacity duplication. This is a challenge rather than a sales barrier because laboratories continue accepting work, but inconsistent transfer consumes saleable capacity and slows reliable geographic expansion; repeat work may increase consumable purchases while simultaneously damaging laboratory economics. The −0.5 pp sensitivity assumes 10% exposed revenue and a 5-percentage-point growth shortfall from slower capacity ramp-up and customer qualification, excluding the general affordability burden already treated as a restraint.
Challenges Impact Analysis
| Challenge | (~) % CAGR Friction | Geographic Relevance | Mitigation Horizon |
|---|---|---|---|
| Cross-Matrix Method Transfer | −0.5 pp | U.S.; EU; Japan; Australia | Medium term (2-4 years) |
| Sensor Fouling and Drift | −0.4 pp | North America; EU; India; ASEAN | Medium term (2-4 years) |
| Connected Data Integrity | −0.3 pp | U.S.; EU; GCC; Singapore | Medium term (2-4 years) |
| Microplastics Measurement Harmonization | −0.3 pp | EU core; U.S.; Japan | Long term (≥ 4 years) |
| Specialist Knowledge Continuity | −0.4 pp | U.S.; EU; India analytical hubs | Long term (≥ 4 years) |
Geopolitical Impact Analysis
Geopolitical Impact of Ongoing Wars on the Water Testing and Analysis Market
Ongoing conflicts in Ukraine and the Middle East are increasing the need for reliable water testing and analysis as attacks damage water supply networks, wastewater plants, and desalination facilities. Damaged infrastructure can release untreated sewage, fuel residues, heavy metals, and other harmful substances into water sources, increasing demand for chemical, microbiological, and emergency water quality testing.
- In October 2026, a review published by the International Water Association highlighted how conflict-related contaminants and laboratory disruptions in Ukraine are creating gaps in water monitoring. It identified mobile laboratories, portable test kits, and remote sensors as useful solutions.
The financial impact is also significant. A joint World Bank, European Union, and United Nations assessment estimated US$7.8 billion in damage to Ukraine’s water supply and sanitation sector, with additional costs arising from energy disruptions and higher operating expenses.
These conditions create opportunities for testing laboratories, instrument suppliers, and emergency monitoring providers. However, damaged facilities, unsafe access, disrupted supply chains, and higher operating costs can delay testing and equipment delivery. Overall, geopolitical instability is increasing the need for rapid, portable, and dependable water testing solutions.
Regional Insights
Dominating Region: North America
North America held a dominant position in the Water Testing and Analysis Market in 2025, accounting for 35.00% of the market, valued at USD 1.9 billion. The region benefits from established water infrastructure, strict environmental regulations, advanced laboratory capabilities, and consistent monitoring by municipal utilities and industrial facilities. The United States Environmental Protection Agency sets legal limits for more than 90 drinking water contaminants and establishes testing schedules and methods, supporting continued demand for analytical instruments, reagents, and laboratory services. In addition, the US Geological Survey operates more than 13,500 real-time monitoring locations covering streams, lakes, reservoirs, groundwater, and water quality.
Asia-Pacific is a strong candidate for the fastest-growing regional market, supported by urbanization, industrial expansion, water pollution concerns, and investment in municipal water and wastewater infrastructure. Growing manufacturing activity increases the need to test industrial effluent for chemical pollutants before discharge, while expanding urban populations place greater pressure on drinking water treatment and distribution networks. Governments and utilities are increasingly adopting automated monitoring systems, portable testing equipment, and advanced laboratory methods to improve water quality oversight.
Key Regions and Countries Insights
- North America
- US
- Canada
- Europe
- Germany
- France
- The UK
- Spain
- Italy
- Rest of Europe
- Asia Pacific
- China
- Japan
- South Korea
- India
- Australia
- Rest of APAC
- Latin America
- Brazil
- Mexico
- Rest of Latin America
- Middle East & Africa
- GCC
- South Africa
- Rest of MEA
Key Players Analysis
SGS S.A. is a global testing, inspection, and certification company that supports water quality assessment, environmental monitoring, and industrial compliance. Its laboratory services help customers identify chemical pollutants and assess water safety. In 2025, SGS reported a network of more than 770 laboratories and business facilities and over 35,428 professionals, supporting its international testing capabilities. Its broad laboratory network and technical expertise position the company to serve municipal utilities, industrial customers, and environmental monitoring programs.
Eurofins Scientific SE provides laboratory testing services across environmental, food, pharmaceutical, and consumer product sectors. Its environmental testing activities include water quality analysis, pollutant detection, and monitoring of emerging contaminants. In 2025, Eurofins reported total revenue of €7.296 billion, representing 5.0% growth compared with 2024. Its environmental testing business in North America also recorded mid-single-digit organic growth during the year, supported partly by demand for per- and polyfluoroalkyl substances (PFAS) testing.
Intertek Group plc provides testing, inspection, and certification services, including environmental analysis and water testing. In September 2025, the company acquired Envirolab, an environmental testing provider, for £122.7 million. Envirolab had more than 200 professionals across 5 laboratories in Australia and New Zealand, with capabilities covering water, soil, air, and emerging contaminants. The acquisition strengthened Intertek’s environmental testing presence in the Asia-Pacific region and expanded its ability to support customers with water quality analysis and environmental compliance.
Top Key Players Outlook
- SGS S.A.
- Eurofins Scientific SE
- Intertek Group plc
- Bureau Veritas S.A.
- ALS Limited
- TÜV SÜD AG
- Pace Analytical Services, LLC
- Element Materials Technology
- Thermo Fisher Scientific Inc.
- Veralto Corporation
- Xylem Inc.
- Agilent Technologies, Inc.
- Shimadzu Corporation
- HORIBA, Ltd.
- PerkinElmer Inc
Recent Developments
- In February 2026, Bureau Veritas S.A it reported 9 acquisitions completed in 2025, adding €96 million in annualized revenue, and announced a further €200 million share buyback.
- In December 2025, Pace acquired QuanTEM Laboratories in Oklahoma City, marking its fourth Building Sciences acquisition of 2025 and expanding its environmental and microbiology testing capabilities. In January 2026, Pace announced that it had received an Environmental Business Journal award recognizing its 4 acquisitions during 2025.
Report Scope
| Report Features | Description |
|---|---|
| Market Value (2025) | USD 5.4 Bn |
| Forecast Revenue (2035) | USD 9.6 Bn |
| CAGR (2026-2035) | 6.0% |
| Base Year for Estimation | 2025 |
| Historic Period | 2020-2024 |
| Forecast Period | 2026-2035 |
| Report Coverage | Revenue Forecast, Market Dynamics, Competitive Landscape, Recent Developments |
| Segments Covered | By Offering (Instruments, Consumables and reagents, Testing and analytical services, Software and data-management solutions), By Test Type (Physical testing, Chemical testing, Microbiological testing, Toxicity testing, Radiological testing, Emerging contaminants and organic-compound testing), By Technology (Electrochemical sensors, Optical sensors, Chromatography, Spectroscopy, Immunoassay-based analysis, Other technologies), By Application (Drinking-water testing, Wastewater and effluent analysis, Industrial-water monitoring, Environmental-water testing, Medical and pharmaceutical-water testing, Other applications), By End User (Municipalities and water utilities, Commercial facilities, Healthcare and pharmaceutical facilities, Research institutions, Other end users) |
| Regional Analysis | North America – US, Canada; Europe – Germany, France, The UK, Spain, Italy, Rest of Europe; Asia Pacific – China, Japan, South Korea, India, Australia, Singapore, Rest of APAC; Latin America – Brazil, Mexico, Rest of Latin America; Middle East & Africa – GCC, South Africa, Rest of MEA |
| Competitive Landscape | SGS S.A., Eurofins Scientific SE, Intertek Group plc, Bureau Veritas S.A., ALS Limited, TÜV SÜD AG, Pace Analytical Services, LLC, Element Materials Technology, Thermo Fisher Scientific Inc., Veralto Corporation, Xylem Inc., Agilent Technologies, Inc., Shimadzu Corporation, HORIBA, Ltd., PerkinElmer Inc |
| Customization Scope | Customization for segments, region/country-level will be provided. Moreover, additional customization can be done based on the requirements. |
| Purchase Options | We have three licenses to opt for: Single User License, Multi-User License (Up to 5 Users), Corporate Use License (Unlimited User and Printable PDF) |








