


Report Overview
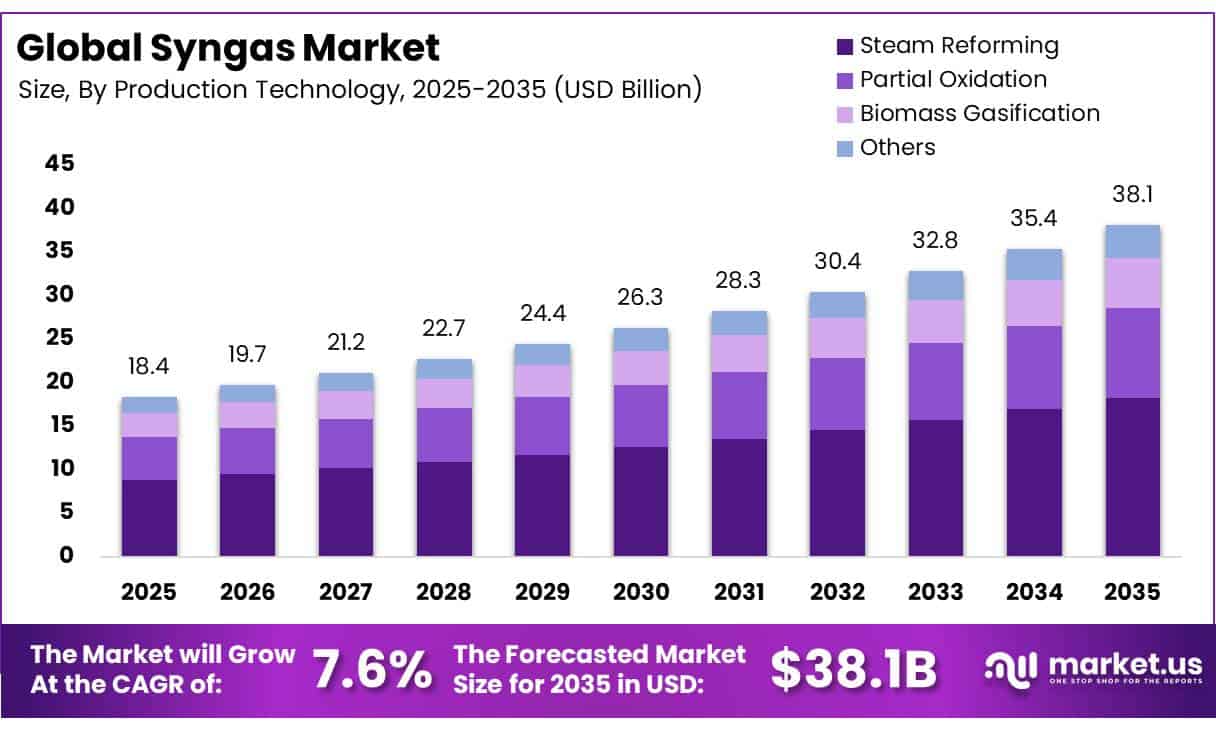
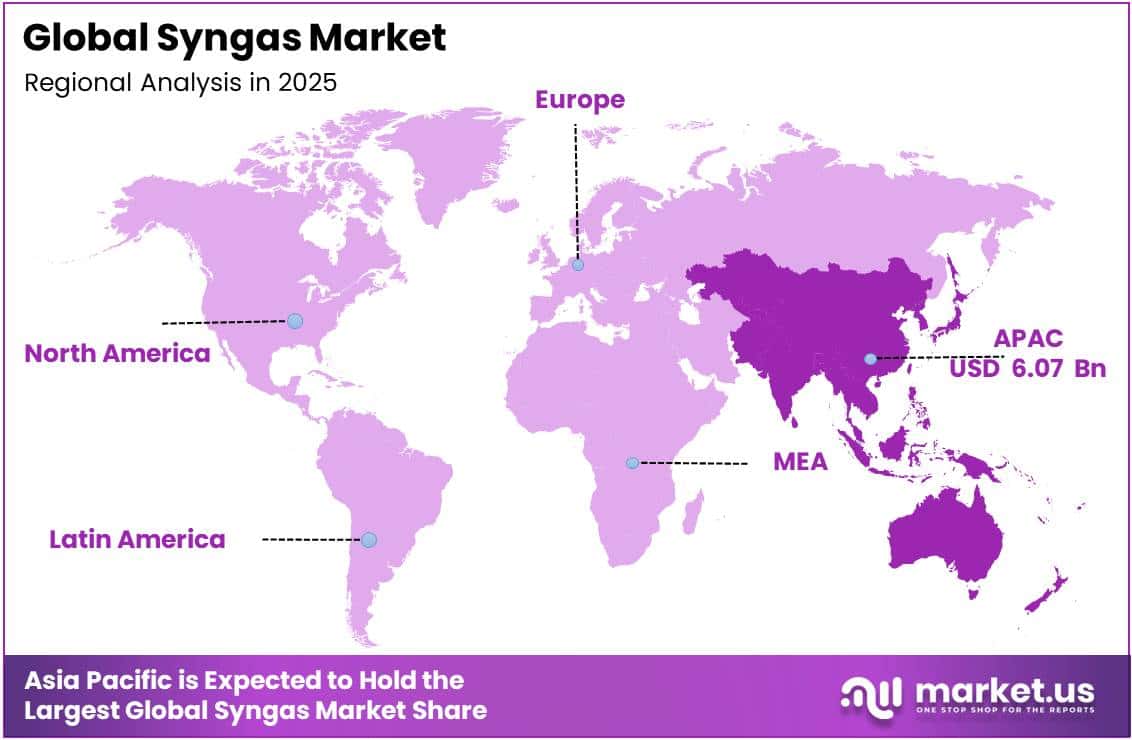
In 2025, the Global Syngas Market was valued at USD 18.4 billion, and between 2026 and 2035, this market is estimated to register a CAGR of 7.6%, reaching about USD 38.1 billion by 2035. Asia Pacific held a dominant market position, capturing more than a 33.00% share, holding USD 6.07 billion in revenue.
Synthesis gas, commonly referred to as syngas, is a versatile mixture of hydrogen and carbon monoxide produced primarily through gasification, steam reforming, and partial oxidation of feedstocks including natural gas, coal, biomass, and waste streams. Serving as a critical intermediate in the production of hydrogen, ammonia, methanol, and synthetic fuels, syngas sits at the intersection of the chemical, energy, and industrial sectors.
- According to the International Energy Agency (IEA), global hydrogen demand reached almost 100 million tonnes (Mt) in 2024, up 2% from 2023, with demand concentrated in refining, ammonia production, and methanol manufacturing. As syngas constitutes the primary production pathway for this hydrogen, it occupies a foundational role in meeting the world’s growing industrial energy and chemical feedstock requirements.
Key Takeaways
- The global syngas market was valued at USD 18.4 Billion in 2025.
- The global market is projected to grow at a CAGR of 7.6% and is estimated to reach USD 38.1 Billion by 2035.
- On the basis of production technology, steam reforming dominated the market, constituting 48.00% of the total market share.
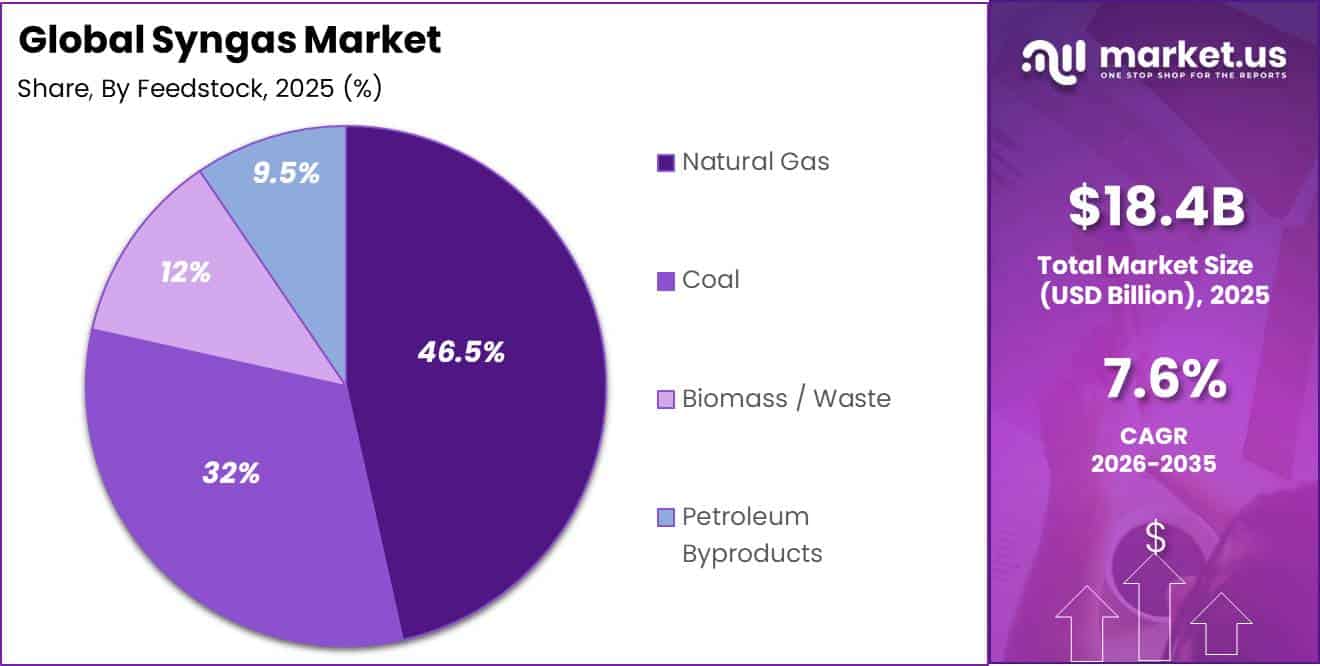
- Based on the feedstock, natural gas dominated the market, accounting for 46.50% of the total market share.
- Based on the gasifier type, fixed bed dominated the market, holding 40.00% of the total market share.
- Based on the application, chemicals dominated the market, accounting for 30.00% of the total market share.
- In 2025, Asia Pacific was the dominant region in the syngas market, accounting for 33.00% of the total global market.
The industrial scenario reflects a sector undergoing significant structural transformation. The IEA’s Global Hydrogen Review 2025 confirmed that hydrogen production reached almost 100 Mt in 2024, with the vast majority still produced from fossil fuels via syngas-based steam reforming and gasification. Low-emissions hydrogen production, which relies on syngas coupled with carbon capture, grew nearly 10% in 2024 and is projected to reach at least 4.2 million tonnes per annum (Mtpa) by 2030, representing a fivefold increase from current levels. Steam reforming, the dominant syngas production technology, continues to anchor large-scale industrial operations globally, reinforcing syngas as the backbone of near-term clean hydrogen transition strategies.
- The IEA projects that low-emissions hydrogen production from committed projects could grow from less than 1% of total hydrogen output today to approximately 4% by 2030, with syngas-based blue hydrogen serving as a transitional technology. Additionally, hydrogen demand in sectors including shipping, aviation, and chemicals is broadening, with the IEA noting that committed projects in refining, chemicals, and steel manufacturing could generate demand for 1.5 Mtpa of low-emissions hydrogen by 2030, three times current levels. These demand trajectories sustain robust upstream syngas production requirements across global industrial markets.
From a government initiative standpoint, regulatory and financial support is reinforcing syngas infrastructure investment. The U.S. Department of Energy (DOE) announced up to $15 million in federal funding in September 2023 specifically supporting research and development projects that convert feedstocks including coal, biomass, and waste plastics into syngas for low-cost clean hydrogen production. Furthermore, the DOE awarded BASF Corporation funding under its Industrial Demonstrations Program in October 2024 to advance syngas production from recycled chemical byproduct streams at its Freeport, Texas manufacturing site, targeting a reduction in CO2 emissions associated with existing incineration processes by at least 75% through plasma gasification and renewable power integration.
By Production Technology
Steam Reforming dominates with 48.00% share due to its established industrial use and efficient hydrogen production.
In 2025, Steam Reforming held a dominant market position, capturing more than a 48.00% share in the global syngas market. Its leading position was supported by its widespread use in large-scale hydrogen, ammonia, and methanol production facilities, particularly where natural gas is readily available. The technology has remained the preferred choice because of its high conversion efficiency, well-developed infrastructure, and ability to produce syngas with a consistent composition required for downstream chemical processes.
Partial Oxidation is projected to be the fastest-growing segment in the syngas market during the forecast period. Its growth is supported by its ability to process a wide range of feedstocks, including heavy hydrocarbons and refinery byproducts, making it suitable for integrated refining and petrochemical operations. In 2026, industries continued to explore partial oxidation for applications requiring rapid syngas production and greater operational flexibility. The technology has also gained attention in projects utilizing waste-derived and residual feedstocks, aligning with industrial efforts to improve resource efficiency and reduce waste.
By Feedstock
Natural Gas dominates with 46.50% share due to its reliable supply and efficient syngas production.
In 2025, Natural Gas held a dominant market position, capturing more than a 46.50% share in the global syngas market. Its leading position was supported by its widespread availability, established transportation infrastructure, and suitability for steam reforming, which remains the most commonly used syngas production process. Industries continued to prefer natural gas because it offers consistent feedstock quality and supports efficient production of hydrogen, ammonia, methanol, and other industrial chemicals.
Biomass/Waste is the fastest-growing segment in the syngas market during the forecast period. Its growth is supported by increasing efforts to utilize agricultural residues, municipal solid waste, and other biomass resources as alternative feedstocks for syngas production. The governments and industrial operators continued to promote waste-to-energy and resource recovery projects to reduce landfill disposal and improve the use of renewable carbon sources.
By Gasifier Type
Fixed Bed dominates with 40.00% share due to its proven design and dependable industrial performance.
In 2025, Fixed Bed held a dominant market position, capturing more than a 40.00% share in the global syngas market. Its leading position was supported by its simple reactor design, stable operation, and long-standing use in industrial gasification processes. In 2025, fixed bed gasifiers continued to be preferred for applications where consistent performance, ease of operation, and lower maintenance requirements were important.
Fluidized Bed is projected to be the fastest-growing segment in the syngas market during the forecast period. Its growth is supported by its ability to process a broad range of feedstocks while maintaining efficient heat transfer and uniform operating conditions. Industries continued to adopt fluidized bed gasifiers for biomass and waste-based gasification projects as interest in renewable and alternative feedstocks increased.
By Application
Chemicals dominates with 30.00% share as syngas remains a key industrial feedstock.
In 2025, Chemicals held a dominant market position, capturing more than a 30.00% share in the global syngas market. The segment maintained its leading position because syngas serves as a primary feedstock for producing essential chemicals such as hydrogen, ammonia, methanol, and various chemical intermediates used across multiple industries. In 2025, chemical manufacturers continued to depend on syngas for large-scale production due to its consistent composition and compatibility with established industrial processes.
Power Generation is projected to be the fastest-growing segment in the syngas market during the forecast period. Its growth is supported by increasing interest in cleaner power generation technologies that utilize syngas produced from biomass, waste, and other alternative feedstocks. In 2026, several industrial facilities and energy projects continued to evaluate syngas as a fuel for electricity generation to improve energy efficiency and make better use of locally available resources. The ability of syngas to support integrated energy systems and waste-to-energy projects has also encouraged wider adoption.
Key Market Segments
By Production Technology
- Steam Reforming
- Partial Oxidation
- Biomass Gasification
- Others
By Feedstock
- Natural Gas
- Coal
- Biomass / Waste
- Petroleum Byproducts
By Gasifier Type
- Fixed Bed
- Fluidized Bed
- Entrained Flow
- Others
By Application
- Chemicals
- Power Generation
- Liquid Fuels (GTL)
- Gaseous Fuels
Driver Analysis
Blue hydrogen and CCUS integration
Carbon capture integration is a material growth driver because syngas is intrinsically suited to pre-combustion CO₂ separation: carbon monoxide in the gas stream is shifted with steam to form additional hydrogen and a relatively concentrated CO₂ stream before final hydrogen purification. Conventional steam methane reforming still underpins much of today’s hydrogen supply, yet approximately 30–40% of natural gas used in an SMR facility may be combusted to generate process heat, producing a more dilute flue-gas CO₂ stream; this makes capture design, capture rate and electricity use decisive for project economics.
In the United States, the 45V clean-hydrogen production credit provides up to $3/kg for 10 years, subject to lifecycle-emissions performance and wage-and-apprenticeship rules, materially improving the economics of qualifying low-carbon hydrogen projects.
The current execution gap remains substantial: only seven fossil-based hydrogen-with-CCUS projects were operating in the cited IEA assessment, together producing just over 0.4 MtH₂ per year and capturing nearly 6 MtCO₂ annually, leaving considerable headroom but also permitting, storage and transport risk.
Drivers Impact Analysis
| Driver | (~) % Impact on CAGR | Geographic Relevance | Impact Timeline |
|---|---|---|---|
| Ammonia and hydrogen replacement demand | +2.0 pp | China, India, Middle East, North America | Medium term (2–4 years) |
| Methanol and MTO value-chain expansion | +1.7 pp | China core, Middle East, APAC | Medium term (2–4 years) |
| Blue hydrogen and CCUS integration | +1.5 pp | US Gulf Coast, Canada, Middle East, EU | Medium term (2–4 years) |
| Synthetic aviation fuel mandates | +1.1 pp | EU core, UK, North America, APAC spill-over | Long term (≥ 4 years) |
| Biomass and waste gasification deployment | +0.9 pp | EU, Japan, South Korea, North America | Long term (≥ 4 years) |
| Feedstock arbitrage and modular reforming | +0.8 pp | North America, Middle East, India, Southeast Asia | Short term (≤ 2 years) |
Restraint Analysis
Feedstock price volatility
Feedstock-price instability is the largest near-term restraint because coal, natural gas, petcoke, biomass, oxygen and steam typically dominate syngas cash cost, with raw materials commonly representing about 60–75% of operating expenditure before utilities, maintenance and carbon charges are included. The global gas balance remained fragile through 2025: LNG supply grew only 2.5%, or 13 bcm, in 2024 versus an 8% average annual expansion during 2016–2020, while European hub prices averaged about 40% above first-half 2024 levels and Asian LNG spot prices about 28% higher.
For a natural-gas-reforming facility, a $1/MMBtu upward shift in gas cost can erase a meaningful share of the contribution margin where syngas is sold under fixed-price industrial contracts; in gas-importing markets such as Europe, India, Japan and South Korea, this risk is amplified by currency exposure and seasonal LNG competition. The result is weaker offtake bankability, lower plant utilization during price spikes, shorter contract tenors, and higher required project returns, particularly for merchant syngas projects without captive ammonia, methanol or refining demand.
Restraint Impact Analysis
| Restraint | (~) % Impact on CAGR | Geographic Relevance | Impact Timeline |
|---|---|---|---|
| Feedstock price volatility | -1.9 pp | EU, Northeast Asia, India | Short term (≤ 2 years) |
| High CapEx and financing | -1.7 pp | Global, emerging markets | Medium term (2–4 years) |
| Carbon-cost exposure | -1.5 pp | EU, UK, China, North America | Medium term (2–4 years) |
| CCUS transport gaps | -1.3 pp | EU, Asia-Pacific, India | Medium term (2–4 years) |
| Biomass feedstock inconsistency | -1.1 pp | India, EU, North America, APAC | Long term (≥ 4 years) |
| Technology and equipment risk | -0.9 pp | Global, APAC corridors | Short term (≤ 2 years) |
Opportunity Analysis
E-SAF syngas hubs
E-sustainable aviation fuel is an untapped syngas opportunity rather than a current baseline driver because only a small number of projects have reached final investment decision, while most existing syngas capacity is configured for ammonia, methanol, hydrogen or refinery use rather than Fischer–Tropsch synthesis of e-kerosene. The commercial opening is created by ReFuelEU Aviation: fuel suppliers at qualifying EU airports must provide at least 2% SAF from 2025, increasing to 6% in 2030, 20% in 2035 and 70% in 2050, while synthetic aviation fuel has a dedicated minimum share of 1.2% in 2030, 2% in 2032, 5% in 2035 and 35% in 2050.
An integrated e-SAF hub can monetize three linked streams—renewable electricity converted into hydrogen, captured biogenic or industrial CO₂ converted into CO through reverse water-gas shift, and syngas upgraded through Fischer Tropsch synthesis rather than selling intermediate hydrogen into a volatile commodity market. Developers that secure 10–15-year airline offtakes, renewable-power contracts below roughly $35–45/MWh, and access to point-source CO₂ can target higher contracted realizations than merchant syngas sales; the white space is particularly strong around European import corridors and Gulf Coast or Middle Eastern export hubs, where lower-cost power and CO₂ aggregation can support exported synthetic-fuel molecules.
Opportunity Impact Analysis
| Opportunity | (~) % Potential CAGR | Geographic Relevance | Execution Window |
|---|---|---|---|
| E-SAF syngas hubs | +2.2 pp | EU core, US, Middle East | Medium term (2–4 years) |
| Carbon-negative bio-syngas | +1.8 pp | North America, EU, Brazil, India | Long term (≥ 4 years) |
| Waste-to-chemicals platforms | +1.6 pp | EU, Japan, South Korea, US | Medium term (2–4 years) |
| CCUS cluster monetization | +1.4 pp | US Gulf Coast, Canada, North Sea, Middle East | Short term (≤ 2 years) |
| Modular remote-industry systems | +1.1 pp | India, Southeast Asia, Africa, LATAM | Medium term (2–4 years) |
| Gas-fermentation chemicals | +1.0 pp | North America, EU, China, Japan | Long term (≥ 4 years) |
Challenges Analysis
Feedstock Quality Variance
Feedstock variability remains an ongoing systems challenge rather than an immediate restraint because plants can continue operating, but at reduced availability, lower cold-gas efficiency and higher conditioning cost when coal quality, biomass moisture, waste composition, ash fusion temperature, sulfur or chlorine content moves outside design assumptions. Raw materials account for roughly 60–75% of syngas operating expenditure, so a 5–10% decline in usable heating value or a 5-percentage-point rise in moisture can increase drying duty, oxygen consumption, ash disposal, trucking intensity and per-unit gas cost simultaneously.
India illustrates the operational complexity: crop-residue supply is heavily seasonal, with about 59% generated in the kharif cycle and 39% in rabi, forcing developers to design for storage, baling, densification and 6–9 months of working-capital inventory; Europe and North America face similar challenges from municipal-waste sorting and competing biomass uses.
The durable mitigation model is feedstock portfolio management three or more qualified feedstock classes, real-time calorific-value and contaminant monitoring, preprocessing hubs within roughly 75–150 km of plant sites, and supply contracts indexed to moisture and ash—rather than reliance on a nominal annual resource calculation.
Challenges Impact Analysis
| Challenge | (~) % CAGR Friction Drag | Geographic Relevance | Mitigation Horizon |
|---|---|---|---|
| Feedstock Quality Variance | -1.3 pp | India, EU, North America, APAC | Long term (≥ 4 years) |
| Gas Cleanup Reliability | -1.2 pp | Global, waste-to-fuels hubs | Medium term (2–4 years) |
| Specialist Equipment Lead Times | -1.0 pp | APAC, EU, Middle East, India | Medium term (2–4 years) |
| Skilled Operations Gap | -0.9 pp | North America, EU, APAC | Long term (≥ 4 years) |
| Water-Energy Integration | -0.8 pp | India, China, Middle East, Africa | Long term (≥ 4 years) |
| Molecule Logistics Mismatch | -0.7 pp | EU, APAC corridors, India | Medium term (2–4 years) |
Geopolitical Impact Analysis
Ongoing conflicts are increasing logistics costs and feedstock uncertainty for the Isopropyl Alcohol market.
The ongoing Russia-Ukraine war and instability in the Red Sea continue to influence the global isopropyl alcohol (IPA) market by disrupting energy markets and international chemical supply chains. IPA production depends on propylene, a petrochemical derived from crude oil and natural gas, making manufacturers sensitive to geopolitical volatility. Shipping disruptions have also affected the movement of petrochemicals and finished chemicals between Asia, Europe, and the Middle East.
- According to the International Monetary Fund (IMF), trade through the Suez Canal fell by 50% during the first two months of 2024 compared with a year earlier. The IMF also states that the Suez Canal normally carries about 15% of global maritime trade, while vessel diversions around the Cape of Good Hope increased delivery times by 10 days or more on average. These factors have increased freight costs and inventory planning challenges for chemical producers.
The conflict has also reshaped commodity trade and maritime transport patterns. The United Nations Conference on Trade and Development (UNCTAD) reported that weekly transits through the Suez Canal declined by 42% over two months, while weekly container ship transits dropped by 67% as shipping companies rerouted vessels to avoid security risks. These longer routes have raised transportation expenses for bulk chemicals, including isopropyl alcohol, encouraging manufacturers to strengthen regional production, diversify sourcing, and maintain higher inventories to improve supply resilience for pharmaceutical, electronics, coatings, and industrial customers.
Regional Analysis
Asia Pacific: Syngas Industry Regional Overview.
Asia Pacific stands as the dominating region in the global syngas market, commanding a 33.00% share and valued at approximately 6.07 Bn, driven primarily by large scale coal based chemical and fuel production in China.
- According to the International Energy Agency’s Bioenergy Task 33 status report published in September 2025, China operates over eighty large scale gasification plants, positioning it as a global leader in the technology. The same report notes that China has over ninety renewable methanol projects planned or under construction, and the country is projected to account for over 60% of global green methanol production by 2028, supported by national industrial strategies and an emerging carbon tax framework.
Per the IEA’s Gas 2025 report, the Asia Pacific region is expected to represent around half of the increase in global natural gas demand through 2030, with China alone projected to account for a quarter of that global demand growth, reflecting continued expansion of gas and syngas linked industrial infrastructure.
The U.S. Department of Energy’s National Energy Technology Laboratory also maintains a dedicated China Gasification Database, documenting the country’s extensive existing and planned coal based gasification capacity used across fuels, chemicals, ammonia, fertilizer, and power generation applications, reinforcing the depth of the regional industrial base.
Key Regions and Countries Covered
- North America
- The US
- Canada
- Europe
- Germany
- France
- The UK
- Spain
- Italy
- Russia & CIS
- Rest of Europe
- APAC
- China
- Japan
- South Korea
- India
- ASEAN
- Rest of APAC
- Latin America
- Brazil
- Mexico
- Rest of Latin America
- Middle East & Africa
- GCC
- South Africa
- Rest of MEA
Key Players Analysis
Syngas producers concentrate their competitive strategies around feedstock flexibility, process efficiency, and downstream integration. A central priority is advancing gasification and reforming technologies that can handle diverse feedstocks, including natural gas, coal, biomass, and waste plastics, without compromising output purity or operational reliability. Companies invest significantly in carbon capture integration alongside syngas production units, as regulatory pressure around industrial emissions continues to intensify across North America, Europe, and Asia Pacific.
On the commercial side, producers pursue vertical integration with downstream chemical manufacturers producing ammonia, methanol, and synthetic fuels, converting syngas from a commodity intermediate into a captive value-chain input. Capacity expansion in Asia Pacific remains a core strategic lever, given the region’s concentrated demand from fertilizer production, refining, and petrochemical sectors.
Producers also emphasize plant automation, digital process monitoring, and operational standardization to sustain output consistency at larger production scales. Forming multi-year offtake agreements with ammonia and methanol producers reinforces customer retention and supports stable revenue visibility, particularly as the global energy transition reshapes long-term demand patterns for syngas-derived products.
Market Key Players
- Air Products and Chemicals Inc.
- Linde plc
- Air Liquide
- BASF SE
- Shell plc
- Siemens Energy
- KBR Inc.
- Sasol
- Topsoe A/S
- Chiyoda Corporation
- Maire Tecnimont
- Dow Inc.
- Methanex Corporation
- John Wood Group
- Synthesis Energy Systems
Key Development
- In June 2025, Linde plc signed a long-term agreement with Blue Point Number One to build and operate a US$400+ million air separation unit in Louisiana, supporting a 4 million metric ton low-carbon ammonia plant expected to begin operations in 2029.
- In December 2025, Hyundai Motor Group and Air Liquide expanded their strategic partnership by renewing their Memorandum of Understanding (MoU) to accelerate hydrogen production, storage, transportation, and utilization across Europe, South Korea, and the United States, with a focus on heavy-duty mobility.
Report Scope
| Report Features | Description |
|---|---|
| Market Value (2025) | USD 18.4 Bn |
| Forecast Revenue (2035) | USD 38.1 Bn |
| CAGR (2026 2035) | 7.6% |
| Base Year for Estimation | 2025 |
| Historic Period | 2020 2024 |
| Forecast Period | 2026 2035 |
| Report Coverage | Revenue Forecast, Market Dynamics, Competitive Landscape, Recent Developments |
| Segments Covered | By Production Technology (Steam Reforming, Partial Oxidation, Biomass Gasification, and Others), By Feedstock (Natural Gas, Coal, Biomass/Waste, and Petroleum Byproducts), By Gasifier Type (Fixed Bed, Fluidized Bed, Entrained Flow, and Others), By Application (Chemicals, Power Generation, Liquid Fuels (GTL), and Gaseous Fuels) |
| Regional Analysis | North America – The US & Canada; Europe – Germany, France, The UK, Spain, Italy, Russia & CIS, Rest of Europe; APAC China, Japan, South Korea, India, ASEAN & Rest of APAC; Latin America Brazil, Mexico & Rest of Latin America; Middle East & Africa GCC, South Africa, & Rest of MEA |
| Competitive Landscape | Air Products and Chemicals Inc., Linde plc, Air Liquide, BASF SE, Shell plc, Siemens Energy, KBR Inc., Sasol, Topsoe A/S, Chiyoda Corporation, Maire Tecnimont, Dow Inc., Methanex Corporation, John Wood Group, and Synthesis Energy Systems. |
| Customization Scope | Customization for segments, region/country level will be provided. Moreover, additional customization can be done based on the requirements. |
| Purchase Options | We have three licenses to opt for: Single User License, Multi User License (Up to 5 Users), Corporate Use License (Unlimited Users and Printable PDF) |





































