Report Overview
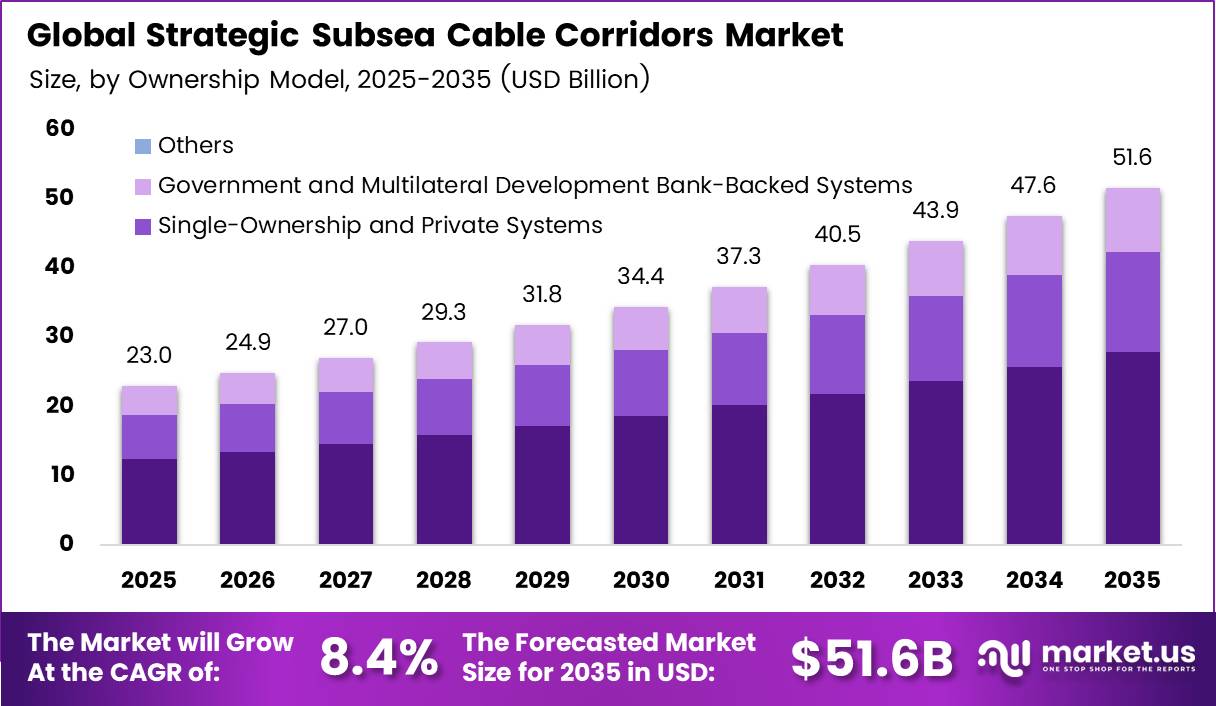
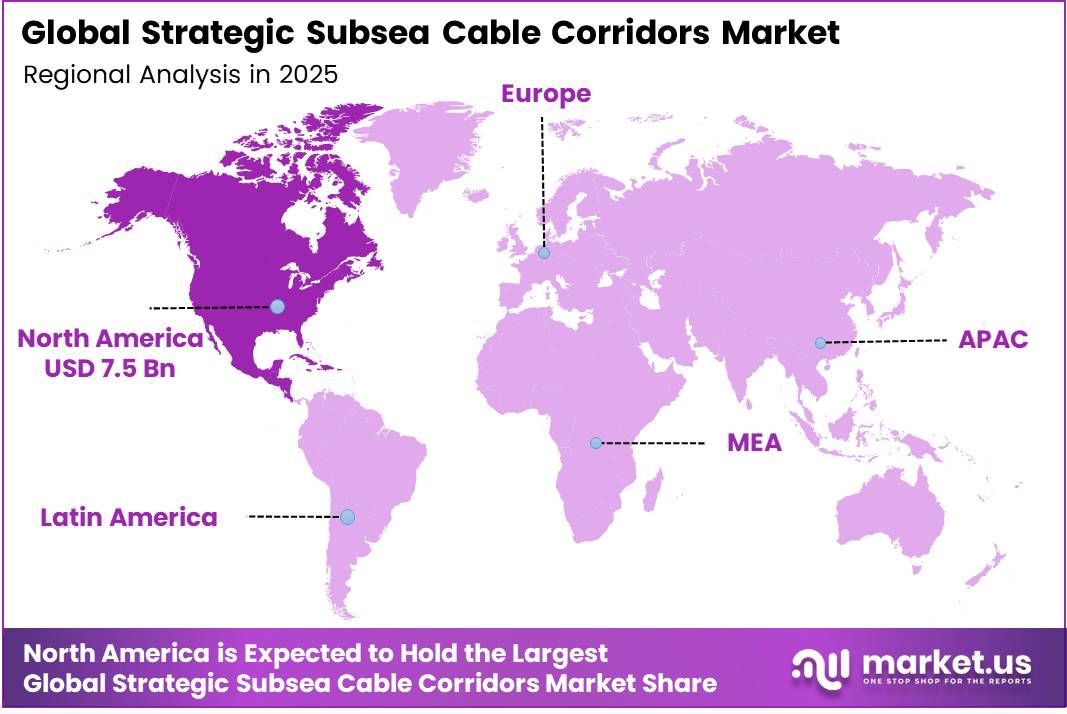
In 2025, the Global Strategic Subsea Cable Corridors Market was valued at USD 23.0 billion. The market is projected to grow at a CAGR of 8.4% during 2026–2035, reaching approximately USD 51.6 billion by 2035. North America dominated the global market in 2025, accounting for more than 32.7% of the total market share and generating approximately USD 7.5 billion in revenue.
Digital demand drives this growth. The ITU reports that subsea cables carry about 99% of the world’s Internet traffic. More than 500 active and planned cable systems now span the globe. The ITU also estimates that builders laid nearly 200,000 km of new subsea cable in 2024, and it expects this pace to continue. Faults also create steady service demand.
The International Cable Protection Committee logged over 170 cable repairs in 2025. That equals almost 4 failures each week. AI, cloud computing, and data center growth push operators to add new routes and capacity on key corridors.
The North America region hosts the largest cloud and content companies, and these firms now pay for most new long-haul corridors. Meta plans PETAL, a 7,000 km cable between the US and France. It will carry 1 petabit per second and should open in 2029. Capacity matters for the wider economy too. IFC research shows that doubling cable capacity can cut a country’s Internet prices by 30 to 50 percent.
Key Takeaways
- The Strategic Subsea Cable Corridors Market stood at USD 23.0 billion in 2025 and should reach USD 51.6 billion by 2035. grow at a CAGR of 8.4% from 2026 to 2035.
- Transatlantic Corridors lead the corridor type segment with a 26.6% share.
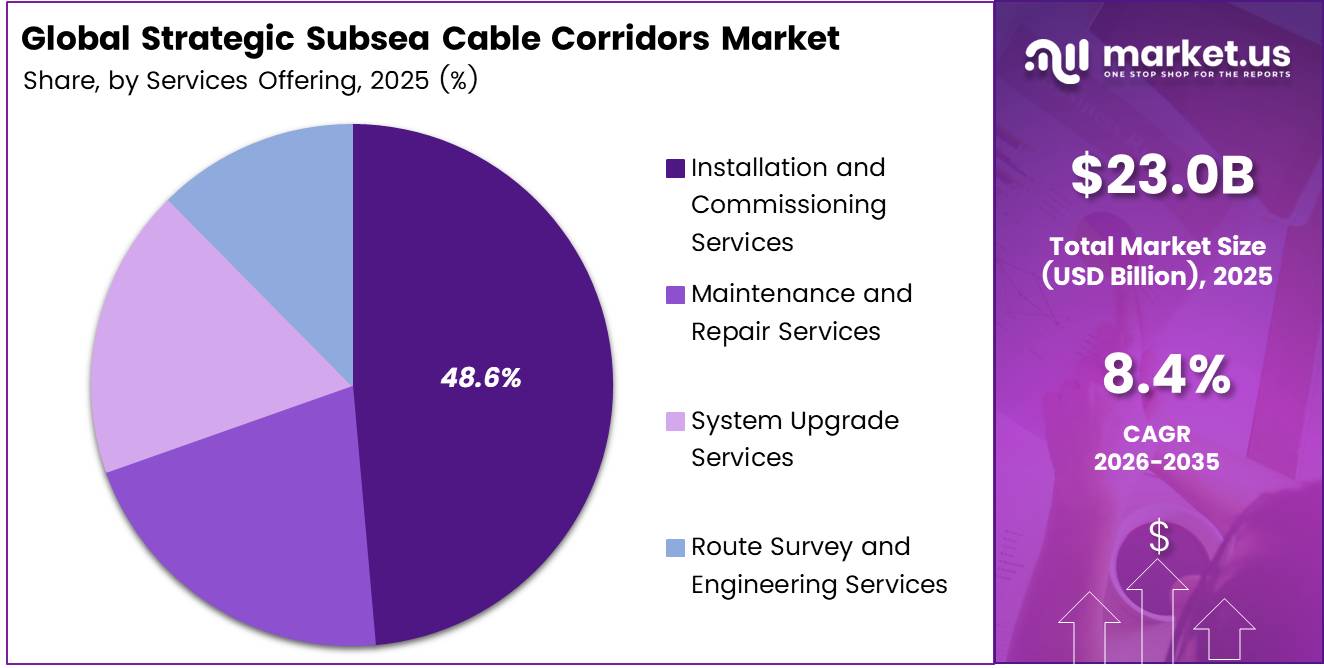
- Installation and Commissioning Services lead the services offering segment with a 48.6% share.
- Consortium and Multiple-Ownership Systems lead the ownership model segment with a 54.1% share.
- North America leads with a 32.7% share and USD 7.5 billion in revenue.
By Corridor Type
Transatlantic Corridors dominate with 26.6% due to dense US-Europe cloud and finance traffic.
Transatlantic Corridors lead because they join the two largest digital economies and their busy data center clusters. Banks, cloud platforms and media firms send huge volumes of data between New York, London and Lisbon every second. Submarine cables carry more than 99% of all intercontinental data traffic, and these routes are the oldest and most heavily used part of that system.
Europe-Africa Corridors grow fastest because Africa’s internet demand is rising quickly while its cable supply has been thin. Google’s Equiano cable runs 15,000 km from Portugal to South Africa. It has a design capacity of 144 Tbps, about 20 times more than the last cable built for the region.
Meta’s 2Africa system now lands in 33 countries. Meta expects it to add up to USD 36.9 billion to Africa’s GDP within its first two to three years. Gains this large push carriers, governments and investors to fund new landings along both African coasts.
By Services Offering
Installation and Commissioning Services dominate with 48.6% due to record new long-haul cable builds.
Installation and Commissioning Services hold the largest share because every new system needs a ship to lay the cable, a team to build the landing stations, and testing before launch. These jobs make up most of the money spent on a project. Meta’s 2Africa build, for example, needed work across 50 jurisdictions over nearly six years.
System Upgrade Services grow fastest because owners can add capacity to cables already on the seabed without laying new ones. Newer equipment at the landing stations raises the output of each fibre pair. Equiano shows the scale: it has 12 fibre pairs, each carrying 12 Tbps.
Demand keeps rising too. The ITU says 6.3 billion people, or 76% of the world, use the internet in 2026, up from 6.1 billion in 2025. Operators upgrade existing systems to meet that growth at a lower cost per bit.
By Ownership Model
Consortium and Multiple-Ownership Systems dominate with 54.1% due to shared cost and landing rights.
Consortium and Multiple-Ownership Systems lead because sharing the cost lowers the risk of very large projects. Local partners also make landing permits easier to get. 2Africa brings Meta together with Telecom Egypt, China Mobile International, MTN, Orange, Center3, Vodafone and WIOCC. Its Mediterranean section alone has a design capacity of 180 Tbps.
Single-Ownership and Private Systems grow fastest because cloud companies want full control over their routes, timelines, and upgrade plans. Equiano is Google’s third private international cable, after Curie and Dunant. Google now holds ownership stakes in 33 subsea systems worldwide.
Key Market Segments
By Corridor Type
- Transatlantic Corridors
- Transpacific Corridors
- Europe-Asia Corridors
- Europe-Africa Corridors
- Intra-Asia Corridors
- Americas Corridors
- Middle East-India Corridors
- Pacific Island Corridors
By Services Offered
- Installation and Commissioning Services
- Maintenance and Repair Services
- System Upgrade Services
- Route Survey and Engineering Services
By Ownership Model
- Consortium and Multiple-Ownership Systems
- Single-Ownership and Private Systems
- Government and Multilateral Development Bank-Backed Systems
Geopolitical Impact Analysis
Conflict in the Red Sea has changed how the industry moves its ships and cargo. UNCTAD reports that in early May 2025, ship tonnage through the Suez Canal stayed 70% below the 2023 average. Ships that once crossed the Red Sea in days now sail for weeks around the Cape of Good Hope. Cable ships, repeater shipments, and armored cable reels all travel on these longer routes.
The delays add 10 to 14 days to Asia-to-Europe trips. In late 2024, UNCTAD found Suez transits averaging 33 per day. That was 57% below the earlier peak. UNCTAD also warned that higher container freight rates could raise global consumer prices by 0.6% by late 2025. These freight costs feed directly into the landed cost of cable, steel armor wire, and landing station equipment.
Trade policy adds a second cost layer. In August 2025, the US placed a 50% tariff on imports of semi-finished copper products. Copper sits inside the power conductor of every repeatered cable, so the tariff raises costs for US builds that use imported parts. Buyers now prefer suppliers that make cable inside the region.
Recovery has started but remains uneven. In the week ending 1 November 2026, 53 containerships crossed the Suez Canal, up 130% from the same week in 2025. About 60% of Asia-to-Europe capacity now uses Suez again. Total tonnage still runs about one-third below pre-crisis levels. This keeps Middle East and Europe-Asia corridor schedules exposed to risk.
Regional Analysis
North America dominates the Strategic Subsea Cable Corridors Market, holding a 32.7% share and generating USD 7.5 billion in revenue. The US anchors this lead. It hosts the largest hyperscale buyers, the busiest Atlantic landing points, and SubCom, the main US system builder.
Asia Pacific is the fastest-growing region in the market. Japan, South Korea, and Taiwan anchor new Pacific builds. SK Broadband, SoftBank, and Verizon are building a 12,500 km cable that links South Korea, the US, Japan, and Taiwan, with completion set for 2028. Alcatel Submarine Networks signed SX Tasman Express, which links Sydney and Auckland with 400 terabits of capacity over 16 fibre pairs.
Europe holds a strong supply position. Prysmian earned 88% of its 2025 Transmission sales in EMEA. NKT kept a high-voltage order backlog of EUR 10.2 billion at the end of 2025. The UK, France, and Italy host major Atlantic and Mediterranean landing points. Europe also serves as the northern anchor for the fast-growing Europe-Africa corridors.
Key Regions and Countries
North America
- US
- Canada
Europe
- Germany
- France
- The UK
- Spain
- Italy
- Rest of Europe
Asia Pacific
- China
- Japan
- South Korea
- India
- Australia
- Rest of APAC
Latin America
- Brazil
- Mexico
- Rest of Latin America
Middle East and Africa
- GCC
- South Africa
- Rest of MEA
Market Dynamics
Drivers
| Driver | (~) % Impact on CAGR Forecast | Geographic Relevance | Impact Timeline |
|---|---|---|---|
| Hyperscaler-Funded Private Cable Builds | +2.6% | North America, Asia-Pacific, Europe | Short term (2 years or less) |
| AI Data Center Interconnect Demand | +2.1% | Global | Short term (2 years or less) |
| Geopolitical Route Diversification | +1.7% | Red Sea, Indo-Pacific, Baltic | Medium term (2 to 4 years) |
| Government Security Funding Programs | +1.2% | US, EU, Japan, Australia | Medium term (2 to 4 years) |
| Offshore Wind Export Cabling | +0.9% | North Sea, US East Coast, Taiwan | Medium term (2 to 4 years) |
| SDM Fiber-Pair Capacity Upgrades | +0.7% | Transatlantic, Transpacific | Short term (2 years or less) |
Hyperscaler-Funded Private Cable Builds
The ownership model for strategic corridors has moved from telecom carrier consortia to cloud operators building and controlling their own cables, and this shift is now the biggest lift to the baseline at about +2.6%. Content providers now account for roughly 70% of used international bandwidth, according to ITU international connectivity tracking.
Meta announced its Project Waterworth system in 2025, a planned 50,000 km build spanning five continents, per company disclosures. Google expanded its Pacific and Indian Ocean portfolio with Umoja, Bulikula, and Tabua, per Alphabet investor communications. On capital expenditure guidance, Alphabet signaled about USD 75 billion in total infrastructure spend.
Commercially, cable suppliers are moving from consortium tenders with cost-plus pricing to bilateral design-build contracts with long-term maintenance agreements. These contracts give suppliers revenue visibility of 10 to 15 years. They also lower per-fiber-pair costs by an estimated 15% to 20% through spatial division multiplexing designs of 16 to 24 fiber pairs, according to SubCom and NEC engineering disclosures.
Restraints
| Restraint | (~) % Impact on CAGR Forecast | Geographic Relevance | Impact Timeline |
|---|---|---|---|
| Cable Ship Capacity Shortfall | -1.4% | Global | Medium term (2 to 4 years) |
| Landing License Bans and Vetting | -1.1% | US, South China Sea, India | Short term (2 years or less) |
| Conflict-Zone Route Suspension | -0.8% | Red Sea, Black Sea | Short term (2 years or less) |
| Repeater and Fiber Supply Constraints | -0.6% | Global | Short term (2 years or less) |
| High Financing Costs for Developers | -0.5% | Africa, Pacific Islands, Latin America | Short term (2 years or less) |
Cable Ship Capacity Shortfall
The global fleet of cable-laying and repair ships is small and aging, and it now sets a hard limit on how many cables can be installed each year. Roughly 60 vessels serve the whole market, and more than 40% are over 20 years old, per International Cable Protection Committee assessments.
The installation queue is booked roughly 2 to 3 years ahead, according to ASN and SubCom order disclosures. Repair response times in Asia-Pacific stretched past 40 days during the 2024 Red Sea and West Africa outages, per ITU incident reporting.
A new cable ship costs about USD 150 to 200 million and takes 3 to 4 years to build, per shipyard order data from Japanese and Norwegian builders. As a result, systems that are already financed slip in their ready-for-service dates. That pushes revenue recognition back by one to two fiscal cycles and raises charter day rates by an estimated 25% to 35%, squeezing installer margins on fixed-price contracts.
Challenges
| Challenge | (~) % CAGR Friction Drag | Geographic Relevance | Mitigation Horizon |
|---|---|---|---|
| Sabotage and Anchor-Drag Risk | -0.9% | Baltic, Taiwan Strait, Red Sea | Long term (4 years or more) |
| Specialized Marine Talent Deficit | -0.6% | Global | Long term (4 years or more) |
| Fragmented Permitting Across Jurisdictions | -0.5% | EU, Southeast Asia, Africa | Medium term (2 to 4 years) |
| Concentrated Supplier Base Risk | -0.4% | Global | Long term (4 years or more) |
| Rising Marine Insurance Premiums | -0.3% | Red Sea, Indo-Pacific | Medium term (2 to 4 years) |
Sabotage and Anchor-Drag Risk
Strategic corridors run through crowded, contested waters, which leaves them physically exposed even though cables are carrying more and more critical traffic. Each year there are about 150 to 200 cable faults worldwide, and roughly 70% to 80% are caused by fishing and anchoring, according to International Cable Protection Committee data.
Together, these can add about 8% to 12% to system capital cost, based on supplier engineering estimates. Over the long term, operators will need shared repair-ship arrangements, coordination with navies, and predictive surveillance to limit the drag without stopping current builds.
Opportunities
| Opportunity | (~) % Potential CAGR Upside | Geographic Relevance | Execution Window |
|---|---|---|---|
| Fiber-Sensing Monitoring as a Service | +1.5% | Europe, North America, Asia-Pacific | Medium term (2 to 4 years) |
| Arctic and Polar Route Development | +1.1% | Nordic, North America, Japan | Long term (4 years or more) |
| Pacific Island and African Branching Units | +0.9% | Pacific Islands, Africa | Medium term (2 to 4 years) |
| Interregional Power Interconnector Corridors | +0.8% | Europe, Middle East, India | Long term (4 years or more) |
| Repair Vessel Pooling Consolidation | +0.6% | Global | Medium term (2 to 4 years) |
Fiber-Sensing Monitoring as a Service
Distributed acoustic and SMART cable sensing remain largely untapped commercially. Most deployed systems still use their fibers only for data traffic, and fewer than 5% of active systems carry integrated sensing, per ITU-WMO-UNESCO Joint Task Force assessments.
This is unused capacity that needs deliberate productization, so it does not yet count as a baseline driver. That would add recurring service revenue on top of existing capacity, with incremental gross margins estimated at 45% to 60% against roughly 15% to 25% for traditional supply contracts, based on margin structures in equipment-vendor annual reports.
Retrofitting sensing at landing stations costs an estimated 3% to 5% of original system CapEx. Funding channels such as the EU Connecting Europe Facility and US State Department CABLES programming could cover a meaningful share of early deployments.
Key Players Analysis
Tier 1 leaders include SubCom, Alcatel Submarine Networks, NEC Corporation, and HMN Technologies. These firms design, build, and install full cable systems from end to end. SubCom won the MANTA contract and the full Arctic Way supply deal in 2025. Alcatel Submarine Networks secured SX Tasman Express, with 400 terabits over 16 fibre pairs.
Prysmian leads the cable makers by scale. It posted group revenue of EUR 19,650 million in 2025 and adjusted EBITDA of EUR 2,398 million. Its Transmission segment grew 28.7% organically to EUR 3,262 million. Submarine telecom made up 1% of that segment. Prysmian now targets telecom through deals. It agreed to buy Xtera at an enterprise value of USD 65 million and ACSM for EUR 169 million.
Nexans and NKT form a strong Tier 2 group. Nexans posted standard sales of EUR 6.1 billion in 2025, with 8.3% organic growth. It spent EUR 383 million on CapEx, or 6.3% of sales, mostly on the cable-laying vessel Electra and its Charleroi plant. NKT reached revenue of EUR 2,722 million and won EUR 1.2 billion in new high-voltage awards.
The Asian challengers include Sumitomo Electric, Furukawa Electric, LS Cable and System, Taihan, Hengtong, ZTT, and Orient Cable. They compete in cable supply and regional installation, mostly in Asia Pacific corridors. Hellenic Cables strengthens supply in the Mediterranean.
Top Key Players in the Market
- SubCom, LLC
- Alcatel Submarine Networks SAS
- NEC Corporation
- Prysmian S.p.A.
- Nexans S.A.
- HENGTONG GROUP CO., LTD.
- HMN Technologies Co., Ltd.
- NKT A/S
- Sumitomo Electric Industries, Ltd.
- LS Cable & System Ltd.
- Ningbo Orient Wires & Cables Co., Ltd.
- Jiangsu Zhongtian Technology Co., Ltd.
- Hellenic Cables S.A.
- Taihan Cable & Solution Co., Ltd.
- Furukawa Electric Co., Ltd.
Recent Developments
- In June 2025, Alcatel Submarine Networks signed the SX Tasman Express contract with Southern Cross and OMS Group. The cable will link Sydney and Auckland with 400 terabits of capacity over 16 fibre pairs.
- In December 2025, Prysmian S.p.A. agreed to buy Xtera through its 80:20 joint venture with Fincantieri, at an enterprise value of USD 65 million. Prysmian S.p.A. agreed to buy ACSM, a Spanish subsea survey and cable installation company, for EUR 169 million (USD 183 million). The price includes EUR 24 million of CapEx for a vessel delivered in late 2025.
- In September 2026, Xtera won the optical engineering and wet and dry plant contract for EXA Meridian, a 6,552 km transatlantic cable with 24 fiber pairs and more than 500 Tbps of capacity.
Report Scope
| Report Features | Description |
|---|---|
| Market Value (2025) | USD 23.0 Billion |
| Forecast Revenue (2035) | USD 51.6 Billion |
| CAGR (2026-2035) | 8.4% |
| Base Year for Estimation | 2025 |
| Historic Period | 2020-2024 |
| Forecast Period | 2026-2035 |
| Report Coverage | Revenue Forecast, Market Dynamics, Competitive Landscape, Recent Developments |
| Segments Covered | By Corridor Type (Transatlantic Corridors, Transpacific Corridors, Europe-Asia Corridors, Europe-Africa Corridors, Intra-Asia Corridors, Americas Corridors, Middle East-India Corridors, Pacific Island Corridors); By Services Offering (Installation and Commissioning Services, Maintenance and Repair Services, System Upgrade Services, Route Survey and Engineering Services); By Ownership Model (Consortium and Multiple-Ownership Systems, Single-Ownership and Private Systems, Government and Multilateral Development Bank-Backed Systems) |
| Regional Analysis | North America – US, Canada; Europe – Germany, France, The UK, Spain, Italy, Rest of Europe; Asia Pacific – China, Japan, South Korea, India, Australia, Singapore, Rest of APAC; Latin America – Brazil, Mexico, Rest of Latin America; Middle East & Africa – GCC, South Africa, Rest of MEA |
| Competitive Landscape | SubCom, LLC, Alcatel Submarine Networks SAS, NEC Corporation, Prysmian S.p.A., Nexans S.A., HENGTONG GROUP CO., LTD., HMN Technologies Co., Ltd., NKT A/S, Sumitomo Electric Industries, Ltd., LS Cable & System Ltd., Ningbo Orient Wires & Cables Co., Ltd., Jiangsu Zhongtian Technology Co., Ltd., Hellenic Cables S.A., Taihan Cable & Solution Co., Ltd., Furukawa Electric Co., Ltd. |
| Customization Scope | Customization for segments and region/country-level will be provided. Moreover, additional customization can be done based on the requirements. |
| Purchase Options | We have three licenses to opt for: Single User License, Multi-User License (Up to 5 Users), Corporate Use License (Unlimited Users and Printable PDF) |