


Report Overview
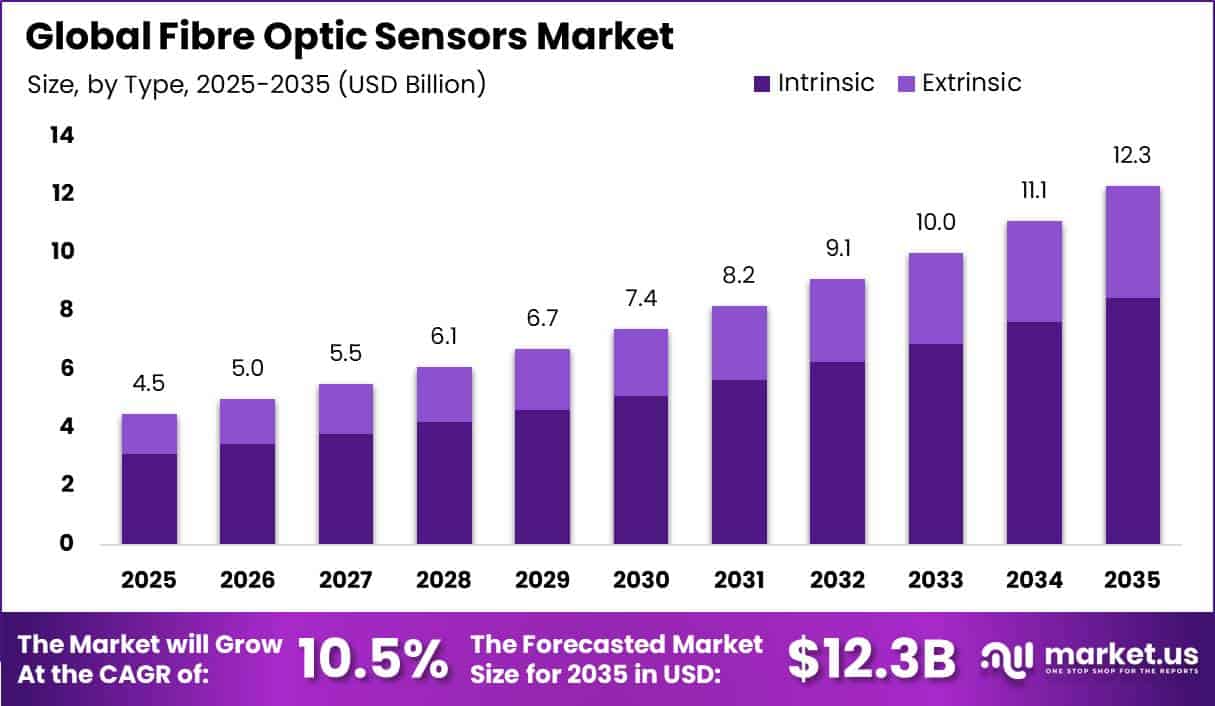
In 2025, the Global Fibre Optic Sensors Market was valued at USD 4.5 billion. The market is projected to grow at a CAGR of 10.5% during 2026–2035, reaching approximately USD 12.3 billion by 2035. North America dominated the global market in 2025, accounting for more than 43.6% of the total market share and generating approximately USD 1.9 billion in revenue.
Market growth is strongly supported by the rapid expansion of digital infrastructure. According to the International Telecommunication Union, global fixed broadband subscriptions reached 1.5 billion in 2024 and are expected to rise to 1.6 billion in 2025. Global internet users also exceeded 5.5 billion in 2024 and are moving toward 6 billion by 2025.
Energy infrastructure is also creating strong demand. Global investment in electricity grids reached USD 375 billion in 2024, increasing at nearly 9% annually, while total power-sector spending was expected to reach USD 400 billion. Fibre optic sensors are increasingly used in grids and pipelines for fault, leak, and temperature monitoring.
Industrial automation provides another growth area. The International Federation of Robotics reported 542,000 industrial robot installations in 2024, increasing the global operational stock to 4.7 million units, while Asia accounted for 74% of total installations. Rising automation therefore continues to support fibre optic sensor adoption worldwide.
Key Takeaway
- The Fibre Optic Sensors Market was valued at USD 4.5 billion in 2025 and is projected to reach USD 12.3 billion by 2035. The market is expected to grow at a CAGR of 10.5% between 2026 and 2035.
- The intrinsic segment led the By Type category with a 68.8% share.
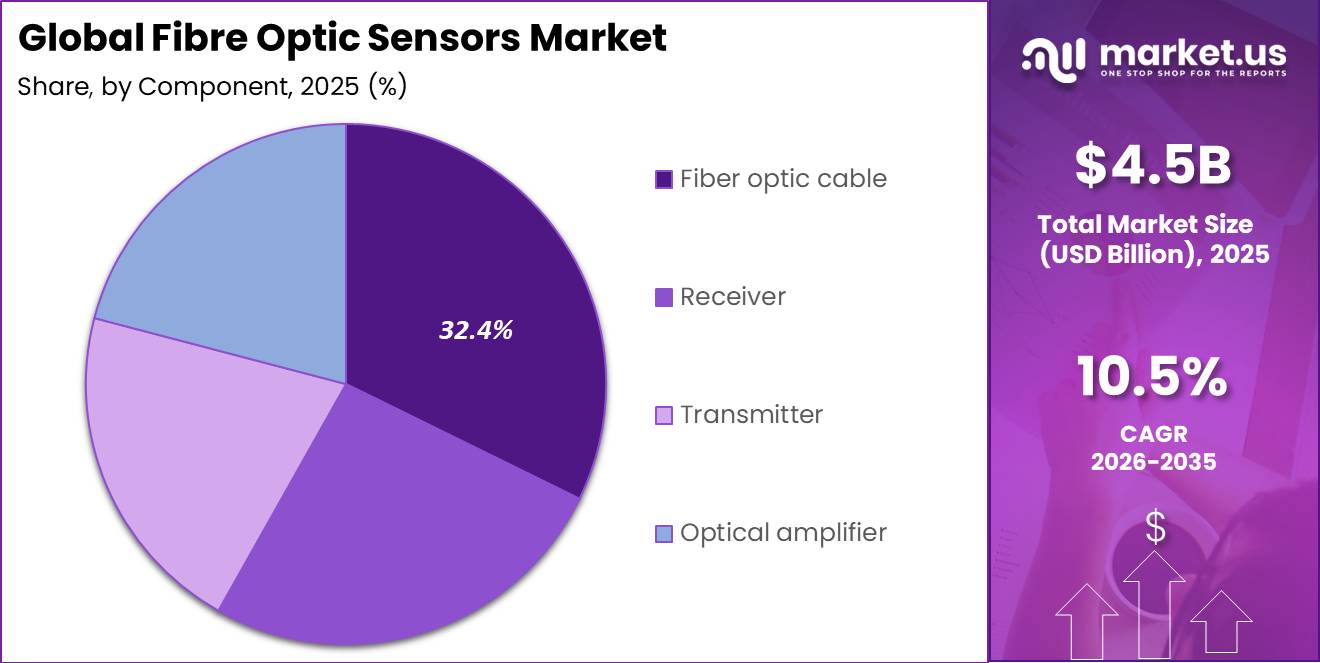
- The fibre optic cable segment led the By Component category with a 32.4% share.
- The industrial segment led the By End-User category with a 29.4% share.
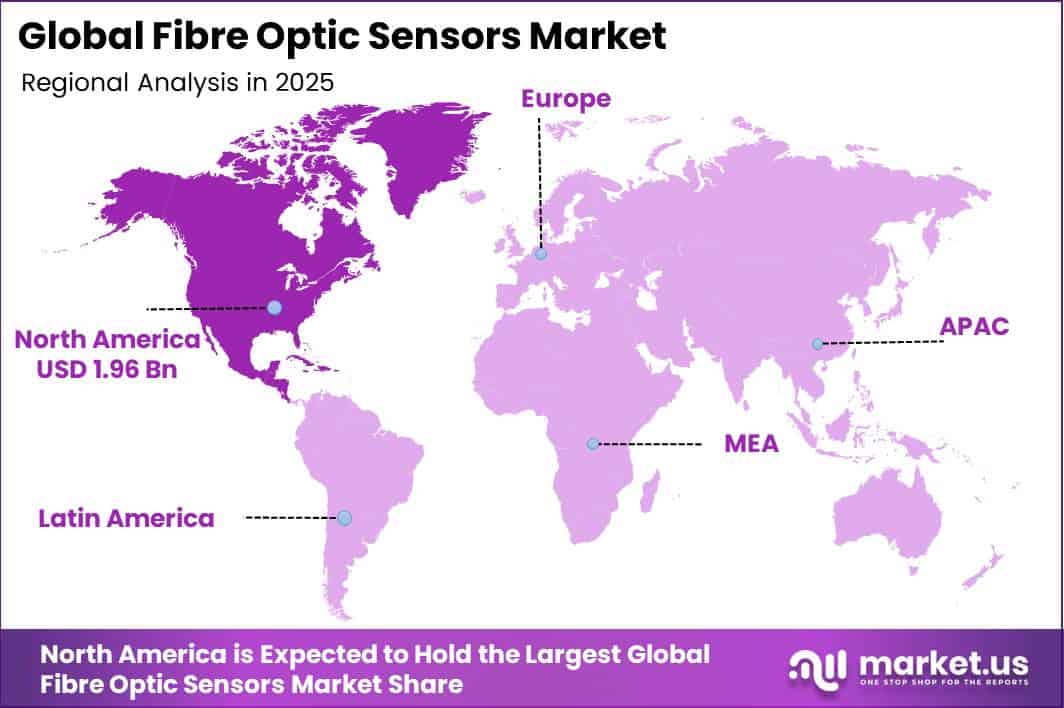
- North America led the market in 2025 with a 43.6% share and about USD 1.9 billion in revenue.
Market Statistics and Data Insights
- Global annual grid investment is currently around USD 400 billion, while more than 2,500 GW of renewable generation, storage, data-centre loads, and other projects are waiting in grid connection queues.
- The U.S. Pipeline and Hazardous Materials Safety Administration oversees approximately 3.3 million miles of regulated pipelines. Pipelines transport about 64% of U.S. energy commodities, while PHMSA also oversees 15,880 underground natural-gas storage wells.
- The U.S. National Bridge Inventory contained 624,193 highway bridges in 2025. FHWA classified 41,685 bridges as being in poor condition, while 62,441 bridges were posted for load restrictions.
- Factories installed 542,000 industrial robots globally in 2024, while the worldwide operational robot stock reached 4.664 million units, increasing 9% from the previous year. Europe accounted for 16% of new installations and the Americas for 9%.
- China’s Ministry of Commerce applies anti-dumping duties of 33.3% to 78.2% on specified U.S.-origin single-mode optical fibre. The rate is 37.9% for Corning, 33.3% for OFS Fitel, and 78.2% for Draka Communications Americas and other specified U.S. suppliers.
- By mid-2024, ship tonnage passing through the Suez Canal had fallen 70%, while vessel-capacity arrivals around the Cape of Good Hope increased 89%. Longer routes increased global vessel demand by about 3%, and container-ship demand by 12%. UNCTAD also reported 2024 global schedule reliability of only around 50–55%, compared with 70–85% before COVID.
- Global data-centre electricity consumption increased approximately 17% in 2025, representing an additional 70 TWh of electricity use.
- Electricity consumption at AI-focused data centres jumped 50% during the same year. Such high-density power infrastructure increases the practical need for temperature, power-cable, vibration, and equipment monitoring.
- By mid-2025, Fibre-to-the-Premises coverage reached 74.1% of EU27 households. Very High-Capacity Network coverage reached 85.6%, while overall fixed-connectivity coverage stood at 98.0%. FTTP became the most widespread individual fixed-access technology in Europe for the first time.
- Global renewable-power capacity reached 5,149 GW in 2025 after 692 GW was added during the year. This represented a 15.5% annual increase, while renewable technologies accounted for 85.6% of total global capacity additions.
- The SDM4 MCF work targets the O-band operating range of approximately 1,260–1,360 nm and is designed to improve fibre density and interoperability for AI network infrastructure.
- ITU reported that 6.0 billion people, or 74% of the global population, were online in 2025, up from 5.8 billion in 2024. More than 240 million additional people came online during the year.
- ITU also reported that fixed-broadband subscriptions had recorded average annual growth of 5.9% over the preceding five years, showing continued movement toward data-intensive fixed connectivity.
By Type
The Intrinsic segment held a dominant 68.8% share, supported by its ability to use the optical fibre itself as the sensing element. This allows a single fibre cable to measure strain, temperature, vibration, and pressure across long distances, making it useful for bridges, tunnels, railways, pipelines, and industrial facilities.
According to the U.S. Federal Highway Administration, the National Bridge Inventory covered more than 623,000 highway bridges in 2024, highlighting the large requirement for continuous structural monitoring. Intrinsic fibre optic sensors can detect small changes along the entire fibre length and perform reliably in high-voltage, wet, and corrosive environments where conventional electrical sensors may face interference or performance issues.
Manufacturing activity is also supporting demand. The International Organization of Motor Vehicle Manufacturers reported global motor vehicle production of 92.5 million units in 2024. As factories expand automation, equipment monitoring, and quality-control systems, intrinsic sensors are increasingly used to measure heat, strain, and vibration with high reliability.
By Component
The Fibre Optic Cable segment held a dominant 32.4% share, supported by its role as the main physical medium for transmitting light signals and enabling sensing over long distances. Fibre optic cables can carry large amounts of data while also measuring strain, temperature, vibration, and pressure without electromagnetic interference.
This makes them widely used across telecommunications, transportation networks, industrial facilities, and critical infrastructure. In the U.S., the National Telecommunications and Information Administration allocated USD 42.4 billion through the Broadband Equity, Access, and Deployment program to support high-speed broadband infrastructure, where fibre optic cable is an important equipment requirement.
Europe is also witnessing strong fibre network expansion. Fibre-to-the-premises coverage increased from 56.4% of households in 2022 to 64.0% in 2023. The European Union aims to provide gigabit connectivity to all households by 2030. Every new fibre route requires additional cable for data transmission, while monitoring applications require specialized sensing cables.
By End-User
The Industrial segment held a dominant 29.4% share, driven by strong demand for reliable monitoring systems across factories, mines, and process plants. Fibre optic sensors are well suited to industrial environments because they use light instead of electrical current, allowing them to operate effectively under high temperatures, corrosive conditions, high voltage, and electromagnetic interference.
These sensors are commonly used to monitor machine vibration, furnace temperature, pipeline pressure, and structural strain, helping companies detect equipment problems at an early stage. According to UNIDO, global manufacturing output increased by 1.0% quarter-on-quarter in the fourth quarter of 2024, with Asia and Oceania contributing strongly to the expansion.
Mining and material-processing activities also create significant monitoring requirements. In the United States, mineral production exceeded USD 105 billion in 2023, reflecting the large scale of operations that depend on dependable sensing technologies. As industrial companies focus on reducing downtime, improving process control, and preventing equipment failures, fibre optic sensors are gaining wider adoption.
Key Market Segments
By Type
- Intrinsic
- Extrinsic
By Component
- Fiber optic cable
- Receiver
- Transmitter
- Optical amplifier
By End-User
- Industrial
- Transportation
- Medical
- Defense
- Oil and gas
Geopolitical Impact Analysis
Geopolitical disruptions are increasing transportation costs, delivery times, and supply risks across the fibre optic sensors market. Sensor manufacturers depend on optical fibre, glass preforms, laser sources, photodiodes, connectors, electronic interrogators, and steel- or copper-armoured cables sourced from different countries.
According to UNCTAD, rerouting Asia-Europe shipments around the Cape of Good Hope adds about 12 days, or nearly 30%, to transit times. The Shanghai-Northern Europe spot container rate reached USD 2,648 per TEU in February 2024, around 3.5 times its early-November 2023 level. UNCTAD also recorded a 70% reduction in Suez Canal tonnage by mid-2024, while arrivals around the Cape of Good Hope increased by 89%.
Trade restrictions create another challenge. China imposed anti-dumping duties ranging from 33.3% to 78.2% on selected U.S.-origin single-mode optical fibre products from September 2025. Although the related anti-circumvention measure ended on 10 November 2025, the action showed the sourcing risks faced by fibre-dependent sensor producers.
Energy-price volatility also adds cost pressure. The World Bank estimated that a moderate Middle East supply disruption could increase average Brent crude prices from USD 84 to USD 92 per barrel, while a severe disruption could push prices above USD 100 per barrel. Higher energy and freight costs can increase glass production, cable armouring, transportation, and installation expenses.
Regional Analysis
North America dominated the Fibre Optic Sensors Market in 2025, accounting for a 43.6% share and generating about USD 1.9 billion in revenue. In the United States, the Pipeline and Hazardous Materials Safety Administration regulates nearly 3.3 million miles of pipelines, while pipelines transport around 64% of U.S. energy commodities.
This supports strong demand for distributed fibre optic sensing systems used to detect temperature changes, vibration, pressure variation, intrusion, and possible leaks over long distances. The International Energy Agency expects U.S. electricity demand to increase by around 2% annually through 2030, with data centres contributing about 50% of this growth.
Asia Pacific is expected to be the fastest-growing region, supported by rapid industrialization, electricity consumption, infrastructure development, and factory automation. China and India are projected to contribute around 60% of global electricity-demand growth during 2025–2026.
Electricity demand is expected to rise by 5.7% in China and 6.6% in India in 2026, increasing the need for fibre optic sensing across power grids, renewable energy projects, factories, tunnels, and construction sites. Europe also remains important due to rail, offshore wind, and grid modernization, while Latin America, the Middle East, and Africa provide emerging opportunities across oil and gas.
Key Regions and Countries
- North America
- US
- Canada
- Europe
- Germany
- France
- The UK
- Spain
- Italy
- Rest of Europe
- Asia Pacific
- China
- Japan
- South Korea
- India
- Australia
- Rest of APAC
- Latin America
- Brazil
- Mexico
- Rest of Latin America
- Middle East & Africa
- GCC
- South Africa
- Rest of MEA
Market Dynamics
Drivers
| Driver | (~) % CAGR | Geographic Relevance | Impact Timeline |
|---|---|---|---|
| Grid Asset Monitoring | +2.0% | Global | Medium term (2 to 4 years) |
| Industrial Predictive Maintenance | +1.6% | Asia Pacific, North America, Europe | Short term (2 years or less) |
| Pipeline Integrity Demand | +1.3% | North America, Middle East | Medium term (2 to 4 years) |
| Data Centre Power Growth | +1.1% | North America, China, Europe | Short term (2 years or less) |
| Transport Asset Safety | +0.8% | Europe, Asia Pacific | Long term (4 years or more) |
Grid Asset Monitoring
Grid expansion and replacement remain a major demand driver for fibre optic sensors because these systems allow power cables, transmission corridors, and substations to be monitored continuously. The IEA reported that around 1.5 million km of transmission lines were built globally over the previous decade.
Advanced economies and China may also need to develop or replace transmission lines equal to about 120% of their current network length by 2035. The IEA expects global electricity demand to grow by 3.3% in 2025 and 3.7% in 2026, increasing the need for reliable temperature, strain, and fault monitoring.
In the U.S., PHMSA regulates around 3.3 million miles of pipelines, further supporting demand for long-distance asset monitoring. These trends could contribute around +2.0% to the market’s 10.5% baseline CAGR through higher sensor use, recurring monitoring services, and lower unplanned maintenance risk.
Restraints
| Restraint | (~) % CAGR | Geographic Relevance | Impact Timeline |
|---|---|---|---|
| High Interrogator CapEx | -1.5% | Global | Short term (2 years or less) |
| Long Project Approval Cycles | -1.1% | North America, Europe | Medium term (2 to 4 years) |
| Certification Cost Burden | -0.9% | Global | Medium term (2 to 4 years) |
| Fragmented Procurement Budgets | -0.7% | Emerging Markets | Short term (2 years or less) |
| Legacy Monitoring Lock-In | -0.6% | North America, Europe | Long term (4 years or more) |
High Interrogator CapEx
High upfront spending on interrogators, ruggedised fibre cables, installation, commissioning, and system integration remains a major restraint, especially for asset owners still relying on point sensors and manual inspection.
The IEA estimated that data centres consumed around 415 TWh, equal to 1.5% of global electricity use in 2024, increasing competition for capital between sensing upgrades and essential power infrastructure.
The IEA also projects data-centre electricity demand to reach about 945 TWh by 2030, which may push utilities to prioritise generation and grid expansion ahead of digital-monitoring projects.
High financing costs and fragmented procurement can further delay investment. Together, these factors could create an estimated -1.5% drag against the market’s 10.5% baseline CAGR, as smaller operators postpone purchases, limit deployments to pilot projects, or seek supplier-financed contracts.
Challenges
| Challenge | (~) % CAGR | Geographic Relevance | Mitigation Horizon |
|---|---|---|---|
| Optical Supply Chain Volatility | -1.3% | Global | Medium term (2 to 4 years) |
| Skilled Installation Capacity | -1.0% | Global | Medium term (2 to 4 years) |
| Data Integration Complexity | -0.9% | Global | Long term (4 years or more) |
| Harsh Environment Validation | -0.7% | Offshore, Mining, Energy | Long term (4 years or more) |
| Cybersecurity Compliance Load | -0.5% | North America, Europe | Medium term (2 to 4 years) |
Optical Supply Chain Volatility
Optical supply-chain volatility continues to create friction for fibre optic sensor suppliers, mainly through longer delivery times, higher inventory needs, and more complex sourcing. UN Trade and Development reported that rerouting around the Cape of Good Hope added around 10 days or more to delivery times.
By mid-2024, Suez Canal tonnage was about 70% lower, while Cape of Good Hope arrivals increased by 89%. Longer shipping routes also increased global vessel ton-mile demand by about 3% and container-ship demand by 12%. These disruptions can raise working-capital requirements, delay project schedules, and increase the risk of delivery penalties.
The estimated impact is around -1.3% friction drag against the baseline, reflecting the added cost of dual sourcing, regional assembly, substitute parts, and larger inventory buffers rather than a lasting fall in demand.
Opportunities
| Opportunity | (~) % CAGR | Geographic Relevance | Execution Window |
|---|---|---|---|
| Sensing Analytics Subscriptions | +2.2% | Global | Medium term (2 to 4 years) |
| Carbon Storage Monitoring | +1.7% | North America, Europe, Middle East | Long term (4 years or more) |
| Subsea Cable Assurance | +1.5% | Europe, Asia Pacific | Medium term (2 to 4 years) |
| Hydrogen Asset Monitoring | +1.2% | Europe, Asia Pacific, Middle East | Long term (4 years or more) |
| Emerging Market Localization | +1.0% | Asia Pacific, Latin America, Africa | Medium term (2 to 4 years) |
Sensing Analytics Subscriptions
Analytics subscriptions remain an underused opportunity in the fibre optic sensors market, as most deployments are still sold mainly through hardware and project engineering. The IEA projects data-centre electricity consumption to increase from about 415 TWh in 2024 to nearly 945 TWh by 2030, increasing demand for continuous thermal and power monitoring.
ITU also estimated around 1.5 billion fixed broadband subscriptions in 2024, supporting wider remote-monitoring networks. The European Commission aims to provide gigabit connectivity to all households by 2030, supporting greater use of edge analytics and connected asset monitoring.
Shifting from one-time equipment sales toward multi-year monitoring subscriptions could improve lifetime gross margins by an estimated 10%–20% and reduce inspection costs per monitored asset by around 15%–25%. At scale, this model could add up to +2.2% upside above the market’s 10.5% baseline CAGR.
Key Players Analysis
The Fibre Optic Sensors Market has three clear competitive tiers, although reliable company-level market-share percentages are not publicly available because most diversified companies do not report fibre optic sensor revenue separately. Tier 1 leaders include Sumitomo Electric, ABB, and Yokogawa, supported by broad optical, industrial, and automation businesses.
Sumitomo Electric generated ¥595.1 billion in FY2024 Infocommunications sales from activities including optical-fibre cables, telecom equipment, fusion splicers, and optical and electronic devices. ABB reported USD 32.9 billion in 2024 revenue and invested about 4.5% of sales, or nearly USD 1.4 billion, in non-order-related R&D. Yokogawa spent ¥32.4 billion in FY2024 on R&D, equal to 5.7% of sales, supporting stronger integration of fibre sensing with process automation and asset-management systems.
Tier 2 specialists and challengers include Luna Innovations, OmniSens, and Althen, which compete through specialized sensing technologies and customized project solutions. Luna expanded its distributed sensing capabilities through the Silixa acquisition, involving USD 21.5 million in upfront cash and up to USD 16.5 million in performance-based earn-outs, supported partly by a USD 50 million strategic investment from White Hat Capital.
Luna’s 2022 and certain 2023 financial statements were later considered unreliable due to revenue-recognition issues. Finisar is no longer an independent competitor, as II-VI completed its acquisition in 2019 for approximately USD 2.9 billion.
Top Key Players in the Market
- Finisar Corporation
- Yokogawa Electric Corporation
- Althen
- Luna Innovations Incorporated
- OmniSens S.A.
- Sumitomo Electric Industries Ltd.
- ABB Ltd.
Recent Developments
- In 2026, Sumitomo Electric, AFL, Corning, and TeraHop announced the SDM4 MCF Multi-Source Agreement in March to develop common requirements for a four-core multicore fibre design for AI data-centre networks. The technology is designed for short-reach optical connections operating in the O-band between 1,260 nm and 1,360 nm, supporting higher-density and interoperable fibre infrastructure.
- In 2026, Sumitomo Electric secured an approximately EUR 2 billion EPC contract from Amprion for Germany’s DC35 project in May. The project covers a 530-km, 525-kV HVDC cable route with 2-GW rated capacity. Sumitomo Electric also established Sumitomo Electric Power Cable (Europe) GmbH and is investing approximately EUR 90 million to expand production capacity at Südkabel in Germany.
Report Scope
| Report Features | Description |
|---|---|
| Market Value (2025) | USD 4.5 Billion |
| Forecast Revenue (2035) | USD 12.3 Billion |
| CAGR (2026-2035) | 10.5% |
| Base Year for Estimation | 2025 |
| Historic Period | 2020-2024 |
| Forecast Period | 2026-2035 |
| Report Coverage | Revenue Forecast, Market Dynamics, Competitive Landscape, Recent Developments |
| Segments Covered | By Type (Intrinsic, Extrinsic), By Component (Fiber optic cable, Receiver, Transmitter, Optical amplifier), By End-User (Industrial, Transportation, Medical, Defense, Oil and gas) |
| Regional Analysis | North America – US, Canada; Europe – Germany, France, The UK, Spain, Italy, Rest of Europe; Asia Pacific – China, Japan, South Korea, India, Australia, Singapore, Rest of APAC; Latin America – Brazil, Mexico, Rest of Latin America; Middle East & Africa – GCC, South Africa, Rest of MEA |
| Competitive Landscape | Finisar Corporation, Yokogawa Electric Corporation, Althen, Luna Innovations Incorporated, OmniSens S.A., Sumitomo Electric Industries Ltd., ABB Ltd. |
| Customization Scope | Customization for segments, region/country-level will be provided. Additional customization can be done based on requirements. |
| Purchase Options | We have three licenses to opt for: Single User License, Multi-User License (Up to 5 Users), Corporate Use License (Unlimited Users and Printable PDF) |





























