Report Overview
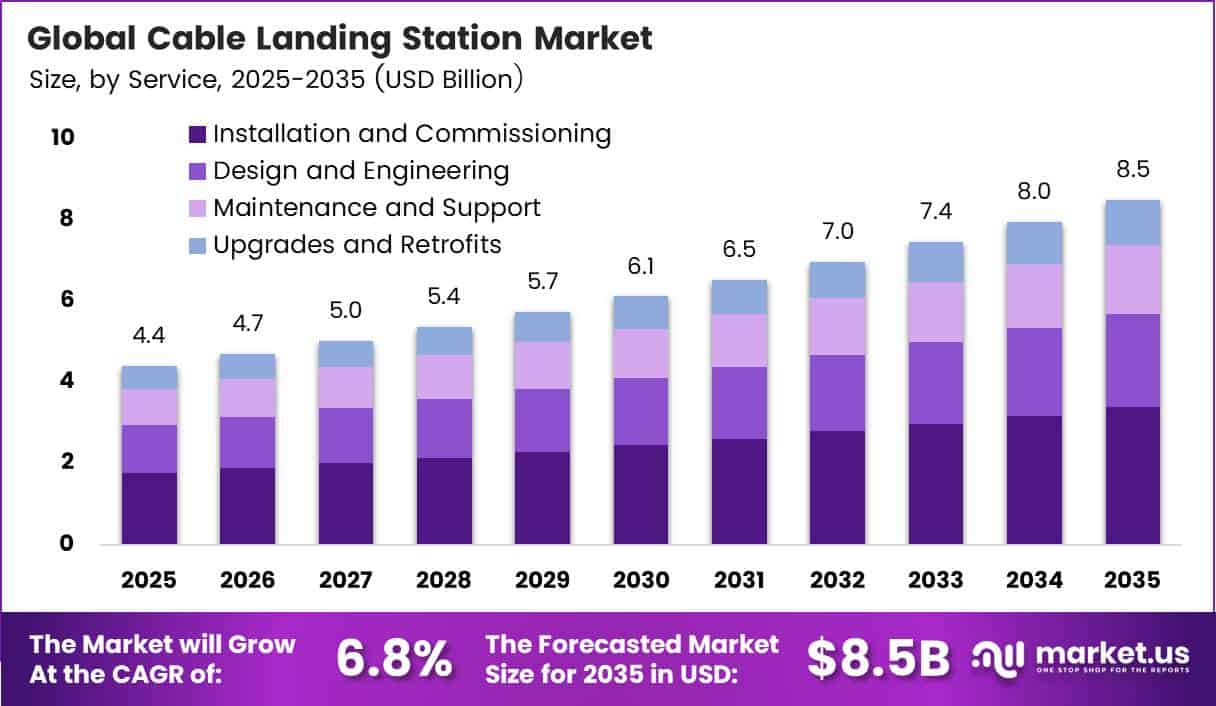
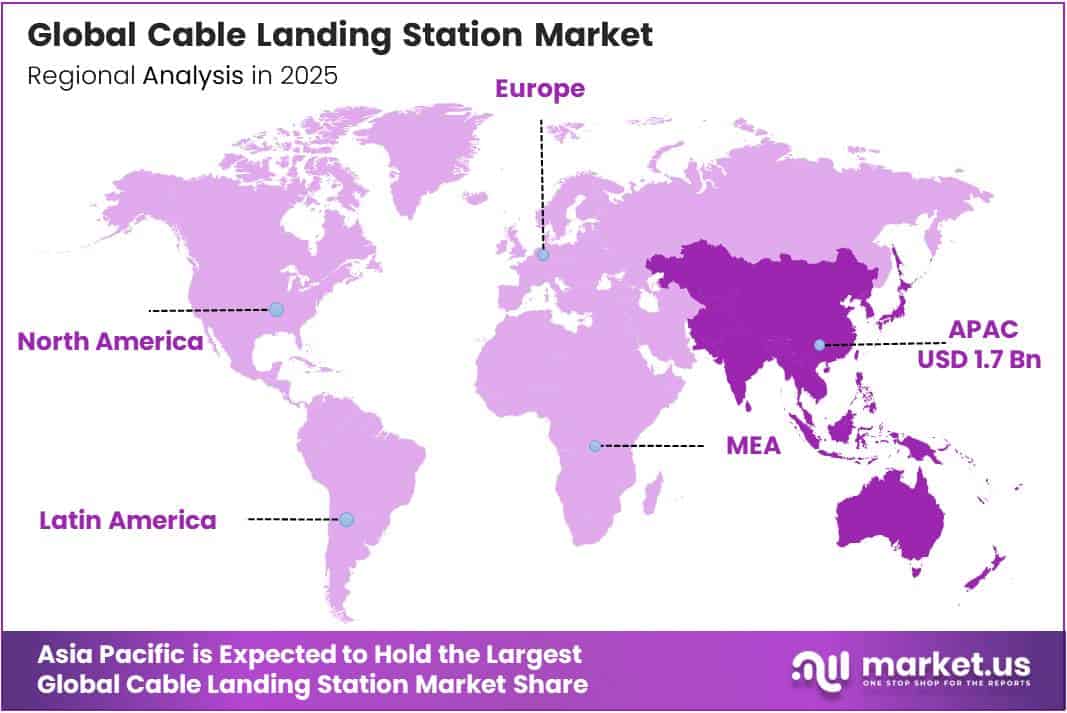
In 2025, the Global Cable Landing Station Market was valued at USD 4.4 billion. The market is projected to grow at a CAGR of 6.8% during 2026–2035, reaching approximately USD 8.5 billion by 2035. Asia-Pacific dominated the global market in 2025, accounting for more than 37.9% of the total market share and generating approximately USD 1.7 billion in revenue.
More internet users drive this growth. According to the ITU, about 6 billion people used the internet in 2025, up from 5.8 billion in 2024. That is about 74% of the world’s population. The ITU also reported that 1.3 billion people came online between 2020 and 2025.
Each new user adds traffic to the subsea cables, and every cable needs a landing station to link it to land networks. Operators also need new landing stations because 2.2 billion people remain offline, mostly in low- and middle-income countries.
The Asia-Pacific region is dominating the market. Big network investments keep the region in front. Google plans to spend USD 1 billion to expand its trans-Pacific cable network between the US and Japan. KT plans to put about KRW 1 trillion into submarine cables by 2031.
SK Broadband, SoftBank, and Verizon are building a 12,500 km cable that links South Korea, the US, Japan, and Taiwan. They aim to finish it in 2028. Dreamline will spend about KRW 34 billion on a new landing station in Saemangeum, South Korea. These projects create steady demand for terminal, power feeding, and monitoring equipment across the region.
Key Takeaways
- The Cable Landing Station Market reached USD 4.4 billion in 2025 and should hit USD 8.5 billion by 2035. at a CAGR of 6.8% from 2026 to 2035.
- By component, Submarine Line Terminal Equipment leads with a 33.0% share.
- By service, Installation and Commissioning leads with a 46.5% share.
- By ownership type, Consortium-Owned Systems lead with a 45.8% share.
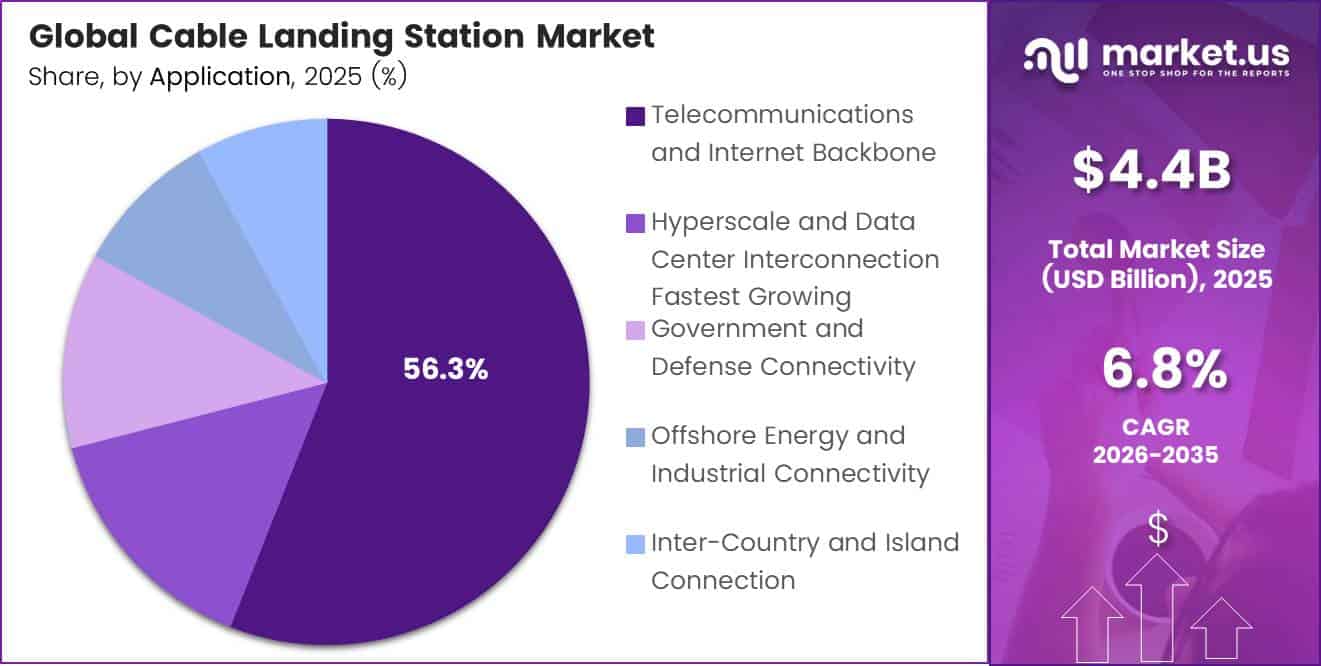
- By application, Telecommunications and Internet Backbone lead with a 56.3% share.
- Asia-Pacific leads with a 37.9% share and USD 1.7 billion in revenue.
By Component
Submarine Line Terminal Equipment dominates with 33.0% due to its core role in lighting capacity.
Submarine Line Terminal Equipment (SLTE) leads because every landing station needs it to send and receive light signals across the ocean. Operators spend the most on SLTE because it decides how much data a cable can carry. When cable routes grow, demand for this gear grows too.
The International Cable Protection Committee reports that global subsea cable length rose from 1 million km in 2014 to about 1.7 million km in 2025. Every new route ends at a station that needs new terminal gear. Owners of older stations also install new SLTE to push more data through the fibre they already have.
Monitoring and Control Equipment is growing fastest because operators now want to catch problems before service goes down. ITU says the ICPC logged more than 170 cable repairs worldwide in 2025, which is close to 4 failures every week. Each outage costs money and customer trust.
By Service
Installation and Commissioning dominates with 46.5% due to a steady pipeline of new builds.
Installation and Commissioning holds the largest share because every new cable needs a landing station that is built, wired, tested, and brought online. This work covers civil construction, power systems, and testing crews, so each project costs a lot.
ITU estimates that more than 500 active and planned telecom submarine cable systems spanned the globe as of 2024. Many of the planned systems still need landing work, which keeps installers busy in Asia, Africa, and Europe. Vendors also earn money setting up branch stations when cables add links to new countries.
Upgrades and Retrofits are rising fastest because owners want more capacity without laying new cable. Meta says some of its newest systems use 24 fiber pairs, while other new builds typically use 8 to 16. When these high-capacity cables reach shore, older stations need new power units, cooling, and terminal gear to keep up.
By Ownership Type
Consortium-Owned Systems dominate with 45.8% due to shared build costs across carriers.
Consortium-Owned Systems lead because one cable can cost hundreds of millions of dollars, and splitting that cost lowers the risk for each partner. Carriers from different countries also bring their own landing rights and local permits, which speeds up approvals.
Meta shows how strong this model still is. The company says it has worked with partners over the past decade to build more than 20 subsea cables. In a shared build, each member buys only the capacity it needs, and the group splits the costs of marine surveys, cable laying and stations.
Single-Owner Systems are growing fastest because cloud companies want full control over routes, capacity and the timing of upgrades. Meta’s Project Waterworth will stretch more than 50,000 km and reach 5 major continents, which will make it the longest subsea cable project in the world. Owning a cable alone lets a company place landing stations close to its own data centers.
By Application
Telecommunications and Internet Backbone dominates with 56.3% due to carrier demand for global traffic.
Telecommunications and Internet Backbone holds the top share because carriers still send most of the world’s voice, mobile, and internet traffic over subsea links. National operators run many landing stations and treat them as core assets.
The 2Africa system shows how great this demand is. It covers about 45,000 km, lands at 46 sites, and can reach a population of nearly 3 billion people. Telecom partners use these landing points to carry traffic into national backbones and mobile networks across three continents.
Hyperscale and Data Center Interconnection is growing fastest because cloud and AI companies need huge bandwidth between their server farms. Google’s Grace Hopper cable carries about 352 Tbps over 16 fiber pairs linking the US, UK, and Spain. Its Firmina cable runs about 14,500 km from the US to Argentina. Cloud companies now place landing stations near data center clusters to cut delay and transit costs.
Key Market Segments
By Component
- Submarine Line Terminal Equipment
- Power Feeding Equipment
- Monitoring and Control Equipment
- Protection Equipment
- Other Components
By Service
- Installation and Commissioning
- Design and Engineering
- Maintenance and Support
- Upgrades and Retrofits
By Ownership Type
- Consortium-Owned Systems
- Single-Owner Systems
- Carrier-Neutral Landing-Party Model
- Government and Development-Bank-Backed Systems
By Application
- Telecommunications and Internet Backbone
- Hyperscale and Data Center Interconnection
- Government and Defense Connectivity
- Offshore Energy and Industrial Connectivity
- Inter-Country and Island Connection
Geopolitical Impact Analysis
Red Sea attacks are disrupting the shipping that cable projects rely on. UNCTAD reported that by early May 2025, ships moving through the Suez Canal still carried 70% less tonnage than the 2023 average. Many ships now sail around the Cape of Good Hope instead. A trip that once took days through the Red Sea now takes weeks. Landing station builders feel this delay.
Longer routes also add to cost. UNCTAD found that ton-miles grew 5.9% in 2024, almost three times faster than the 2.2% growth in trade volume. UNCTAD also expected world maritime trade to grow just 0.5% in 2025. Freight rates swing sharply from month to month. This makes it hard for suppliers to give fixed quotes for heavy power feeding equipment and protection hardware.
Chokepoint risk is growing as well. UNCTAD notes that 11% of global trade and a third of seaborne oil pass through the Strait of Hormuz. Gulf landing stations sit close to this route. Owners now plan for backup routes and extra spare parts, which raises their upfront spending.
Governments want more control over cable assets. The French State bought Alcatel Submarine Networks for an enterprise value of EUR 350 million. Security rules like this push buyers toward trusted suppliers. They also split vendor choices along political lines.
Regional Analysis
Asia-Pacific dominates the Cable Landing Station Market, holding a 37.9% share and generating USD 1.7 billion in revenue. The region connects the world’s busiest digital economies. China, Japan, and South Korea host dense clusters of landing sites. Singapore serves as a key hub for intra-Asian routes. New systems keep adding capacity.
The SX Tasman Express cable will link Sydney and Auckland with 400 terabits of capacity over 16 fibre pairs. ASN supplies its Open Cable design, and OMS Group handles marine work. The project also leaves room for a second Australian landing. India keeps adding new cables to meet its fast-growing data demand.
North America is the fastest-growing region in the Cable Landing Station Market. Hyperscalers drive most of this growth. Meta plans PETAL, a cable of about 7,000 km between the US and France. It should carry 1 petabit per second and open in 2029. Operators also plan new landing points. The MANTA system will add sites in Veracruz, Mexico, and San Blas, Florida.
Europe acts as a key hub between North America, Africa, and Asia. France, the UK, Italy, and Spain host major landing clusters. The French State took majority ownership of ASN in 2024, which shows how much the region values subsea supply.
Key Regions and Countries
North America
- US
- Canada
Europe
- Germany
- France
- The UK
- Spain
- Italy
- Rest of Europe
Asia Pacific
- China
- Japan
- South Korea
- India
- Australia
- Rest of APAC
Latin America
- Brazil
- Mexico
- Rest of Latin America
Middle East and Africa
- GCC
- South Africa
- Rest of MEA
Market Dynamics
Drivers
| Driver | (~) % Impact on CAGR Forecast | Geographic Relevance | Impact Timeline |
|---|---|---|---|
| Hyperscaler-Funded Subsea Cable Buildout | +2.1% | Global, led by North America, Asia-Pacific | Short term (2 years or less) |
| AI Data Center Interconnect Demand | +1.6% | North America, Europe, Middle East | Short term (2 years or less) |
| Route Diversity Mandates for Resilience | +1.1% | Europe, Red Sea, South China Sea | Medium term (2 to 4 years) |
| Africa and Pacific Island Connectivity Programs | +0.8% | Africa, Oceania | Medium term (2 to 4 years) |
| Open Cable and SDM Fiber Upgrades | +0.6% | Global | Short term (2 years or less) |
Hyperscaler-Funded Subsea Cable Buildout
Content providers have shifted from leasing capacity on consortium cables to owning cables, and that shift has changed how cable landing stations are built and paid for. According to TeleGeography-style industry tracking echoed in SubOptic association briefings, hyperscalers now account for roughly 65% to 70% of used international bandwidth.
Per Meta and Alphabet investor disclosures, projects such as Meta’s roughly 50,000 km Project Waterworth (announced in 2025) and Google’s Umoja and Nuvem systems put new landing sites in Africa, the Atlantic and the Indian Ocean.
As reflected in Alphabet and Microsoft earnings calls, combined hyperscaler CapEx guidance exceeded USD 300 billion for 2025, and a fraction of that now funds dedicated landing infrastructure. The commercial result is that landing stations are moving away from a carrier-owned, cost-shared consortium model.
Restraints
| Restraint | (~) % Impact on CAGR Forecast | Geographic Relevance | Impact Timeline |
|---|---|---|---|
| Geopolitical Landing License Bans and Security Reviews | -1.4% | United States, China, South China Sea, India | Short term (2 years or less) |
| Protracted Coastal and Environmental Permitting | -0.9% | Europe, North America, Southeast Asia | Medium term (2 to 4 years) |
| High Upfront CapEx and Elevated Financing Costs | -0.7% | Emerging markets, Africa, Latin America | Short term (2 years or less) |
| Conflict-Zone Route Suspensions | -0.5% | Red Sea, Baltic Sea, Middle East | Short term (2 years or less) |
| Scarcity of Viable Coastal Land Parcels | -0.3% | Singapore, Japan, Western Europe | Long term (4 years or more) |
Geopolitical Landing License Bans and Security Reviews
Landing stations increasingly fall under national-security screening, and that can halt projects outright. Per the US Federal Communications Commission’s 2025 submarine cable rulemaking, licensees connected to foreign adversaries are presumptively barred, and Team Telecom reviews can run beyond 120 days.
According to Indian Department of Telecommunications and Ministry of Home Affairs clearance procedures, permits for foreign repair vessels and landing stations can add 6 to 18 months. Per the International Cable Protection Committee, cable faults now run at roughly 150 to 200 a year, which pushes regulators toward tighter control of repair and landing operations.
In practice, rerouted systems drop or delay planned landings, which pushes station CapEx back by 1 to 3 years. It also strands pre-built civil works and adds an estimated 10% to 20% to project costs through redesigned routes.
Challenges
| Challenge | (~) % CAGR Friction Drag | Geographic Relevance | Mitigation Horizon |
|---|---|---|---|
| Cable Ship Repair Capacity Shortage | -0.8% | Global, acute in Asia-Pacific, Africa | Long term (4 years or more) |
| Concentrated Subsea Equipment Supply | -0.6% | Global | Medium term (2 to 4 years) |
| Grid Power Availability Constraints | -0.5% | Europe, North America, Southeast Asia | Medium term (2 to 4 years) |
| Physical and Cyber Sabotage Risk | -0.4% | Baltic Sea, Taiwan Strait, Red Sea | Short term (2 years or less) |
| Specialized Marine Engineering Talent Gaps | -0.3% | Global | Long term (4 years or more) |
Cable Ship Repair Capacity Shortage
The global cable-ship fleet is old and too small for the growing amount of cable on the seabed. That makes long repair windows a risk to landing station uptime and the service levels promised to tenants. Per International Cable Protection Committee data, there are only about 60 to 80 cable-ship assets worldwide, and many are more than 25 years old.
Meanwhile, per UN Environment Programme and ICPC estimates, more than 550 active systems serve the network. According to NATO maritime briefings and the European Commission’s 2025 cable security action plan, repairs in congested areas can take 2 to 8 weeks.
This shortage does not stop current sales, but it caps premium resilience pricing and forces operators to over-provision diverse landings. In response, firms are co-investing in vessels, signing pooled maintenance agreements, and allocating an estimated 5% to 8% of lifecycle OpEx to redundancy.
Opportunities
| Opportunity | (~) % Potential CAGR Upside | Geographic Relevance | Execution Window |
|---|---|---|---|
| Landing Station Co-Located Edge Data Centers | +1.5% | India, Southeast Asia, Africa, Southern Europe | Medium term (2 to 4 years) |
| Offshore Wind and Power Interconnector Convergence | +0.9% | North Sea, Baltic Sea, East Asia | Long term (4 years or more) |
| SMART Sensing Cable Monetization | +0.6% | Pacific, Mediterranean | Long term (4 years or more) |
| Neutral-Host Station Roll-Up Platforms | +0.5% | Europe, Asia-Pacific | Short term (2 years or less) |
| Arctic and Polar Route Landings | +0.3% | Arctic, Nordics, Japan, Alaska | Long term (4 years or more) |
Landing Station Co-Located Edge Data Centers
Most landing stations still work as single-purpose transit facilities. They backhaul traffic to inland hubs 50 to 300 km away instead of hosting compute directly at the shore. That is why converging the cable landing station with the data center is still white space rather than a current driver.
According to Uptime Institute operator surveys, putting compute at the landing point can remove 10 to 25% of backhaul costs and 2 to 5 ms of latency. Per IEA energy-for-AI analysis, data center electricity demand could roughly double by 2030, which favors shore sites with renewable power.
If operators move from a pure transit model to a colocation-and-interconnection model, EBITDA margins could rise from about 30% to between 45% and 55%. Revenue per rack could also rise by an estimated 20% to 35%.
Key Players Analysis
Tier 1 leaders include Alcatel Submarine Networks, SubCom, NEC, and HMN Tech. These firms design, build, and install full cable systems from end to end. ASN changed hands in a major deal. The French State bought a majority stake for an enterprise value of EUR 350 million, and Nokia kept 20% with a seat on the board.
SubCom remains the main US system builder. In 2025, it won the full supply contract for Norway’s Arctic Way system and the design and install contract for MANTA. Both wins strengthen its position in polar and Americas routes.
Tier 2 challengers focus on terminal gear and optical gear. Ciena earned USD 4.77 billion in revenue in fiscal 2025, up 18.8%. It spent USD 744.2 million on R&D that year, up from USD 674.7 million. Nokia bought Infinera for an enterprise value of USD 2.3 billion, at USD 6.65 per share, and closed the deal in February 2025. This move gives Nokia stronger optical tools for data center links.
Prysmian, Nexans, Sumitomo Electric, Hengtong, Fujitsu, Xtera, and Global Marine compete in cable supply, marine services, and equipment. Prysmian committed about EUR 350 million to two new cable-laying ships. Ships like these support installation and repair work at landing stations.
Top Key Players in the Market
- Alcatel Submarine Networks SAS
- SubCom, LLC
- Huawei Marine Networks Co., Ltd.
- NEC Corporation
- Fujitsu Limited
- Nokia Corporation
- Ciena Corporation
- Xtera Limited
- Global Marine Systems Limited
- Prysmian S.p.A.
- Nexans S.A.
- Sumitomo Electric Industries, Ltd.
- Hengtong Optic-Electric Co., Ltd.
Recent Developments
- In February 2025, Nokia Corporation closed its purchase of Infinera Corporation for an enterprise value of USD 2.3 billion, at USD 6.65 per share.
- In March 2025, SubCom, LLC won the contract to design, make, and install the MANTA cable system. The system adds new landing points in Veracruz, Mexico, and San Blas, Florida, and links 4 major data hubs.
- In June 2025, Alcatel Submarine Networks signed the SX Tasman Express contract with Southern Cross and OMS Group. The cable will link Sydney and Auckland with 400 terabits of capacity over 16 fibre pairs.
- In September 2026, Meta announced PETAL, a 7,000 km cable between the US and France. It will carry 1 petabit per second and should open in 2029.
Report Scope
| Report Features | Description |
|---|---|
| Market Value (2025) | USD 4.4 Billion |
| Forecast Revenue (2035) | USD 8.5 Billion |
| CAGR (2026-2035) | 6.8% |
| Base Year for Estimation | 2025 |
| Historic Period | 2020-2024 |
| Forecast Period | 2026-2035 |
| Report Coverage | Revenue Forecast, Market Dynamics, Competitive Landscape, Recent Developments |
| Segments Covered | By Component (Submarine Line Terminal Equipment, Power Feeding Equipment, Monitoring and Control Equipment, Protection Equipment, Other Components); By Service (Installation and Commissioning, Design and Engineering, Maintenance and Support, Upgrades and Retrofits); By Ownership Type (Consortium-Owned Systems, Single-Owner Systems, Carrier-Neutral Landing-Party Model, Government and Development-Bank-Backed Systems); By Application (Telecommunications and Internet Backbone, Hyperscale and Data Center Interconnection, Government and Defense Connectivity, Offshore Energy and Industrial Connectivity, Inter-Country and Island Connection) |
| Regional Analysis | North America – US, Canada; Europe – Germany, France, The UK, Spain, Italy, Rest of Europe; Asia Pacific – China, Japan, South Korea, India, Australia, Singapore, Rest of APAC; Latin America – Brazil, Mexico, Rest of Latin America; Middle East & Africa – GCC, South Africa, Rest of MEA |
| Competitive Landscape | Alcatel Submarine Networks SAS, SubCom, LLC, Huawei Marine Networks Co., Ltd., NEC Corporation, Fujitsu Limited, Nokia Corporation, Ciena Corporation, Xtera Limited, Global Marine Systems Limited, Prysmian S.p.A., Nexans S.A., Sumitomo Electric Industries, Ltd., Hengtong Optic-Electric Co., Ltd. |
| Customization Scope | Customization for segments, region/country-level will be provided. Moreover, additional customization can be done based on the requirements. |
| Purchase Options | We have three licenses to opt for: Single User License, Multi-User License (Up to 5 Users), Corporate Use License (Unlimited Users and Printable PDF) |