Report Overview
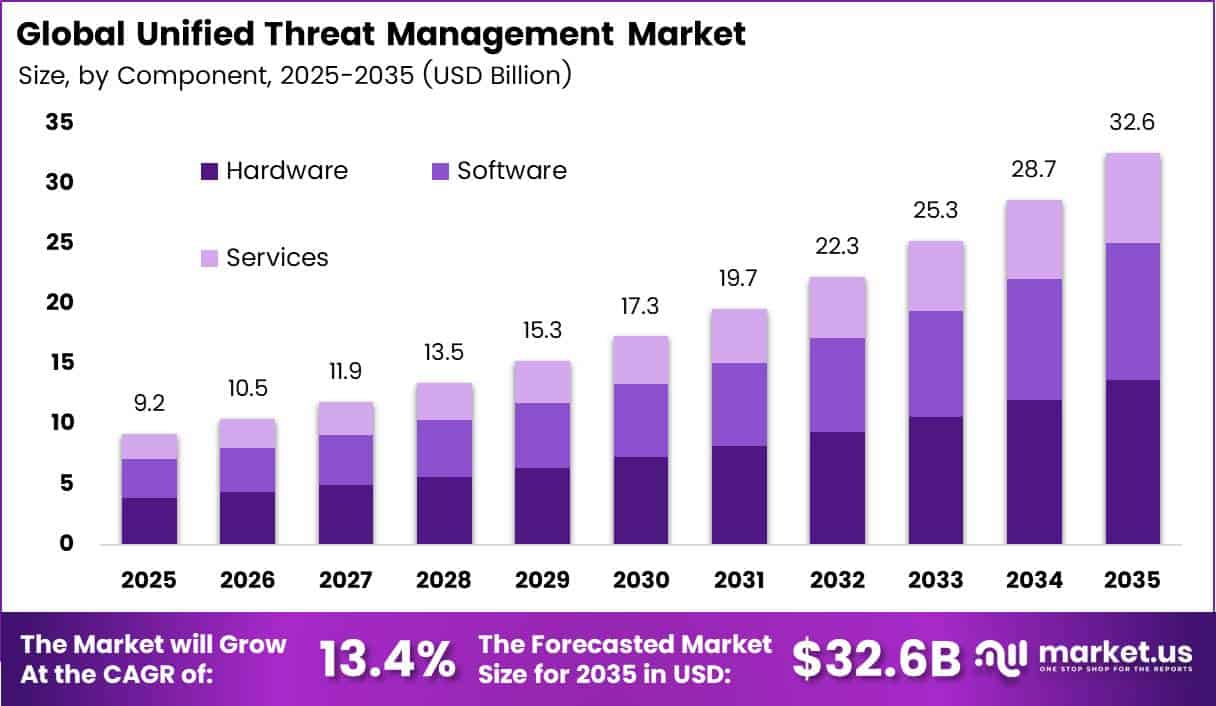
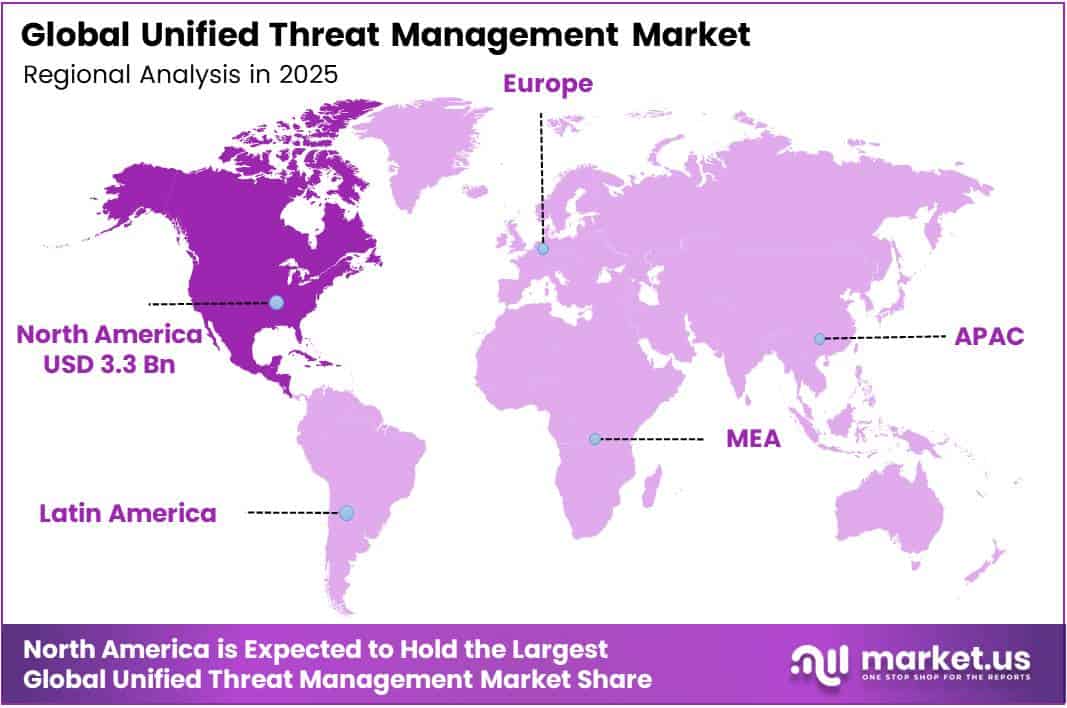
In 2025, the Global Unified Threat Management Market was valued at USD 9.2 billion. The market is projected to grow at a CAGR of 13.4% during 2026–2035, reaching approximately USD 32.6 billion by 2035. North America dominated the global market in 2025, accounting for more than 36.0% of the total market share and generating approximately USD 3.3 billion in revenue.
A unified threat management (UTM) system puts the firewall, intrusion prevention, antivirus, VPN, and web filtering into one device or cloud service. That makes it a good fit for firms with small IT teams. Demand rises as more people and firms go online. The ITU reported that about 6 billion people used the internet in 2025, or about 74% of the world population. Cyber losses keep pushing buyers to act.
The FBI Internet Crime Complaint Center logged 859,532 complaints in 2024, with reported losses of USD 16.6 billion, up 33% from 2023. Each new connected branch, store or clinic needs a gateway that can block threats at the edge. This steady link between digital growth and attack volume drives UTM spending in every industry.
The North America region has a dense base of small firms that buy all-in-one security tools. The US Small Business Administration counts about 34.8 million small businesses, and they employ about 46% of private sector workers. Strict rules also drive spending. The SEC now requires public firms to disclose material cyber incidents within 4 business days.
Key Takeaways
- The Unified Threat Management Market reached USD 9.2 billion in 2025 and will reach USD 32.6 billion by 2035. grow at a CAGR of 13.4% from 2026 to 2035.
- By component, Hardware leads with a 42.0% share.
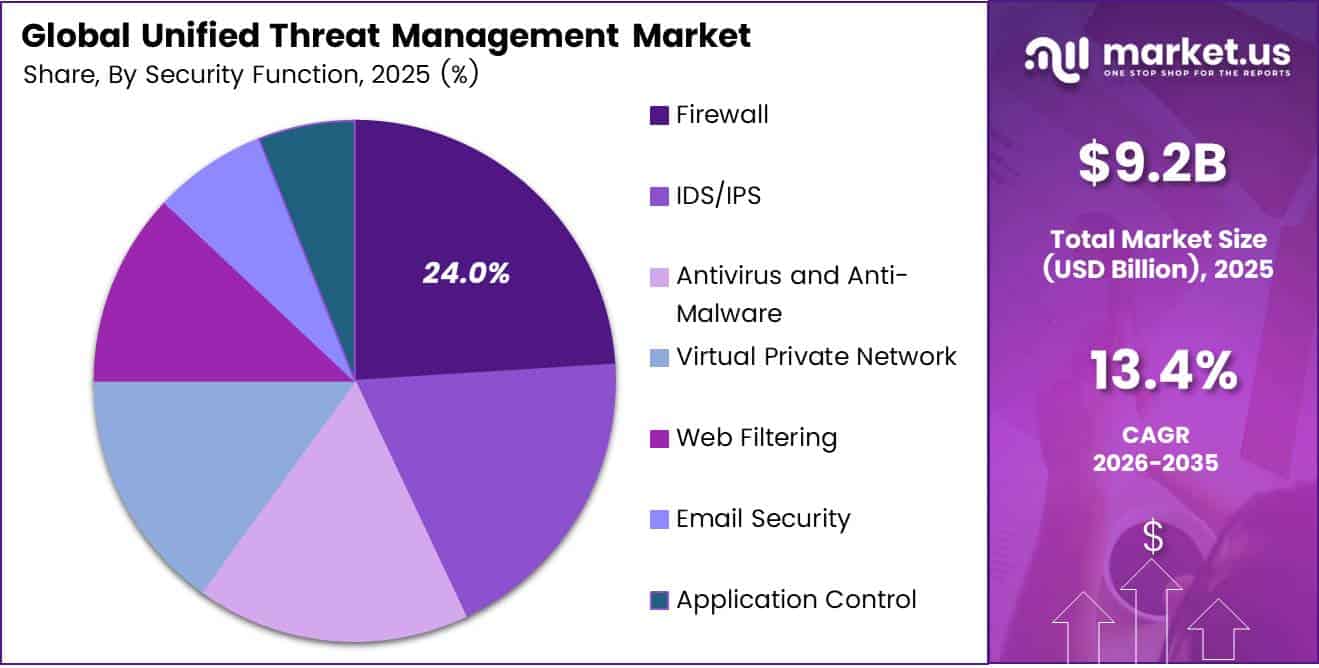
- By security function, Firewall leads with a 24.0% share.
- By deployment mode, On-Premises leads with a 38.0% share.
- By organization size, Small and Medium-Sized Enterprises (SMEs) lead with a 58.0% share.
- By end-use industry, Banking, Financial Services, and Insurance (BFSI) leads with a 20.0% share.
- North America leads with a 36.0% share and USD 3.3 billion in revenue.
By Component
Hardware dominates with 42.0% due to dedicated appliances delivering fast threat inspection.
Hardware leads because most firms still run UTM on a physical box at the edge of their network. These appliances use custom chips that scan traffic without slowing users down. Fortinet, a top UTM vendor, grew product revenue by 16% to $2.22 billion in 2025, and its annual filing credits much of that growth to secure networking hardware.
Buyers also replace their boxes every few years, which keeps hardware demand steady. In Q4 2025, Fortinet reported that hardware and software each grew about 20%, helped by technology upgrades, upselling, and new use cases.
Services, led by Managed Services, are growing the fastest. Many small firms have no security staff, so they hire outside experts to watch their networks every day. Fortinet’s service revenue reached $4.58 billion, or 67% of total revenue, and its service billings rose 18% in Q4 2025. Subscriptions for threat updates, SASE, and SecOps tools drive this shift.
By Security Function
Firewall dominates with 24.0% due to the firewall serving as the first network defense.
Firewall leads because every UTM deployment starts with it. The firewall decides which traffic comes into the network and which goes out, and all other tools sit on top of it. Fortinet says it holds a 55% unit share of firewall shipments worldwide, which shows how central firewall boxes are to UTM buying.
More internet users also means more traffic to filter. ITU reports that 6 billion people were online in 2025, and more than 240 million came online in that year alone. Each new user and device adds load that firewalls have to inspect.
Data Loss Prevention (DLP) is growing the fastest because staff now paste sensitive data into AI tools and cloud apps. IBM found that 63% of breached organizations had no AI governance policy, and heavy “shadow AI” use added about $670,000 to the average breach cost. DLP blocks private files, customer records, and source code from leaving the network.
By Deployment Mode
On-Premises dominates with 38.0% due to strict data control and sovereignty needs.
On-premises leads because banks, governments, and factories want security tools they own and control. Local boxes keep sensitive traffic inside the building and help meet data sovereignty rules. Fortinet’s product revenue jumped 52% to $773 million in Q2 2026, and it launched the FortiGate 1200G series to meet sovereignty and AI infrastructure needs.
Cloud-Based UTM is growing the fastest as more business tools move online. Eurostat reports that 52.74% of EU enterprises used paid cloud services in 2025, up 7.42 percentage points from 2023. Large enterprises adopt the cloud even more, at 84.67%. Remote staff, branch offices, and SaaS apps now sit outside the old network edge.
By Organization Size
Small and Medium-Sized Enterprises (SMEs) dominate with 58.0% due to the need for affordable all-in-one security.
SMEs lead because they make up most businesses in the world. The World Bank says SMEs account for about 90% of all businesses and more than 50% of global jobs. Most of these firms cannot afford many separate security products, so a single UTM box that covers firewall, antivirus, and VPN fits their budget well.
Small firms also lack IT teams. In the EU, about 83% of the 1.53 million enterprises in Eurostat’s survey frame are small businesses with only 10–49 employees. One simple dashboard lets a single manager run security for the whole firm.
Large Enterprises are growing the fastest because their breach losses keep rising. IBM reports that the average US breach cost hit a record $10.22 million, up 9%. Big firms run hundreds of branch sites, and UTM gives each branch the same protection at a lower cost. They are also merging separate tools into unified platforms to cut vendor sprawl and licensing costs.
By End-Use Industry
Banking, Financial Services, and Insurance (BFSI) dominates with 20.0% due to high-value payment and customer identity data.
BFSI leads because banks and insurers hold money, card data, and personal records that attackers want. IBM places the average financial-sector breach at $5.56 million, the second highest among the 17 industries it studied. Regulators also require layered defenses, so banks put UTM in every branch and data center.
Healthcare is growing the fastest as hospitals connect more devices and move records online. IBM found that healthcare had the highest breach cost for the 12th year in a row, at $7.42 million per incident. Healthcare firms also needed 279 days on average to find and contain a breach, the longest of any sector. Ransomware can shut down surgery schedules and patient care.
Key Market Segments
By Component
- Hardware
- Software
- Services
- Professional Services
- Managed Services
By Security Function
- Firewall
- Intrusion Detection and Prevention Systems (IDS/IPS)
- Antivirus and Anti-Malware
- Virtual Private Network (VPN)
- Web Filtering
- Email Security
- Application Control
- Data Loss Prevention (DLP)
By Deployment Mode
- On-Premises
- Cloud-Based
- Hybrid
By Organization Size
- Small and Medium-Sized Enterprises (SMEs)
- Large Enterprises
By End-Use Industry
- Banking, Financial Services, and Insurance (BFSI)
- IT and Telecommunications
- Healthcare
- Government and Public Sector
- Retail and E-commerce
- Manufacturing
- Education
- Others
Geopolitical Impact Analysis
US and China trade tensions hit UTM hardware first. UTM appliances use chips, memory, circuit boards, and metal cases, and many of these come from East Asia. In January 2025, the US raised Section 301 tariffs on Chinese semiconductors to 50%, up from 25%. The WTO reported that new trade barriers in 2025 covered a much larger share of world goods trade. Vendors that build firewall boxes in China now face higher costs per unit and move assembly to Taiwan, Vietnam, Mexico and India.
Shipping disruption adds time and cost. UNCTAD reported that Red Sea attacks cut Suez Canal transits by more than 50%. Ships that reroute around the Cape of Good Hope add about 10 to 14 days to Asia-to-Europe trips. The World Shipping Council noted that container lines added extra ships to keep schedules. For UTM vendors, this means longer lead times for appliances and more stock held in regional warehouses.
Commodity prices also move costs. The World Bank reported that copper prices passed USD 10,000 per ton in 2025, which raises the cost of boards and power parts. The IEA warned that China controls more than 90% of gallium and graphite refining, and both feed electronics supply chains. Export limits on these materials put more pressure on the chip supply behind security appliances.
The IMF estimated world trade growth at about 3%, below the long-run average. Slow trade and high tariffs push buyers toward cloud-delivered and virtual UTM, which needs less imported hardware. This shift supports software and managed services as hardware margins shrink.
Regional Analysis
North America dominates the Unified Threat Management Market, holding a 36.0% share and generating USD 3.3 billion in revenue. The US drives most of this demand. CISA leads federal efforts to defend networks, and the CHIPS and Science Act set aside about USD 52.7 billion for chip work at home, which supports local security hardware supply.
US federal agencies plan more than USD 13 billion a year for civilian cyber programs. Health providers face heavy pressure too. The HHS Office for Civil Rights tracked breaches that affected more than 275 million health records in 2024. Banks follow strict FFIEC and state rules, such as the New York DFS cyber rule, and these rules require layered network controls.
Asia Pacific is the fastest-growing region in the Unified Threat Management Market. China, Japan, and South Korea build the hardware and invest heavily in network security. India adds scale. Its Digital India program and over 900 million internet users create huge demand from small firms. Australia plans to spend about AUD 587 million under its 2023 to 2030 Cyber Security Strategy.
Europe holds a solid position driven by regulation. The NIS2 Directive covers about 160,000 entities across the EU and allows fines of up to EUR 10 million or 2% of global turnover. GDPR keeps data loss prevention a priority. Germany, France and the UK lead spending, while Spain and Italy grow through programs funded by the EU Recovery Fund. Sophos, ESET and Avast give the region strong local vendors.
Key Regions and Countries
North America
- US
- Canada
Europe
- Germany
- France
- The UK
- Spain
- Italy
- Rest of Europe
Asia Pacific
- China
- Japan
- South Korea
- India
- Australia
- Rest of APAC
Latin America
- Brazil
- Mexico
- Rest of Latin America
Middle East and Africa
- GCC
- South Africa
- Rest of MEA
Market Dynamics
Drivers
| Driver | (~) % Impact on CAGR Forecast | Geographic Relevance | Impact Timeline |
|---|---|---|---|
| SME Ransomware Exposure Escalation | +2.4% | Global | Short term (2 years or less) |
| NIS2 & DORA Compliance Mandates | +1.9% | Europe | Short term (2 years or less) |
| Firewall Hardware Refresh Cycle | +1.5% | North America, Europe | Short term (2 years or less) |
| MSSP-Led Subscription Delivery | +1.3% | North America, Asia Pacific | Medium term (2 to 4 years) |
| Branch & Retail Network Densification | +0.9% | Asia Pacific, Latin America | Medium term (2 to 4 years) |
SME Ransomware Exposure Escalation
The root cause is a structural move by attackers toward smaller organizations. Many of these firms have no dedicated security staff, so a single consolidated appliance becomes their main line of defense. FBI IC3 annual reporting recorded ransomware as the most frequently reported threat to critical infrastructure through 2024, at more than 3,000 complaints a year.
The mechanism is cost consolidation. A UTM bundle can replace three to five separate tools (firewall, IPS, gateway antivirus, web filtering and VPN), cutting per-site security spend by roughly 30–40% compared with buying each tool on its own. Earnings calls from established firewall vendors show security subscription and service revenue now making up more than 60% of total revenue.
Commercially, the business model has moved from perpetual licences to bundled subscriptions that renew every 1–3 years. This raises customer lifetime value and pushes gross margins on the service line toward 85–88%. Distributors are also reorganizing channel incentives around renewal rates rather than new appliance shipments.
Restraints
| Restraint | (~) % Impact on CAGR Forecast | Geographic Relevance | Impact Timeline |
|---|---|---|---|
| Enterprise Migration to Cloud-Native SASE | -1.2% | North America, Western Europe | Medium term (2 to 4 years) |
| SME Budget Constraints Under High Rates | -0.8% | Global | Short term (2 years or less) |
| Throughput Limits with Full Inspection | -0.6% | Global | Short term (2 years or less) |
| Procurement Bans on Foreign Vendors | -0.4% | United States, India, Europe | Short term (2 years or less) |
| Tariffs on Network Hardware | -0.3% | North America | Short term (2 years or less) |
Enterprise Migration to Cloud-Native SASE
The root cause is how network traffic now flows. With SaaS adoption and hybrid work, most user traffic no longer passes through a branch perimeter, which weakens the case for an on-premises UTM box. Eurostat enterprise ICT survey data shows that more than 45% of EU enterprises were buying cloud computing services by 2023.
The quantitative effect shows up where it matters most: large enterprise accounts. These buyers are deferring or cancelling appliance refreshes and moving 20–30% of their perimeter budgets to SASE subscriptions. Public vendor investor disclosures show SASE annual recurring revenue growing 20%+ year over year, well above the 10–12% growth in product revenue.
Challenges
| Challenge | (~) % CAGR Friction Drag | Geographic Relevance | Mitigation Horizon |
|---|---|---|---|
| Cybersecurity Talent Shortage | -1.1% | Global | Long term (4 years or more) |
| Edge Device Vulnerability Exploitation | -0.7% | Global | Medium term (2 to 4 years) |
| Semiconductor Supply Volatility | -0.5% | Asia Pacific, North America | Medium term (2 to 4 years) |
| Encrypted Traffic Inspection Complexity | -0.4% | Global | Medium term (2 to 4 years) |
| Fragmented Regional Compliance Regimes | -0.3% | Europe, Asia Pacific | Long term (4 years or more) |
Cybersecurity Talent Shortage
The structural weakness is that a UTM’s value depends on correct policy tuning, but most mid-market buyers don’t have staff who can configure IPS signatures, SSL inspection rules, and segmentation properly. ISC2 workforce study data put the global cybersecurity workforce gap at about 4.8 million professionals in 2024. Data from India’s NASSCOM and the U.S.
CISA incident analyses often trace edge breaches to default or weak configurations. When features go unused, renewal rates suffer: customers who only use basic firewall functions renew advanced bundles at rates estimated 10–15 percentage points lower. Meanwhile, U.S. BLS occupational data shows security analyst wages rising at about 4–5% a year, which raises the cost of in-house administration.
Opportunities
| Opportunity | (~) % Potential CAGR Upside | Geographic Relevance | Execution Window |
|---|---|---|---|
| OT & Industrial IoT Security Convergence | +1.8% | Asia Pacific, Middle East, Europe | Medium term (2 to 4 years) |
| Hybrid UTM-SASE Unified Platforms | +1.4% | Global | Medium term (2 to 4 years) |
| Under-Penetrated Emerging Market SMEs | +1.1% | India, Southeast Asia, Africa | Long term (4 years or more) |
| Cyber Insurance-Linked Security Bundles | +0.7% | North America, Europe | Short term (2 years or less) |
| MSSP Consolidation Roll-Ups | +0.5% | North America, Europe | Medium term (2 to 4 years) |
OT & Industrial IoT Security Convergence
CISA advisories in 2024 and 2025 flagged active exploitation of internet-exposed PLCs and water-sector controllers. The EU Cyber Resilience Act, which entered into force in December 2024, sets reporting obligations from September 2026 and full application in 2027.
The new revenue model is ruggedized, protocol-aware UTM sold with OT asset-visibility subscriptions. Following ISA/IEC 62443 zone-and-conduit segmentation, a single factory can need 10–50 enforcement points instead of the 1–2 a typical branch needs.
According to UNIDO manufacturing value-added statistics, Asia Pacific accounts for more than 50% of global industrial output, which makes the region the largest pool of demand that vendors have not yet reached.
The unit economics are attractive. Ruggedized SKUs earn price premiums of about 25–40% over equivalent IT appliances. OT threat-intelligence add-ons can lift annual subscription value per device by 15–20%. And because operational downtime costs so much, OT customers rarely switch vendors, which can add 3–5 points of blended gross margin for vendors who move early.
Key Players Analysis
Tier 1 leaders include Fortinet, Cisco, Palo Alto Networks, and Check Point. Fortinet leads in UTM units. In FY2025, it posted revenue of USD 6.80 billion, up 14%, with product revenue of USD 2.22 billion and free cash flow of USD 2.21 billion. Its own FortiASIC chips give it a cost edge in hardware.
Palo Alto Networks reported FY2025 revenue of about USD 9.2 billion. In July 2025, it agreed to buy CyberArk for about USD 25 billion to add identity security. Cisco reported FY2025 revenue of about USD 56.7 billion and keeps building on its USD 28 billion Splunk purchase. Check Point reported 2024 revenue of about USD 2.57 billion and keeps a large firewall base in Europe and Israel.
HPE moved into the top group by closing its USD 14 billion Juniper Networks deal in July 2025, which doubled its networking business. Huawei holds a strong share in China and emerging markets with its HiSecEngine firewall line.
Tier 2 challengers serve small firms and regional channels. Sophos bought Secureworks for about USD 859 million in February 2025 to expand managed detection services. WatchGuard, SonicWall and Barracuda focus on managed service partners. Trend Micro, ESET and Avast lead in endpoint and anti-malware add-ons. Hillstone Networks competes on price across Asia.
Top Key Players in the Market
- Fortinet, Inc.
- Cisco Systems, Inc.
- Sophos Limited
- Check Point Software Technologies Ltd.
- WatchGuard Technologies, Inc.
- SonicWall, Inc.
- Palo Alto Networks, Inc.
- Barracuda Networks, Inc.
- Juniper Networks, Inc.
- Huawei Technologies Co., Ltd.
- Trend Micro Incorporated
- Hewlett Packard Enterprise (HPE)
- ESET, spol. s r.o.
- Avast Software s.r.o.
- Hillstone Networks
Recent Developments
- In February 2025, Sophos Limited completed its acquisition of Secureworks for about USD 859 million, adding XDR and managed detection services to its firewall portfolio.
- In March 2025, Google agreed to acquire cloud security firm Wiz for USD 32 billion, its largest deal ever, which raised competition in cloud-based network security.
- In July 2025, Hewlett Packard Enterprise completed its USD 14 billion acquisition of Juniper Networks, which doubled the size of its networking and security business.
- In July 2025, Palo Alto Networks agreed to acquire CyberArk for about USD 25 billion in cash and stock to add identity security to its platform.
- In February 2026, Fortinet reported FY2025 revenue of USD 6.80 billion and billings of USD 7.55 billion, with Unified SASE and SecOps billings up 24%.
Report Scope
| Report Features | Description |
|---|---|
| Market Value (2025) | USD 9.2 Billion |
| Forecast Revenue (2035) | USD 32.6 Billion |
| CAGR (2026-2035) | 13.4% |
| Base Year for Estimation | 2025 |
| Historic Period | 2020-2024 |
| Forecast Period | 2026-2035 |
| Report Coverage | Revenue Forecast, Market Dynamics, Competitive Landscape, Recent Developments |
| Segments Covered | By Component (Hardware, Software, Services, Professional Services, Managed Services); By Security Function (Firewall, Intrusion Detection and Prevention Systems (IDS/IPS), Antivirus and Anti-Malware, Virtual Private Network (VPN), Web Filtering, Email Security, Application Control, Data Loss Prevention (DLP)); By Deployment Mode (On-Premises, Cloud-Based, Hybrid); By Organization Size (Small and Medium-Sized Enterprises (SMEs), Large Enterprises); By End-Use Industry (Banking, Financial Services, and Insurance (BFSI), IT and Telecommunications, Healthcare, Government and Public Sector, Retail and E-commerce, Manufacturing, Education, Others) |
| Regional Analysis | North America – US, Canada; Europe – Germany, France, The UK, Spain, Italy, Rest of Europe; Asia Pacific – China, Japan, South Korea, India, Australia, Singapore, Rest of APAC; Latin America – Brazil, Mexico, Rest of Latin America; Middle East & Africa – GCC, South Africa, Rest of MEA |
| Competitive Landscape | Fortinet, Inc., Cisco Systems, Inc., Sophos Limited, Check Point Software Technologies Ltd., WatchGuard Technologies, Inc., SonicWall, Inc., Palo Alto Networks, Inc., Barracuda Networks, Inc., Juniper Networks, Inc., Huawei Technologies Co., Ltd., Trend Micro Incorporated, Hewlett Packard Enterprise (HPE), ESET, spol. s r.o., Avast Software s.r.o., Hillstone Networks |
| Customization Scope | Customization for segments, region/country-level will be provided. Moreover, additional customization can be done based on the requirements. |
| Purchase Options | We have three licenses to opt for: Single User License, Multi-User License (Up to 5 Users), Corporate Use License (Unlimited Users and Printable PDF) |