Report Overview
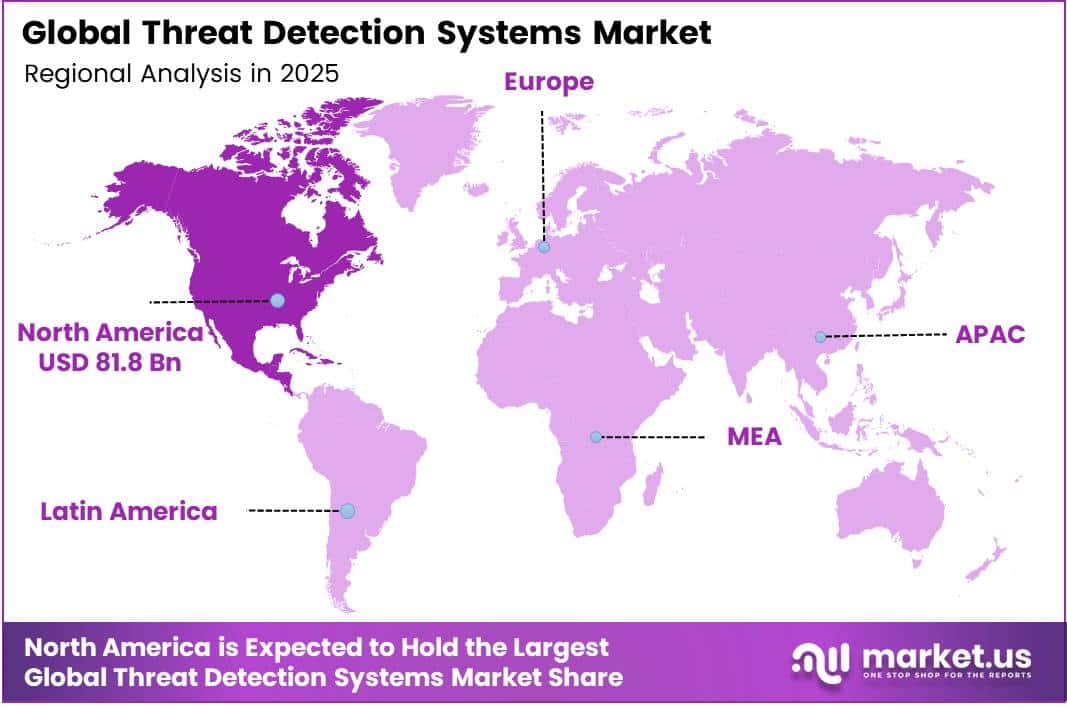
In 2025, the Global Threat Detection Systems Market was valued at USD 215.2 billion. The market is projected to grow at a CAGR of 18.2% during 2026–2035, reaching approximately USD 1,139.5 billion by 2035. North America dominated the global market in 2025, accounting for more than 38.0% of the total market share and generating approximately USD 81.8 billion in revenue.
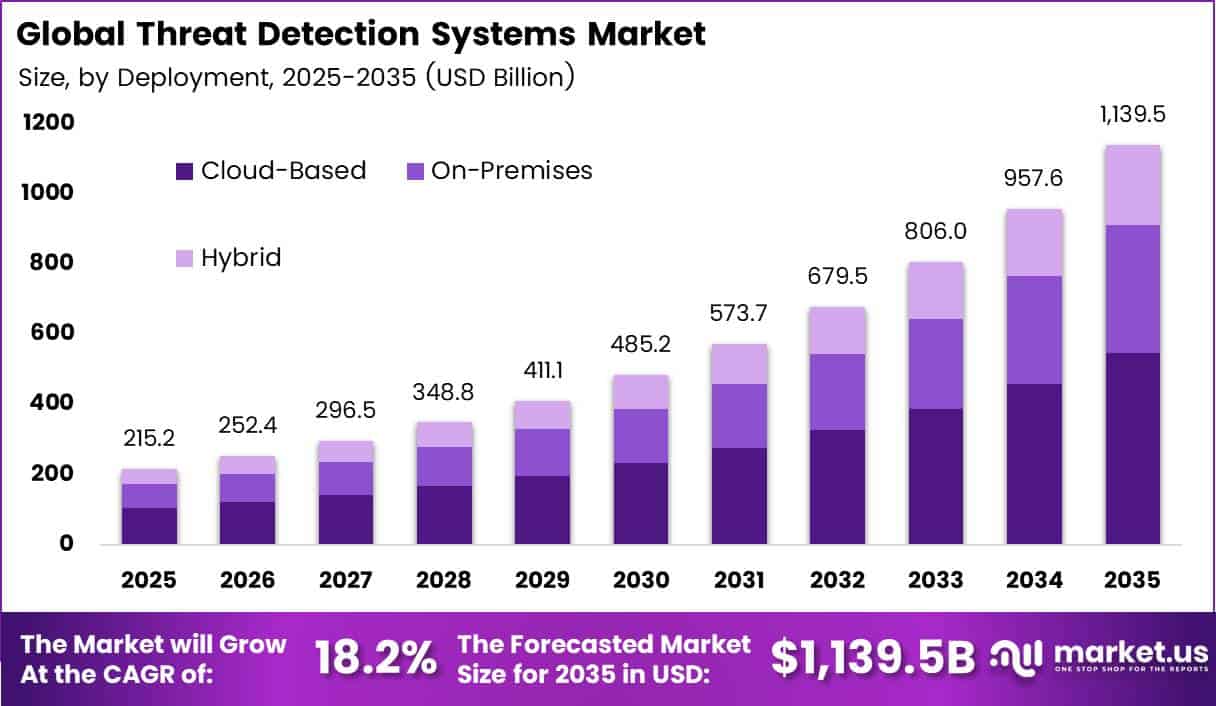
Rising cyber losses drive this demand. The FBI Internet Crime Complaint Center logged 1,008,597 complaints in 2025, its first year above one million. Reported losses reached USD 20.8 billion, up 26% from 2024. The Federal Trade Commission recorded USD 15.9 billion in consumer fraud losses in 2025, a 25% rise.
Banks, insurers, and telecom firms now buy network, endpoint, and behavior analytics tools to catch attacks before money leaves accounts. The ITU reports 5.5 billion people online, so the attack surface keeps growing. That growth pushes companies to spend more on real-time detection.
The US has the largest cyber insurance base and the most digital financial services in the world. Moody’s reported USD 7,718 million in revenue for 2025, which shows how much US firms spend on risk data and analytics. The US government also funds civilian cyber defense, with CISA’s budget at about USD 3 billion in FY2025. The Bureau of Labor Statistics expects information security analyst jobs to grow 33% from 2023 to 2033.
Key Takeaways
- The Threat Detection Systems Market reached USD 215.2 billion in 2025 and will reach USD 1,139.5 billion by 2035. at a CAGR of 18.2% from 2026 to 2035.
- By Component, Software leads with a 51.0% share.
- By Detection Type, Network-Based Threat Detection leads with a 29.0% share.
- By Deployment Mode, Cloud-Based leads with a 48.0% share.
- By Organization Size, Large Enterprises lead with a 68.0% share.
- By Threat Type, Malware and Ransomware lead with a 24.0% share.
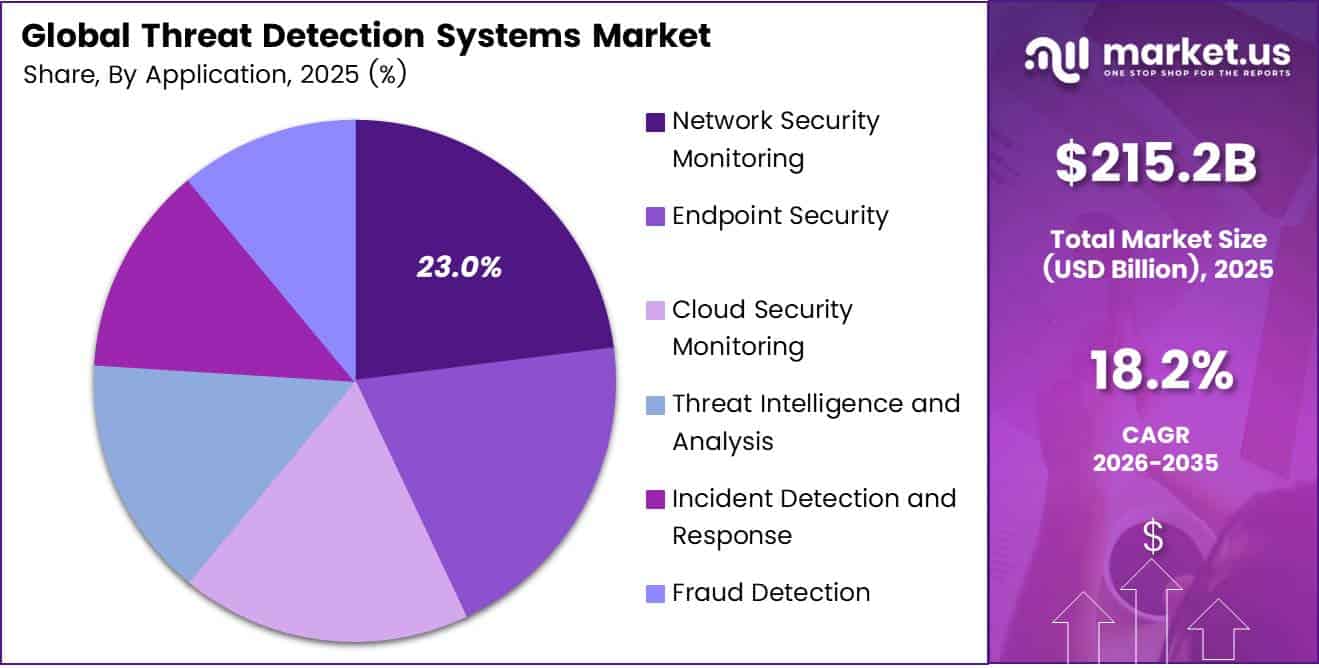
- By Application, Network Security Monitoring leads with a 23.0% share.
- By End-Use Industry, BFSI leads with a 22.0% share.
- North America leads with a 38.0% share and USD 81.8 billion in revenue.
By Component
Software dominates with 51.0% due to real-time analytics across fast-growing attack surfaces.
Software holds the largest share because buyers can update it fast, scale it easily, and link it with the tools they already use. Detection engines, SIEM platforms, and analytics dashboards do the main work of spotting threats. Hardware appliances, by contrast, need physical refresh cycles.
The workload explains the demand. The FBI’s Internet Crime Complaint Center logged 263,455 cyber threat complaints in 2024, with losses of USD 1.571 billion. That volume pushes buyers toward automated software that sorts alerts in seconds instead of hours.
By Detection Type
Network-Based Threat Detection dominates with 29.0% due to full traffic visibility across enterprise networks.
Network-based tools lead because nearly every attack crosses the network at some point. By watching packets and flows, security teams catch scans, floods, and data leaks before they spread to servers or users.
Threat data from Europe backs this focus. ENISA reviewed 11,079 incidents for its 2024 Threat Landscape, and DDoS and ransomware together made up more than half of observed events. DDoS moved into first place, which raises demand for tools that read traffic patterns at the network edge.
By Deployment Mode
Cloud-Based dominates with 48.0% due to fast scaling without on-site hardware costs.
Cloud-based deployment leads because companies already run much of their work in the cloud. Detection tools that live in the same place can read logs directly, update threat rules daily, and grow with traffic on demand.
Eurostat data shows how wide this base has become. 52.74% of EU enterprises used paid cloud computing services in 2025, up 7.42 percentage points from 2023. Among large enterprises, adoption reached 84.67%, so cloud-native detection fits the setups that big buyers already have.
Hybrid deployment is the fastest-growing mode, as most firms keep some sensitive systems on-site while moving other workloads to the cloud. Regulated sectors often must keep certain data local, yet they still want cloud-scale analytics. Hybrid tools join both worlds in one console. They give teams a single view without forcing a full migration.
By Organization Size
Large Enterprises dominate with 68.0% due to large security budgets and complex networks.
Large enterprises lead spending because they run thousands of endpoints, many sites, and complex supply chains. That spread creates more entry points for attackers. It also means they need layered detection tools and dedicated security staff.
UK government data confirms the higher risk. The Cyber Security Breaches Survey 2025/2026 found that 69% of large businesses and 65% of medium businesses reported a breach or attack in the past 12 months. That risk level justifies big, multi-year contracts for full detection suites.
Small and Medium-Sized Enterprises (SMEs) form the fastest-growing group, as attackers now target smaller firms with weaker defenses. The same survey showed that 46% of small businesses and 42% of micro businesses faced attacks. Affordable cloud subscriptions and managed detection bundles now put enterprise-grade tools within reach of firms with small IT teams.
By Threat Type
Malware and Ransomware dominate with 24.0% due to high-impact extortion attacks on critical infrastructure.
Malware and ransomware draw the largest share of detection spending because one successful attack can stop operations for days. Firms invest in tools that catch file encryption, lateral movement, and harmful code before damage spreads.
FBI figures show the threat keeps growing. IC3 received 3,156 ransomware complaints in 2024, and ransomware complaints from critical infrastructure rose 9%. The agency also tracked 67 new ransomware variants, so signature-only tools fall behind fast.
Phishing and Social Engineering is the fastest-growing threat type, as generative AI now helps criminals write convincing emails and clone voices at scale. Phishing and spoofing led all complaint types in 2024 with 193,407 reports, well ahead of extortion at 86,415. Buyers are adding email analysis, link scanning, and identity checks to stop these low-cost, high-volume attacks.
By Application
Network Security Monitoring dominates with 23.0% due to constant monitoring of high-volume network traffic.
Network security monitoring leads because it gives teams the first warning of trouble across all connected systems. Public agencies and private firms rely on it to spot traffic floods, unusual connections, and data leaving the network.
Public-sector incident data shows why. ENISA analysed 586 publicly reported incidents against EU public administrations in 2024. Almost 64% were DDoS attacks, while 33.6% involved intrusions such as data breaches and ransomware. Both patterns call for steady traffic monitoring.
Incident Detection and Response is the fastest-growing application, as speed now decides how much money and data a victim loses. The FBI’s Recovery Asset Team started its rapid response process for 3,900 incidents and helped freeze USD 679 million of USD 1.16 billion in reported losses. Results like these push buyers toward tools that join detection with automated containment.
By End-Use Industry
Banking, Financial Services, and Insurance (BFSI) dominates at 22.0% because of heavy fraud losses and strict regulation.
BFSI leads because banks, insurers, and payment firms hold money and personal data in one place. Regulators require them to watch transactions, report breaches quickly, and prove strong controls. That keeps detection budgets high every year.
Fraud losses show the scale of the risk. The FBI recorded USD 16.6 billion in internet crime losses in 2024, a 33% jump over the prior year. Investment fraud tied to cryptocurrency alone caused over USD 6.5 billion in losses.
Healthcare is the fastest-growing industry, as hospitals face costly attacks on patient records and clinical systems. HHS received 663 reports of large breaches in 2024, affecting about 242.9 million individuals. Hacking and IT incidents made up 81% of those reports. Providers are now speeding up spending on detection to protect care delivery and avoid penalties.
Key Market Segments
By Component
- Hardware
- Software
- Services
- Professional Services
- Managed Services
By Detection Type
- Network-Based Threat Detection
- Endpoint-Based Threat Detection
- Cloud-Based Threat Detection
- Application-Based Threat Detection
- User and Entity Behavior Analytics (UEBA)
- Intrusion Detection and Prevention Systems (IDS/IPS)
By Deployment Mode
- Cloud-Based
- On-Premises
- Hybrid
By Organization Size
- Small and Medium-Sized Enterprises (SMEs)
- Large Enterprises
By Threat Type
- Malware and Ransomware
- Phishing and Social Engineering
- Advanced Persistent Threats (APTs)
- Insider Threats
- Distributed Denial-of-Service (DDoS) Attacks
- Zero-Day Exploits
- Others
By Application
- Network Security Monitoring
- Endpoint Security
- Cloud Security Monitoring
- Threat Intelligence and Analysis
- Incident Detection and Response
- Fraud Detection
By End-Use Industry
- Banking, Financial Services, and Insurance (BFSI)
- IT and Telecommunications
- Healthcare
- Government and Public Sector
- Retail and E-commerce
- Manufacturing
- Energy and Utilities
- Aerospace and Defense
- Others
Geopolitical Impact Analysis
Trade friction between the US and China has raised the cost of threat detection hardware. The US raised Section 301 tariffs on Chinese semiconductors to 50% in 2025, up from 25%. Network sensors, firewalls, and IDS/IPS appliances depend on these chips, so vendors now pay more for each unit they build.
Shipping problems add delays. UNCTAD reported that Suez Canal transits fell by more than 50% after the Red Sea attacks. Ships that go around the Cape of Good Hope add 10 to 14 days to Asia-Europe trips. Appliance makers that ship from Taiwan and China to European data centers now need larger stock buffers.
Prices for key materials have swung widely. DRAM and NAND memory contract prices rose more than 20% in parts of 2025 as AI servers took up supply. Detection platforms store large volumes of logs and telemetry, so higher memory prices raise the cost of on-premises and hybrid systems.
Global trade growth has also slowed. The WTO cut its 2025 forecast for merchandise trade volume and warned of a 0.2% decline under new tariff measures. Slower trade pushes buyers toward cloud-based detection, which does not need imported hardware. That shift explains part of why cloud deployment holds the largest share.
Regional Analysis
North America dominates the Threat Detection Systems Market, holding a 38.0% share and generating USD 81.8 billion in revenue. The US drives most of this spending. The FBI counted 263,455 cyber threat complaints in 2024, linked to USD 1.571 billion in losses. Ransomware hit hospitals, banks, and city offices across the country.
US firms reacted by buying managed detection, endpoint tools, and UEBA platforms. Federal rules also push demand. The SEC now requires public companies to disclose material cyber incidents within 4 business days. CIRCIA reporting rules will require critical infrastructure operators to report incidents within 72 hours.
Asia Pacific is the fastest-growing region in the Threat Detection Systems Market. China, India, and Southeast Asia add millions of new internet users each year. India’s CERT-In handled more than 1.3 million cyber incidents in 2022 and now requires firms to report incidents within 6 hours.
Japan and South Korea fund national cyber programs to protect chip plants and telecom networks. Australia set up an AUD 586.9 million cyber strategy for 2023 to 2030. Fast cloud adoption by small firms makes cloud-based detection the top choice across the region.
Europe holds a strong position because of strict rules. The NIS2 Directive now covers more than 100,000 entities across 18 sectors. DORA, in force since January 2025, requires banks to test and report on their cyber resilience. ENISA ranks ransomware and DDoS as top threats in the region. GDPR fines of up to 4% of global revenue give firms a clear reason to detect breaches early.
Key Regions and Countries
North America
- US
- Canada
Europe
- Germany
- France
- The UK
- Spain
- Italy
- Rest of Europe
Asia Pacific
- China
- Japan
- South Korea
- India
- Australia
- Rest of APAC
Latin America
- Brazil
- Mexico
- Rest of Latin America
Middle East and Africa
- GCC
- South Africa
- Rest of MEA
Market Dynamics
Drivers
| Driver | (~) % Impact on CAGR Forecast | Geographic Relevance | Impact Timeline |
|---|---|---|---|
| Escalating Ransomware and Nation-State Cyber Intrusions | +3.1% | Global, North America, Europe | Short term (2 years or less) |
| Homeland Security and Border Screening Budget Expansion | +2.4% | North America, Middle East, Asia Pacific | Medium term (2 to 4 years) |
| Aviation Checkpoint CT Scanner Recapitalization | +1.9% | North America, Europe | Short term (2 years or less) |
| Mandatory Cyber Incident Disclosure Regulations | +1.6% | United States, European Union | Short term (2 years or less) |
| Counter-Drone Detection Procurement | +1.4% | Europe, Middle East, Asia Pacific | Medium term (2 to 4 years) |
Escalating Ransomware and Nation-State Cyber Intrusions
The main root cause is that intrusion volumes and attacker dwell-time economics keep getting worse. The FBI Internet Crime Complaint Center recorded cybercrime losses above $16 billion in 2024, a rise of about 33% year-on-year. CISA advisories on Volt Typhoon and Salt Typhoon also confirmed that state-linked actors have been sitting inside U.S. telecom and critical infrastructure networks for long periods.
Spending has followed. Per IBM annual breach-cost disclosures, the global average breach cost was about $4.88 million in 2024, and organizations using AI-driven detection widely saved about $2.2 million per incident. According to CrowdStrike and Palo Alto Networks investor filings, subscription revenue now makes up more than 90% of their sales, and annual recurring revenue growth runs at 20% to 30%.
The commercial effect is a shift from one-time hardware margins to recurring gross margins of 75% to 80%. Customer acquisition costs also fall, because platform consolidation lets vendors add modules to existing accounts instead of winning new logos. Together, these effects add about +3.1% on top of the 18.2% baseline.
Restraints
| Restraint | (~) % Impact on CAGR Forecast | Geographic Relevance | Impact Timeline |
|---|---|---|---|
| High Upfront Capital Cost of Screening Hardware | -1.8% | Emerging Asia, Africa, Latin America | Short term (2 years or less) |
| Export Controls on Dual-Use Detection Technology | -1.3% | United States, China, European Union | Medium term (2 to 4 years) |
| Biometric and Surveillance Legal Prohibitions | -1.0% | European Union, select U.S. states | Short term (2 years or less) |
| Elevated Public-Sector Borrowing Costs | -0.8% | Global, developing economies | Short term (2 years or less) |
| Lengthy Government Certification Cycles | -0.7% | North America, Europe | Medium term (2 to 4 years) |
High Upfront Capital Cost of Screening Hardware
Advanced threat detection hardware is expensive up front. Per TSA procurement disclosures, a checkpoint computed tomography unit costs about $300,000 to $500,000, and explosive detection systems for checked baggage cost about $1 million to $2 million each before integration. Smiths Detection and Leidos annual reports also show long installation and acceptance cycles of 12 to 24 months.
This is a hard budget problem for regional airports, ports, and border posts in lower-income economies. Per IMF fiscal monitoring, interest payments in many emerging-market budgets now take more than 15% of revenue. Per World Bank infrastructure finance data, security CapEx often loses out to transport and energy spending.
As a result, operators delay or cancel tenders and stretch replacement cycles from about 7 years to 10 years or more. Vendors respond by cutting prices, which compresses hardware gross margins by about 3 to 5 percentage points. The net deduction is about -1.8% from the baseline.
Challenges
| Challenge | (~) % CAGR Friction Drag | Geographic Relevance | Mitigation Horizon |
|---|---|---|---|
| Cybersecurity Analyst Talent Deficit | -1.5% | Global | Long term (4 years or more) |
| High False-Positive Alert Fatigue | -1.1% | Global | Medium term (2 to 4 years) |
| Semiconductor and Sensor Supply Constraints | -0.9% | Asia Pacific, North America | Medium term (2 to 4 years) |
| Legacy System Integration Complexity | -0.7% | North America, Europe | Medium term (2 to 4 years) |
| Adversarial AI Evasion Techniques | -0.6% | Global | Long term (4 years or more) |
Cybersecurity Analyst Talent Deficit
The structural weakness is that threat detection tools still depend on skilled analysts to triage, tune, and respond. ISC2 workforce studies estimate a global shortage of about 4.8 million security professionals, a gap that widened by about 19% year-on-year. Per U.S. Bureau of Labor Statistics projections, information security analyst roles will grow by about 33% through the next decade, far faster than graduate output can supply.
The shortage shows up as slower adoption. Many deployed platforms are under-tuned, which reduces renewal value. Per U.S. Bureau of Labor Statistics wage data, median analyst pay is above $120,000, and fully loaded security operations center staffing costs can take 40% or more of a mid-market buyer’s security budget.
Navigating this requires long-term change. Vendors need to build autonomous triage, invest in co-managed service layers, and fund workforce programs such as those under the NIST NICE framework. Until those efforts mature, the drag on maximum growth potential is about -1.5%.
Opportunities
| Opportunity | (~) % Potential CAGR Upside | Geographic Relevance | Execution Window |
|---|---|---|---|
| Operational Technology and Industrial Control System Detection | +2.2% | Global, Middle East, Asia Pacific | Medium term (2 to 4 years) |
| SME-Focused Detection-as-a-Service Bundles | +1.6% | Asia Pacific, Latin America, Africa | Short term (2 years or less) |
| Smart City and Public Venue Sensor Fusion | +1.2% | Middle East, India, Southeast Asia | Medium term (2 to 4 years) |
| Satellite and Space Asset Threat Monitoring | +0.9% | North America, Europe | Long term (4 years or more) |
| Roll-Up of Niche Detection Specialists | +0.8% | North America, Europe | Short term (2 years or less) |
Operational Technology and Industrial Control System Detection
Detection for operational technology (OT) is still white space, not a current driver. Per CISA industrial control system advisories, most utilities, water systems, and manufacturing plants still run flat networks with little or no passive monitoring. Per Dragos and Fortinet operational technology disclosures, fewer than 30% of industrial sites have full asset visibility.
Demand will be pulled forward by regulation already on the books. The EU NIS2 Directive has applied since 17 October 2024, and India’s CERT-In directions require incident reporting within 6 hours, so a meaningful share of currently unmonitored industrial assets will need coverage.
The unit economics are favorable. Passive OT sensors sold on subscription can reach gross margins of about 70% to 78%, versus about 40% to 45% for screening hardware. Per-site monitoring costs could also fall by about 25% to 35% as virtualized sensors replace dedicated appliances. If executed, this could add about +2.2% to the baseline.
Key Players Analysis
Tier 1 leaders have the largest balance sheets and the broadest data assets. Moody’s owns RMS. It bought RMS in 2021, when RMS earned about USD 320 million a year. Moody’s expected the deal to add up to USD 150 million in run-rate revenue by 2025. Verisk Analytics earned about USD 2.88 billion in 2024 and builds cyber loss models for insurers.
Guidewire, which owns Cyence, reported about USD 1.2 billion in FY2025 revenue and spent close to USD 300 million on R&D. Tier 2 challengers lead in risk ratings and data. BitSight passed USD 200 million in ARR in April 2025 after buying Cybersixgill for about USD 115 million. Non-North American firms made up 30% of its new customers in 2024.
SecurityScorecard is near USD 140 million in ARR and grows about 25% to 30% per year. Insurtech challengers link detection to coverage. Coalition holds a valuation of about USD 5.29 billion and helped policyholders recover USD 31 million in stolen funds in 2024. At-Bay wrote USD 278 million in gross premiums in 2025. Travelers bought Corvus for about USD 435 million.
Niche firms such as Kovrr, Black Kite, Cyberwrite, KYND, CyberCube, Resilience, and Cytora focus on cyber risk quantification and underwriting data. Their main paths to growth are deals with insurers and bigger platforms.
Top Key Players in the Market
- CyberCube Analytics, Inc.
- Software, Inc. (Cyence)
- BitSight Technologies, Inc.
- Kovrr Ltd.
- Coalition, Inc.
- At-Bay, Inc.
- Resilience Cyber Insurance Solutions, Inc.
- Corvus Insurance (Travelers)
- SecurityScorecard, Inc.
- Black Kite, Inc.
- Moody’s RMS
- Verisk Analytics, Inc.
- Cyberwrite Ltd.
- KYND Limited
- Cytora Limited
Recent Developments
- In August 2026, Munich Re agreed to buy At-Bay in an all-cash deal at an enterprise value of USD 575 million. At-Bay had written USD 278 million in gross premiums in 2025.
- In July 2026, Coalition raised USD 60 million in Series G funding at a valuation of about USD 5.29 billion.
- In February 2026, Moody’s reported full-year 2025 revenue of USD 7,718 million, up from USD 7,088 million in 2024. That revenue includes the RMS cyber risk models.
- In September 2025, SecurityScorecard bought HyperComply to add AI questionnaire automation. The company says the tool cuts manual work by 92% and speeds up vendor onboarding 10 times.
- In April 2025, BitSight passed USD 200 million in annual recurring revenue. Firms based outside North America made up 30% of its new customers in 2024.
Report Scope
| Report Features | Description |
|---|---|
| Market Value (2025) | USD 215.2 Billion |
| Forecast Revenue (2035) | USD 1,139.5 Billion |
| CAGR (2026-2035) | 18.2% |
| Base Year for Estimation | 2025 |
| Historic Period | 2020-2024 |
| Forecast Period | 2026-2035 |
| Report Coverage | Revenue Forecast, Market Dynamics, Competitive Landscape, Recent Developments |
| Segments Covered | By Component (Hardware, Software, Services, Professional Services, Managed Services); By Detection Type (Network-Based Threat Detection, Endpoint-Based Threat Detection, Cloud-Based Threat Detection, Application-Based Threat Detection, User and Entity Behavior Analytics (UEBA), Intrusion Detection and Prevention Systems (IDS/IPS)); By Deployment Mode (Cloud-Based, On-Premises, Hybrid); By Organization Size (Small and Medium-Sized Enterprises (SMEs), Large Enterprises); By Threat Type (Malware and Ransomware, Phishing and Social Engineering, Advanced Persistent Threats (APTs), Insider Threats, Distributed Denial-of-Service (DDoS) Attacks, Zero-Day Exploits, Others); By Application (Network Security Monitoring, Endpoint Security, Cloud Security Monitoring, Threat Intelligence and Analysis, Incident Detection and Response, Fraud Detection); By End-Use Industry (Banking, Financial Services, and Insurance (BFSI), IT and Telecommunications, Healthcare, Government and Public Sector, Retail and E-commerce, Manufacturing, Energy and Utilities, Aerospace and Defense, Others) |
| Regional Analysis | North America – US, Canada; Europe – Germany, France, The UK, Spain, Italy, Rest of Europe; Asia Pacific – China, Japan, South Korea, India, Australia, Singapore, Rest of APAC; Latin America – Brazil, Mexico, Rest of Latin America; Middle East & Africa – GCC, South Africa, Rest of MEA |
| Competitive Landscape | CyberCube Analytics, Inc., Guidewire Software, Inc. (Cyence), BitSight Technologies, Inc., Kovrr Ltd., Coalition, Inc., At-Bay, Inc., Resilience Cyber Insurance Solutions, Inc., Corvus Insurance (Travelers), SecurityScorecard, Inc., Black Kite, Inc., Moody’s RMS, Verisk Analytics, Inc., Cyberwrite Ltd., KYND Limited, Cytora Limited |
| Customization Scope | Customization for segments, region/country-level will be provided. Moreover, additional customization can be done based on the requirements. |
| Purchase Options | We have three licenses to opt for: Single User License, Multi-User License (Up to 5 Users), Corporate Use License (Unlimited Users and Printable PDF) |