Report Overview
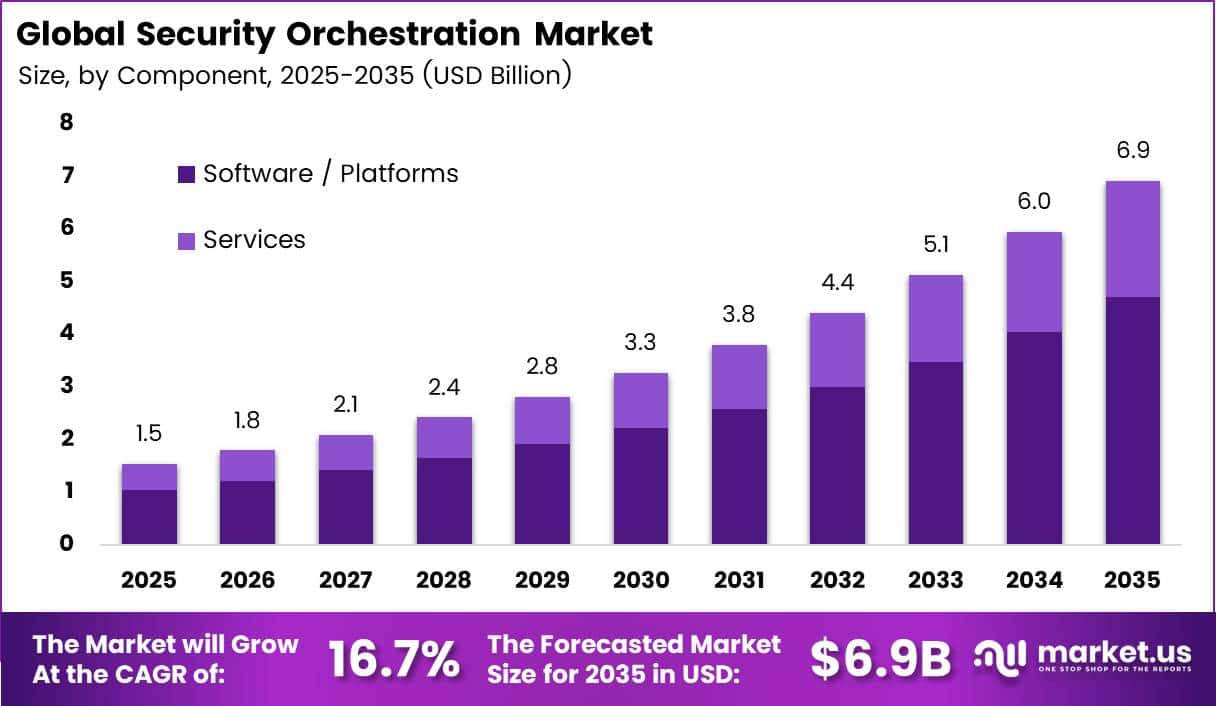
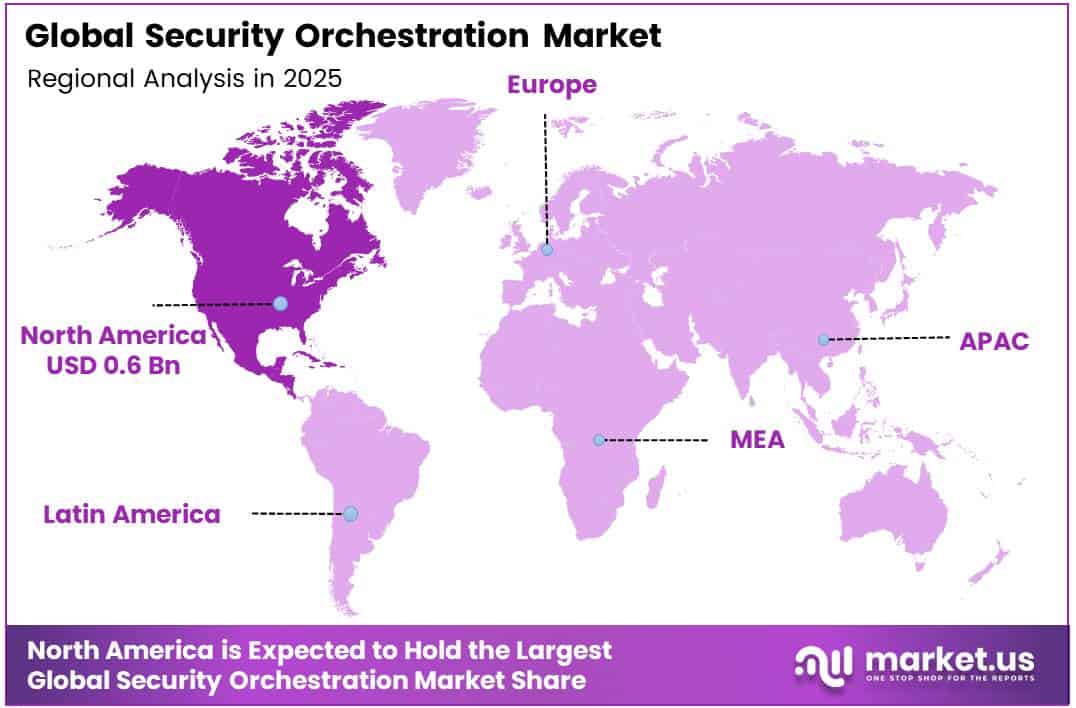
In 2025, the Global Security Orchestration Market was valued at USD 1.5 billion. The market is projected to grow at a CAGR of 16.7% during 2026–2035, reaching approximately USD 6.9 billion by 2035. North America dominated the global market in 2025, accounting for more than 38.0% of the total market share and generating approximately USD 0.6 billion in revenue.
Attack volumes keep rising, and that drives the growth. The FBI Internet Crime Complaint Center logged 859,532 complaints in 2024 and reported losses that passed USD 16.6 billion. That is a 33% rise from 2023. Security teams cannot review that many alerts by hand.
ISC2, the cybersecurity trade association, puts the global workforce gap at 4.8 million workers. Orchestration platforms fill this gap. They connect security tools, sort alerts, and run response playbooks automatically. Banks, telecom operators, and hospitals now handle millions of security events every day, so they need automated workflows to keep response times short.
The North America region has the most digital assets to protect. The ITU reports that more than 90% of people in the Americas’ high-income economies use the internet. US federal rules also push buyers toward automation. The SEC now requires listed companies to disclose material cyber incidents within 4 business days.
Key Takeaways
- The Security Orchestration Market reached USD 1.5 billion in 2025 and should hit USD 6.9 billion by 2035. grow at a CAGR of 16.7% from 2026 to 2035.
- By component, Software / Platforms lead with a 68.0% share.
- By deployment mode, Cloud-Based leads with a 48.0% share.
- By organization size, Large Enterprises lead with a 66.0% share.
- By security type, Network Security leads with a 22.0% share.
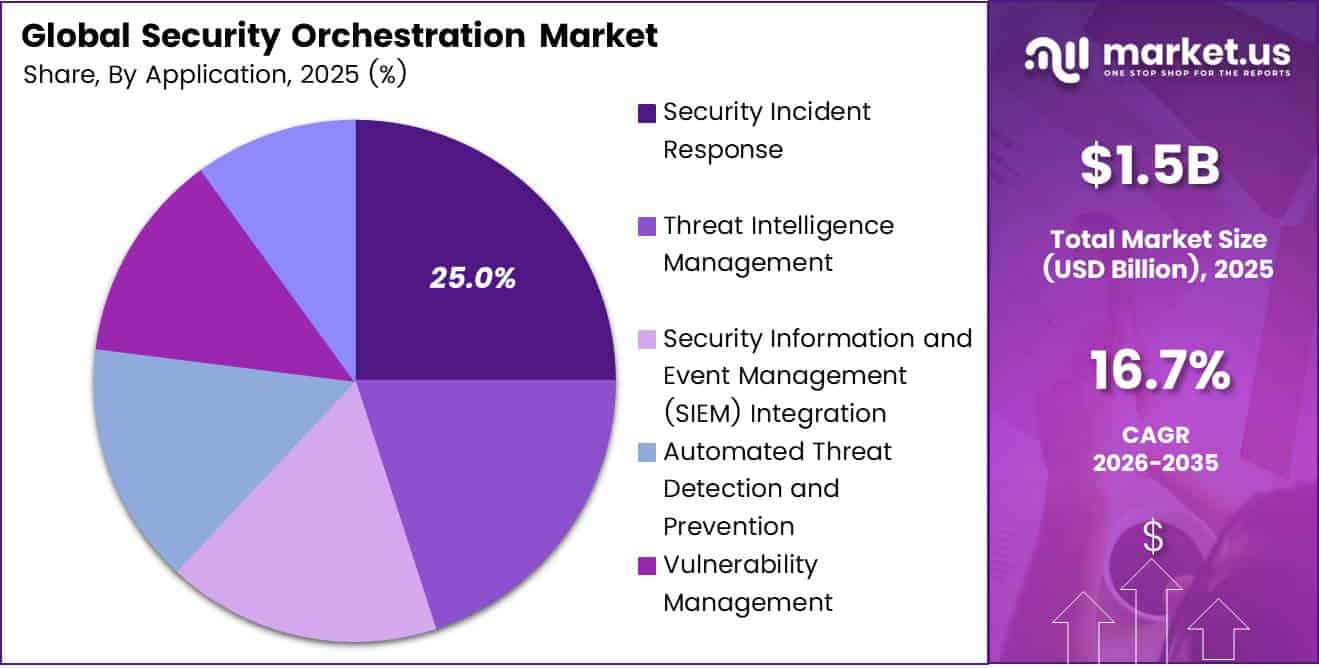
- By application, Security Incident Response leads with a 25.0% share.
- By end-use industry, BFSI leads with a 23.0% share.
- North America leads with a 38.0% share and USD 0.6 billion in revenue.
By Component
Software / Platforms dominates with 68.0% due to central control across many security tools.
Software / Platforms hold the largest share because security teams need one central place to link tools, run playbooks, and close alerts fast. IBM reports that the average data breach cost USD 4.44 million in 2025, and firms that use AI and automation widely save nearly USD 1.9 million per breach. These savings push buyers to fund platforms first.
ISC2 also finds that 90% of respondents face skills shortages inside their teams. Managed providers fill this hole with ready experts, round-the-clock monitoring, and fixed monthly fees. Professional Services also gain as buyers pay for setup, playbook design, and tool links during rollout. Together, these forces keep platforms in the lead while outsourced support grows faster each year.
By Deployment Mode
Cloud-Based dominates with 48.0% due to fast setup and elastic usage-based scaling.
Cloud-Based deployment leads because buyers can switch on orchestration in days, skip hardware costs, and pay only for what they use. Eurostat reports that 52.74% of EU enterprises used paid cloud services in 2025, a rise of 7.42 percentage points over 2023. As core business apps move to the cloud, security workflows follow the same path.
Among medium-sized firms, cloud use climbed from 59.09% in 2023 to 66.78% in 2025. This shift brings more cloud-native data sources, which cloud orchestration tools connect with little effort. Vendors also release new features to cloud users first, which widens the gap with older setups.
By Organization Size
Large Enterprises dominate with 66.0% due to large security budgets and complex tool stacks.
Large Enterprises lead because they run dozens of security tools, handle huge alert volumes, and face the highest breach costs. IBM finds that the average breach in the United States reached a record USD 10.22 million in 2025. At that cost level, big firms readily fund orchestration to cut response time and staff hours.
SMEs form the fastest-growing group. The U.S. Small Business Administration counts 34.8 million small businesses, equal to 99.9% of all U.S. firms, and they employ 45.9% of U.S. workers. Most of these firms have no full-time security staff, which makes them easy targets.
By Security Type
Network Security dominates with 22.0% due to high-volume intrusion and DDoS alert traffic.
Network Security leads because firewalls, intrusion systems, and traffic monitors create the largest share of alerts that teams must sort. ENISA analysed 4,875 incidents between July 2024 and June 2025, and hacktivist attacks, mostly low-level DDoS floods, made up almost 80% of recorded incidents. Orchestration tools help teams block bad traffic and update firewall rules in seconds.
Cloud Security grows at the fastest rate. ITU estimates that 6 billion people use the internet in 2025, with more than 240 million joining in that year alone. 5G now reaches over half of the world’s population. This growth pushes firms to move apps, data, and users to cloud services, where misconfigured storage and stolen access keys open new risks.
By Application
Security Incident Response dominates with 25.0% due to the urgent need to contain breaches faster.
Security Incident Response leads because speed decides how much damage an attack causes. IBM reports that firms took a mean of 241 days to identify and contain a breach in 2025, the lowest level in nine years, thanks largely to AI and automation. Every day saved lowers legal, recovery, and downtime costs, so buyers start their orchestration journey here.
Automated Threat Detection and Prevention grows fastest. NIST notes that CVE submissions rose 32% in 2024, which created a large backlog at the National Vulnerability Database. MITRE’s CWE Top 25 review covered 31,770 CVE records in a single year. The FBI also found that ransomware complaints against critical infrastructure rose 9% in 2024.
By End-Use Industry
Banking, Financial Services, and Insurance (BFSI) dominates with 23.0% due to high fraud losses and strict regulations.
BFSI leads because banks, insurers, and payment firms hold money and personal data, which makes them prime targets. The FBI’s IC3 logged 859,532 complaints in 2024 with losses of USD 16.6 billion, a 33% jump from 2023. Investment fraud tied to cryptocurrency alone caused over USD 6.5 billion in losses.
Healthcare grows at the fastest pace. The HHS Office for Civil Rights recorded 804 large breaches affecting more than 140 million people in 2025, after the Change Healthcare attack exposed data of 192.7 million people in 2024. Hospitals run many connected devices and old systems, yet they have small security teams.
Key Market Segments
By Component
- Software / Platforms
- Services
- Professional Services
- Managed Services
By Deployment Mode
- Cloud-Based
- On-Premises
- Hybrid
By Organization Size
- Small and Medium-Sized Enterprises (SMEs)
- Large Enterprises
By Security Type
- Network Security
- Endpoint Security
- Cloud Security
- Application Security
- Identity and Access Management (IAM)
- Data Security
By Application
- Security Incident Response
- Threat Intelligence Management
- Security Information and Event Management (SIEM) Integration
- Automated Threat Detection and Prevention
- Vulnerability Management
- Compliance and Risk Management
By End-Use Industry
- Banking, Financial Services, and Insurance (BFSI)
- IT and Telecommunications
- Healthcare
- Government and Public Sector
- Retail and E-commerce
- Manufacturing
- Energy and Utilities
- Others
Geopolitical Impact Analysis
Security orchestration runs mostly as software, but it still depends on servers, chips, and network gear. US Section 301 tariffs on Chinese semiconductors rose to 50% in 2025. The WTO flagged a sharp increase in new trade restrictions on technology goods. These costs reach data center hardware, so on-premises buyers pay more for appliances that host orchestration engines.
Shipping disruption adds more pressure. UNCTAD reported that Suez Canal transits fell by more than 50% after the Red Sea attacks. Vessels rerouted around the Cape of Good Hope, which added about 10 to 14 days to Asia-to-Europe voyages. Hardware for security operations centers now arrives later. That delay pushes more buyers toward cloud-based deployment.
Energy prices also shape costs. The IEA projects that data center power demand will more than double to about 945 TWh by 2030. Cloud providers pass higher power costs on to software vendors. Vendors then build those costs into subscription prices for orchestration platforms.
Conflict also raises demand. State-backed groups attack banks, power grids, and governments during periods of tension. The World Bank and IMF warn that cyber incidents now pose a real risk to financial stability. Buyers respond by speeding up spending on automated incident response.
Regional Analysis
North America dominates the Security Orchestration Market, holding a 38.0% share and generating USD 0.6 billion in revenue. The US drives most of this demand. It has the largest base of cloud providers, security vendors, and managed security service firms. The US Bureau of Labor Statistics expects information security analyst jobs to grow 33% from 2023 to 2033, much faster than average.
Asia Pacific is the fastest-growing region in the Security Orchestration Market. India’s CERT-In requires firms to report cyber incidents within 6 hours, which pushes them toward automated response. China, Japan, and South Korea keep expanding 5G networks and smart factories, and those networks create new attack surfaces.
Australia’s Cyber Security Strategy commits about AUD 586.9 million to defense programs. Rapid cloud adoption among SMEs across the region also raises demand for low-cost, cloud-based orchestration tools.
Europe holds a strong second position. The NIS2 Directive now covers 18 critical sectors and sets a 24-hour early warning deadline for incidents. DORA also requires EU banks to test and report on digital resilience. Germany, France, and the UK lead spending. Fines under NIS2 can reach EUR 10 million or 2% of global turnover.
Key Regions and Countries
North America
- US
- Canada
Europe
- Germany
- France
- The UK
- Spain
- Italy
- Rest of Europe
Asia Pacific
- China
- Japan
- South Korea
- India
- Australia
- Rest of APAC
Latin America
- Brazil
- Mexico
- Rest of Latin America
Middle East and Africa
- GCC
- South Africa
- Rest of MEA
Market Dynamics
Drivers
| Driver | (~) % Impact on CAGR Forecast | Geographic Relevance | Impact Timeline |
|---|---|---|---|
| Alert Overload in Security Operations Centers | +3.1% | Global, led by North America | Short term (2 years or less) |
| Mandatory Incident Reporting Deadlines | +2.4% | North America, EU | Short term (2 years or less) |
| Growing Ransomware Losses | +2.0% | Global | Short term (2 years or less) |
| Multi-Cloud Workload Sprawl | +1.7% | North America, Asia Pacific | Medium term (2 to 4 years) |
| Merging of SIEM and Orchestration Platforms | +1.4% | North America, Western Europe | Medium term (2 to 4 years) |
Alert Overload in Security Operations Centers
The root cause is a mismatch between how many alerts SOC teams receive and how many people they have to handle them. Large enterprise SOCs routinely process more than 10,000 alerts per day, and practitioner surveys from the SANS Institute consistently find that well over 40% of those alerts go uninvestigated or turn out to be false positives.
The financial case for automation is clear in the IBM Cost of a Data Breach study, which puts the global average breach cost near USD 4.9 million for 2024. The same study found that organizations making extensive use of security AI and automation saved about USD 2.2 million per breach and shortened the breach lifecycle by close to 100 days.
As a result, vendors have moved from per-seat perpetual licences to consumption-based SaaS pricing tied to the number of automated actions, a change reflected across 2024 and 2025 earnings calls from Palo Alto Networks, CrowdStrike and Splunk. Buyers now treat orchestration as a way to keep headcount flat rather than as an optional add-on. This shortens sales cycles by an estimated 15–20% and supports a durable +3.1% boost above the 16.7% baseline.
Restraints
| Restraint | (~) % Impact on CAGR Forecast | Geographic Relevance | Impact Timeline |
|---|---|---|---|
| High Upfront Integration and Deployment Costs | -1.9% | Global, SME segment | Short term (2 years or less) |
| Tight Mid-Market IT Budgets | -1.4% | Europe, Latin America | Short term (2 years or less) |
| Data Localization Barriers to Cloud SaaS | -1.1% | China, India, Middle East | Medium term (2 to 4 years) |
| Legacy On-Premise Tool Lock-In | -0.9% | Global | Medium term (2 to 4 years) |
| Restrictions on Foreign Security Vendors in Public Procurement | -0.7% | China, Russia, select APAC | Long term (4 years or more) |
High Upfront Integration and Deployment Costs
The root cause is that orchestration only pays off once it is connected to dozens of existing tools. A typical mid-sized enterprise runs between 40 and 70 separate security products, according to industry association surveys from ISC2 and the Cloud Security Alliance.
Each connector and playbook needs custom engineering, so professional-services fees can reach 1.5x–2x the first-year licence value, and production rollouts often take 6–9 months. Small businesses feel this most: the U.S. Small Business Administration and Eurostat ICT usage data both show that most small firms spend well below 10% of their IT budgets on security.
When the price of entry is that high, purchases get postponed outright, as reflected in elongated deal disclosures in Rapid7 and Tenable filings during 2025. Vendors end up offering larger discounts while services margins fall to roughly 15–25%, which pulls about 1.9% off the baseline growth path.
Challenges
| Challenge | (~) % CAGR Friction Drag | Geographic Relevance | Mitigation Horizon |
|---|---|---|---|
| Shortage of Playbook Engineers | -1.6% | Global | Long term (4 years or more) |
| API Fragmentation Across Vendors | -1.0% | Global | Medium term (2 to 4 years) |
| Automation Errors Disrupting Operations | -0.8% | North America, Europe | Medium term (2 to 4 years) |
| Explainability of AI Agents | -0.7% | EU, North America | Medium term (2 to 4 years) |
| Ongoing Playbook Maintenance Burden | -0.5% | Global | Short term (2 years or less) |
Shortage of Playbook Engineers
The underlying weakness is that orchestration value depends on scarce people who understand both security operations and software engineering. The ISC2 Cybersecurity Workforce Study puts the global workforce gap at roughly 4.8 million professionals.
Within that pool, people skilled in automation scripting, Python, and API integration are only a small subset. U.S. Bureau of Labor Statistics projections put growth for information security analysts at about 33% over the decade, far faster than universities can graduate new talent. CyberSeek demand data shows more than 450,000 open U.S. cybersecurity roles.
The shortage limits how fast customers can actually use what they buy: deployments stall at 20–30% of planned playbook coverage, and usage-based revenue growth slows. Vendors are responding with long-term investments in low-code builders, pre-built content libraries, and managed services, which reduces the drag on growth to about 1.6% without stopping current sales.
Opportunities
| Opportunity | (~) % Potential CAGR Upside | Geographic Relevance | Execution Window |
|---|---|---|---|
| Autonomous Agentic SOC Platforms | +2.2% | North America, Western Europe | Medium term (2 to 4 years) |
| MSSP Multi-Tenant Orchestration Bundles | +1.6% | Asia Pacific, Latin America | Short term (2 years or less) |
| Orchestration for OT and Critical Infrastructure | +1.3% | Global, energy and manufacturing hubs | Long term (4 years or more) |
| Sovereign Cloud Deployment Editions | +0.9% | EU, India, GCC | Medium term (2 to 4 years) |
| Roll-Up Acquisitions of Point Automation Tools | +0.7% | North America, Israel | Short term (2 years or less) |
Autonomous Agentic SOC Platforms
This opportunity is still largely untapped. Today’s orchestration runs fixed, human-written playbooks. Agentic systems that can reason through an investigation, choose what to do, and carry out a fix on their own remain mostly in pilots, and earnings disclosures from Microsoft, Google, and CrowdStrike through 2025 describe early-access programs rather than broad adoption.
The white space is to charge per resolved incident instead of per seat, a new monetization model. Under that model, vendors could raise gross margins by 5–8 percentage points and cut the cost of handling each incident by 60–80% compared with manual Tier-1 triage, which ISC2 compensation benchmarks put at roughly USD 25–40 per alert.
Uptake depends on governance being clearly defined. The NIST AI Risk Management Framework and the EU AI Act’s obligations phasing in from August 2026 provide that clarity, opening a sizable untapped segment of demand. Vendors that build explainable autonomy could add about 2.2% on top of the 16.7% baseline.
Key Players Analysis
Tier 1 leaders combine global reach with large revenue bases. Moody’s reported total revenue of about USD 7.1 billion in 2024, and its RMS unit supplies cyber catastrophe models to insurers. Verisk earned about USD 2.9 billion in 2024. In July 2025, it agreed to buy AccuLynx for USD 2.35 billion. Guidewire reported fiscal 2025 revenue of about USD 1.2 billion, and its Cyence unit models cyber risk for carriers.
Bitsight is the largest pure-play challenger. It passed USD 200 million in annual recurring revenue in April 2025. It also bought Cybersixgill for USD 115 million in 2024, adding threat intelligence to its platform. Moody’s backed the company earlier with a USD 250 million investment. SecurityScorecard competes head-to-head with Bitsight in third-party risk and reports positive free cash flow.
Insurance-led firms make up the next group. Travelers bought Corvus for about USD 435 million. Munich Re agreed in August 2026 to buy At-Bay for USD 575 million. At-Bay booked USD 278 million in gross written premium in 2025. Coalition has raised close to USD 1.05 billion in total funding.
Niche specialists include CyberCube, Kovrr, Black Kite, Cyberwrite, KYND, Cytora, and Resilience. Black Kite has raised more than USD 33.1 million, including a USD 22 million Series B. These firms compete on risk quantification models and on how deeply they integrate with insurer workflows.
Top Key Players in the Market
- CyberCube Analytics, Inc.
- Guidewire Software, Inc. (Cyence)
- BitSight Technologies, Inc.
- Kovrr Ltd.
- Coalition, Inc.
- At-Bay, Inc.
- Resilience Cyber Insurance Solutions, Inc.
- Corvus Insurance (Travelers)
- SecurityScorecard, Inc.
- Black Kite, Inc.
- Moody’s RMS
- Verisk Analytics, Inc.
- Cyberwrite Ltd.
- KYND Limited
- Cytora Limited
Recent Developments
- In August 2026, Munich Re agreed to acquire At-Bay, Inc. for USD 575 million. The deal adds a cyber insurtech with USD 278 million in 2025 gross written premium.
- In July 2026, Coalition, Inc. reportedly raised a USD 60 million Series G round at a valuation of about USD 5.29 billion.
- In April 2025, BitSight Technologies, Inc. passed USD 200 million in annual recurring revenue after integrating Cybersixgill’s threat intelligence.
- In April 2025, SecurityScorecard, Inc. reported a record quarter with a 40% improvement in ARR per employee and positive free cash flow.
Report Scope
| Report Features | Description |
|---|---|
| Market Value (2025) | USD 1.5 Billion |
| Forecast Revenue (2035) | USD 6.9 Billion |
| CAGR (2026-2035) | 16.7% |
| Base Year for Estimation | 2025 |
| Historic Period | 2020-2024 |
| Forecast Period | 2026-2035 |
| Report Coverage | Revenue Forecast, Market Dynamics, Competitive Landscape, Recent Developments |
| Segments Covered | By Component (Software / Platforms, Services, Professional Services, Managed Services); By Deployment Mode (Cloud-Based, On-Premises, Hybrid); By Organization Size (Small and Medium-Sized Enterprises (SMEs), Large Enterprises); By Security Type (Network Security, Endpoint Security, Cloud Security, Application Security, Identity and Access Management (IAM), Data Security); By Application (Security Incident Response, Threat Intelligence Management, Security Information and Event Management (SIEM) Integration, Automated Threat Detection and Prevention, Vulnerability Management, Compliance and Risk Management); By End-Use Industry (Banking, Financial Services, and Insurance (BFSI), IT and Telecommunications, Healthcare, Government and Public Sector, Retail and E-commerce, Manufacturing, Energy and Utilities, Others) |
| Regional Analysis | North America – US, Canada; Europe – Germany, France, The UK, Spain, Italy, Rest of Europe; Asia Pacific – China, Japan, South Korea, India, Australia, Singapore, Rest of APAC; Latin America – Brazil, Mexico, Rest of Latin America; Middle East & Africa – GCC, South Africa, Rest of MEA |
| Competitive Landscape | CyberCube Analytics, Inc., Guidewire Software, Inc. (Cyence), BitSight Technologies, Inc., Kovrr Ltd., Coalition, Inc., At-Bay, Inc., Resilience Cyber Insurance Solutions, Inc., Corvus Insurance (Travelers), SecurityScorecard, Inc., Black Kite, Inc., Moody’s RMS, Verisk Analytics, Inc., Cyberwrite Ltd., KYND Limited, Cytora Limited |
| Customization Scope | Customization for segments, region/country-level will be provided. Moreover, additional customization can be done based on the requirements. |
| Purchase Options | We have three licenses to opt for: Single User License, Multi-User License (Up to 5 Users), Corporate Use License (Unlimited Users and Printable PDF) |