Report Overview
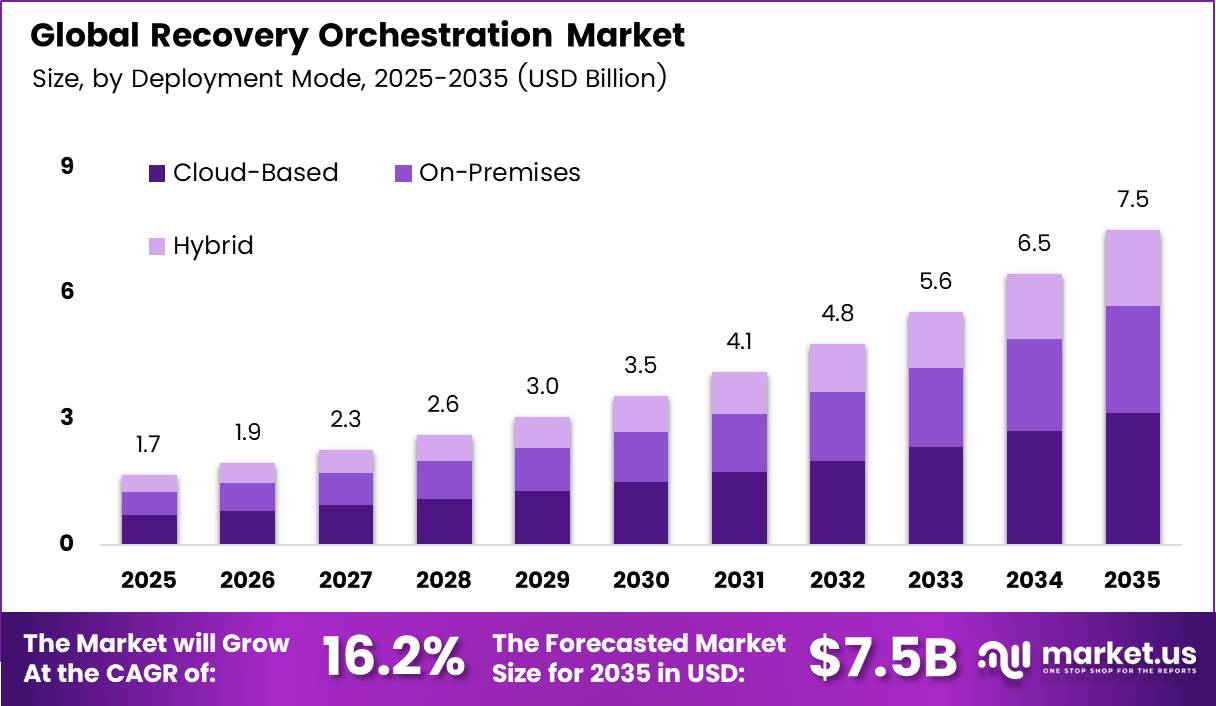
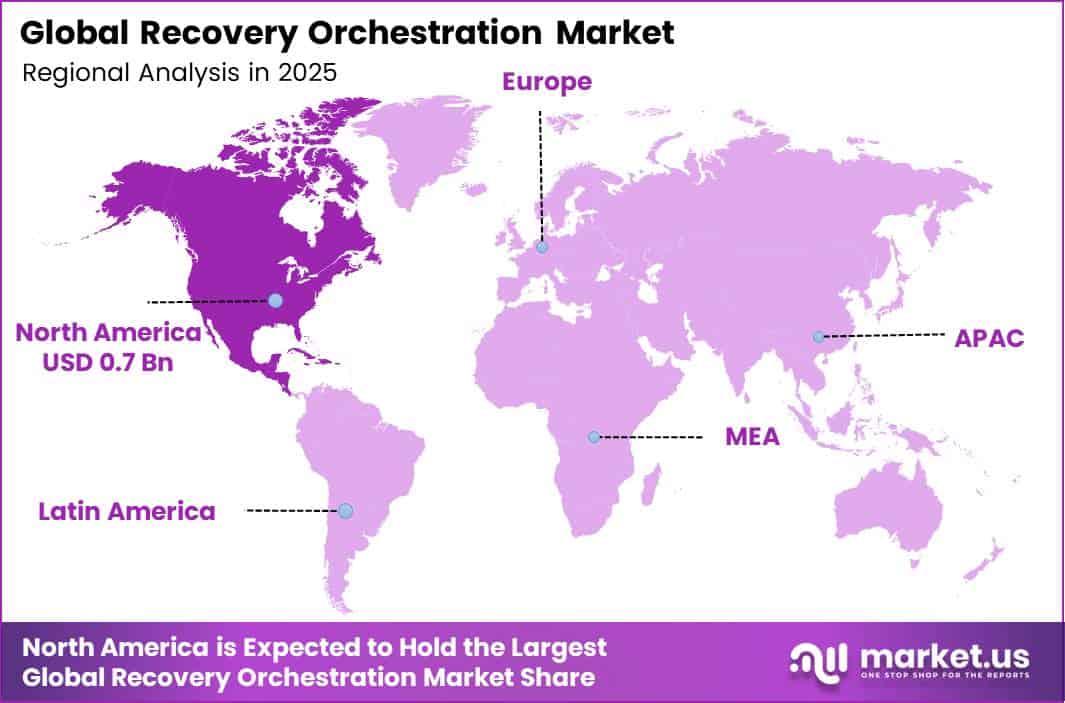
In 2025, the Global Recovery Orchestration Market was valued at USD 1.7 billion. The market is projected to grow at a CAGR of 16.2% during 2026–2035, reaching approximately USD 7.5 billion by 2035. North America dominated the global market in 2025, accounting for more than 38.0% of the total market share and generating approximately USD 0.7 billion in revenue.
Rising cyber losses drive this demand. According to the FBI Internet Crime Complaint Center (IC3), Americans reported USD 16.6 billion in internet crime losses in 2024, a 33% jump over 2023. The IC3 logged 859,532 complaints that year. Ransomware stayed the most common threat to critical infrastructure, and ransomware complaints rose 9%.
The IC3 also tracked 67 new ransomware variants. Banks, hospitals, and utilities cannot afford long outages. So they buy orchestration tools that automate failover, test recovery plans, and restore clean data in the right order.
The North America region pairs strong IT budgets with a tight talent market. The U.S. Bureau of Labor Statistics expects jobs for information security analysts to grow 21% from 2025 to 2035, much faster than the average for all jobs. Even so, U.S. employers had only about 192,900 of these analysts in 2025. This gap pushes firms to automate.
Key Takeaways
- The Recovery Orchestration Market reached USD 1.7 billion in 2025 and will hit USD 7.5 billion by 2035. at a CAGR of 16.2% from 2026 to 2035.
- By Component, Software leads with a 64.0% share.
- By Deployment Mode, Cloud-Based leads with a 42.0% share.
- By Organization Size, Large Enterprises lead with a 66.0% share.
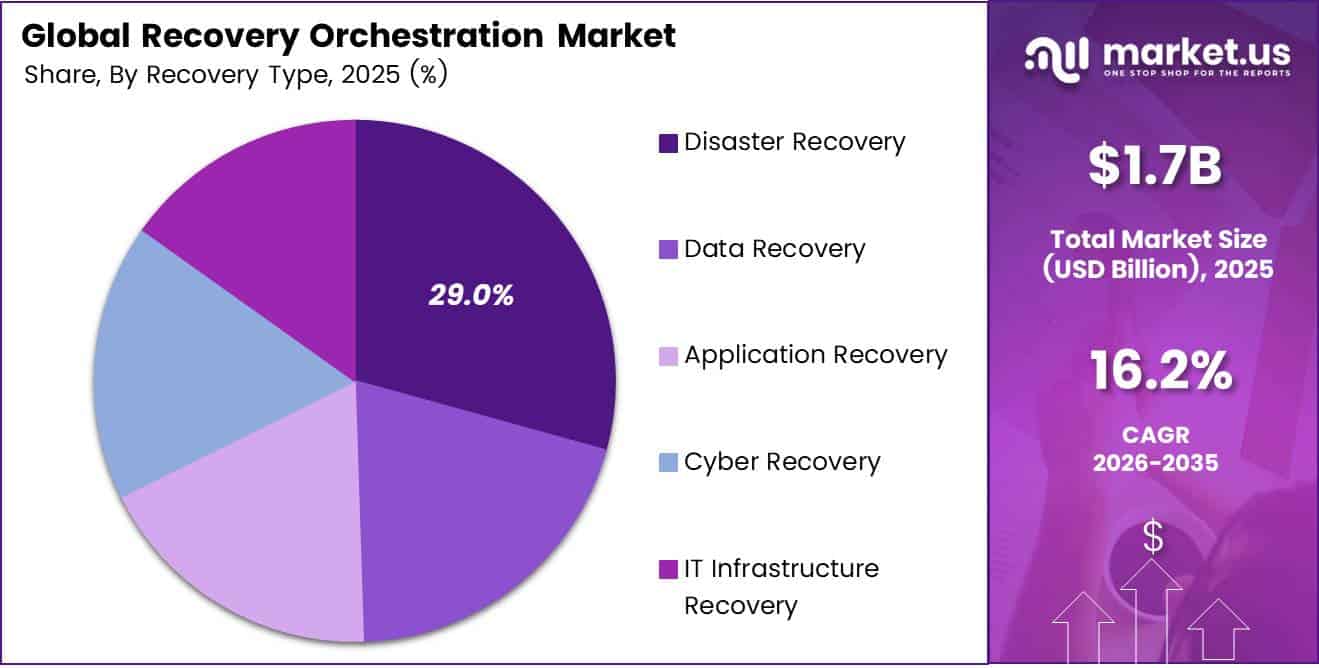
- By Recovery Type, Disaster Recovery leads with a 29.0% share.
- By Application, Data Protection and Backup leads with a 25.0% share.
- By End-Use Industry, BFSI leads with a 24.0% share.
- North America dominates with a 38.0% share and USD 0.7 billion in revenue.
By Component
Software dominates with 64.0% due to automated runbooks replacing manual recovery steps.
Software leads because buyers want one control layer that plans, tests, and runs every recovery step without manual work. Recovery tools plug straight into the cloud platforms that firms already pay for. In FY2025, Microsoft Cloud revenue rose 23% to $168.9 billion, so a huge share of business workloads now sits on platforms that need scripted failover and restore tools.
Bigger cloud estates also create demand for a single dashboard. Microsoft’s server products and cloud services revenue grew by $18.6 billion in one year. That growth adds new apps, databases, and systems that orchestration software must find, map, and protect.
Services, led by Managed Services, form the fastest-growing sub-segment. Many firms rely heavily on cloud tools but lack the staff to design and test recovery plans. Eurostat found that 75.3% of EU enterprises buying cloud services in 2023 described themselves as highly dependent on those services.
By Deployment Mode
Cloud-Based dominates with 42.0% due to pay-as-you-go standby sites cutting costs.
Cloud-Based deployment holds first place because firms no longer want to pay for a second data center that sits idle. A cloud standby site costs money only when teams test or use it. Eurostat reports that 52.74% of EU enterprises bought paid cloud services in 2025, so more than half of businesses already have accounts that a recovery platform can use right away.
Adoption keeps climbing as well. Between 2023 and 2025, that share rose by 7.42 percentage points, up from 45.2% in 2023. Every new cloud customer becomes a natural buyer of cloud-native failover. Hybrid is the fastest-growing deployment mode. Most firms still keep core systems, such as payment engines or plant controls, on their own servers while they move newer apps to the cloud.
By Organization Size
Large Enterprises dominate with 66.0% due to complex multi-site systems needing tested failover.
Large Enterprises lead because they run thousands of linked systems across many sites, and one failure can stop whole supply chains. These firms also have dedicated budgets and teams for resilience work. Eurostat data shows that 84.67% of large EU enterprises bought paid cloud services in 2025, up 6.9 percentage points from 2023, so their IT spans several environments that need coordinated recovery.
Board-level risk reviews add more pressure. Big firms must prove to auditors and insurers that they can restore key services within set time limits, and orchestration tools give them that proof. SMEs make up the fastest-growing segment. Smaller firms are moving to the cloud quickly, and this move makes simple, subscription-based recovery tools easy to buy.
Among small EU businesses, paid cloud use rose by 7.48 percentage points to 49.3%. Medium-sized firms moved from 59.09% to 66.78% over the same period. Vendors now sell ready-made recovery templates that need no in-house expert, so SMEs gain enterprise-grade protection at a monthly price they can afford.
By Recovery Type
Disaster Recovery dominates with 29.0% due to long-standing audit and regulatory testing rules.
Disaster Recovery holds the top spot because it is the oldest and most widely required recovery practice. Regulators, auditors, and insurers ask firms to keep tested plans for floods, fires, and power failures. The IMF warns that a single cyber or IT incident could cause a $2.5 billion loss about once every 10 years, which equals roughly 800% of an average firm’s operating income.
Cyber Recovery is the fastest-growing recovery type. Attackers now target backups first, so firms need isolated, clean copies and step-by-step rebuild plans. The FBI’s IC3 identified 67 new ransomware variants in 2024, and ransomware complaints from critical infrastructure rose 9% that year.
In 2025, IC3 logged more than 3,600 ransomware complaints with losses above $32 million, a figure that leaves out downtime and lost revenue. Buyers therefore choose orchestration tools that scan restore points for malware and bring systems back in a safe order.
By Application
Data Protection and Backup dominates with 25.0% due to every firm needing restorable data copies.
Data Protection and Backup leads because every organization, whatever its size or sector, needs clean copies of its data. Backup is the first building block that any orchestration platform automates. The IMF found that reported direct losses from cyber incidents have reached almost $28 billion since 2020, with billions of records stolen or damaged.
The same IMF study puts the median direct loss per firm at about $0.4 million. Loss risk at that scale makes regular, verified backups a fixed line in every IT budget. Cybersecurity and Ransomware Recovery is the fastest-growing application.
By End-Use Industry
Banking, Financial Services, and Insurance (BFSI) dominates with 24.0% due to strict uptime rules from regulators.
BFSI leads because banks, insurers, and payment firms cannot go offline even for a few minutes without harming customers and markets. Regulators set firm limits on recovery times and ask for regular proof through tests.
Financial firms have reported direct losses of almost $12 billion since 2004. This history keeps resilience spending high across the sector. Healthcare is the fastest-growing industry segment. Hospitals depend on digital records, imaging, and billing systems, and any outage puts patient care at risk.
The U.S. HHS Office for Civil Rights logged 663 large breaches that occurred in 2024, affecting about 242,908,056 individuals. Health care providers filed 505 of those reports, or 76% of the total.
Key Market Segments
By Component
- Software
- Services
- Professional Services
- Managed Services
By Deployment Mode
- Cloud-Based
- On-Premises
- Hybrid
By Organization Size
- Small and Medium-Sized Enterprises (SMEs)
- Large Enterprises
By Recovery Type
- Disaster Recovery
- Data Recovery
- Application Recovery
- Cyber Recovery
- IT Infrastructure Recovery
By Application
- Data Protection and Backup
- Business Continuity Management
- Cybersecurity and Ransomware Recovery
- Cloud Disaster Recovery
- IT Service Continuity
By End-Use Industry
- Banking, Financial Services, and Insurance (BFSI)
- IT and Telecommunications
- Healthcare
- Government and Public Sector
- Retail and E-commerce
- Manufacturing
- Energy and Utilities
- Others
Geopolitical Impact Analysis
Trade policy now raises the cost of recovery hardware. On 15 January 2026, the U.S. began charging a 25% Section 232 tariff on certain advanced computing chips and derivative products. Recovery sites run on servers, storage arrays, and backup appliances that use these chips. Higher import costs push up the price of on-premises and hybrid recovery builds.
Trade forecasts have also swung sharply. The WTO projected 2026 merchandise trade growth of just 1.9% in March 2026, down from 4.6% in 2025. It warned that the Middle East war could cut 0.5 percentage points from growth if energy prices stay high. By October 2026, the WTO raised its forecast to 3.9%, citing strong AI investment.
Shipping routes add delay and cost. Many vessels now avoid the Red Sea and sail around the Cape of Good Hope. The detour adds about 15 days of transit and up to USD 1,000 per twenty-foot container. The Suez Canal Authority also raised transit fees by 5% to 15%. Storage gear shipped from Asia to Europe arrives later and costs more.
WTO and UNCTAD data show world merchandise trade volume rose 3.2% year over year in the first quarter of 2026. AI servers now compete with backup hardware for the same chips and freight space. As a result, vendors push software-only and SaaS models. These let buyers recover to public cloud regions instead of waiting on new gear.
Regional Analysis
North America dominates the Recovery Orchestration Market, holding a 38.0% share and generating USD 0.7 billion in revenue. The U.S. drives most of this demand. Cyberattacks hit U.S. firms often and hit them hard.
The FBI IC3 counted 263,455 cyber threat complaints in 2024, with losses of USD 1.571 billion. It also found that 256,256 complaints reported an actual money loss, and the average reported loss reached USD 19,372. These numbers push boards to ask one clear question: how fast can we get back online? Recovery orchestration answers that question with tested, automated plans.
Asia Pacific is the fastest-growing region in the Recovery Orchestration Market. The WTO expects Asia’s merchandise import volume to grow 9.5% in 2026, the strongest of any region. Much of this trade comes from AI servers and data center gear. New data centers in China, Japan, South Korea, India, and Australia need recovery plans from day one.
Europe stands as a highly regulated market, led by Germany, France, and the UK. The EU Digital Operational Resilience Act (DORA) took effect. It covers 20 types of financial entities and their ICT third-party providers. This rule turns recovery testing into a legal duty. The ITU places Europe among regions where 88% to 93% of people use the internet, so digital services across Spain, Italy, and the rest of Europe need strong recovery plans.
Key Regions and Countries
North America
- US
- Canada
Europe
- Germany
- France
- The UK
- Spain
- Italy
- Rest of Europe
Asia Pacific
- China
- Japan
- South Korea
- India
- Australia
- Rest of APAC
Latin America
- Brazil
- Mexico
- Rest of Latin America
Middle East and Africa
- GCC
- South Africa
- Rest of MEA
Market Dynamics
Drivers
| Driver | (~) % Impact on CAGR Forecast | Geographic Relevance | Impact Timeline |
|---|---|---|---|
| Statutory Operational Resilience Mandates (DORA, NIS2, CPS 230) | +3.1% | Europe, Asia-Pacific, Global Financial Hubs | Short term (2 years or less) |
| Ransomware-Driven Cyber Recovery Spending | +2.6% | North America, Europe | Short term (2 years or less) |
| Hybrid and Multi-Cloud Workload Sprawl | +2.2% | Global | Medium term (2 to 4 years) |
| Post-Outage Board-Level Resilience Scrutiny | +1.8% | North America, Europe, Asia-Pacific | Short term (2 years or less) |
| Shift to Consumption-Based DRaaS Licensing | +1.4% | Global, SME-Dense Markets | Medium term (2 to 4 years) |
Statutory Operational Resilience Mandates (DORA, NIS2, CPS 230)
The root cause is the move from voluntary to legally binding recovery obligations. The EU Digital Operational Resilience Act became applicable on 17 January 2025 and covers more than 22,000 financial entities, according to European Supervisory Authorities scoping guidance.
Here is how the mandates turn into spending. Under DORA, firms must keep a register of ICT third parties, carry out threat-led penetration testing every 3 years and show that they can recover within defined tolerances. Under NIS2, penalties can reach €10 million or 2% of global turnover, per the directive’s enforcement provisions.
Investor disclosures from leading data-protection vendors point to annual recurring revenue growing faster than perpetual licence revenue, often at 20% or more, along with shorter sales cycles in regulated banking and insurance accounts.
Restraints
| Restraint | (~) % Impact on CAGR Forecast | Geographic Relevance | Impact Timeline |
|---|---|---|---|
| Constrained IT Budgets Under Elevated Interest Rates | -1.6% | Global, Mid-Market Enterprises | Short term (2 years or less) |
| Data Sovereignty and Cross-Border Replication Limits | -1.2% | Europe, China, India, Middle East | Medium term (2 to 4 years) |
| Legacy Mainframe and On-Premises Incompatibility | -0.9% | North America, Japan, Europe | Medium term (2 to 4 years) |
| High Upfront Integration and Migration Costs | -0.7% | Emerging Markets, SMEs | Short term (2 years or less) |
| Public Sector Procurement Freezes | -0.5% | North America, Europe | Short term (2 years or less) |
Constrained IT Budgets Under Elevated Interest Rates
The root cause is the cost of capital. Federal Reserve policy rates stayed in the 5.25–5.50% range through most of 2024, and later cuts left real borrowing costs above the averages of the prior decade. ECB deposit rates stayed restrictive above 3% until mid-2025, per European Central Bank policy records.
The business impact is delayed CapEx and pressure on vendor margins. Buyers ask for discounts of 15–25% on multi-year contracts, and vendors fund proof-of-concept pilots themselves. This pushes customer acquisition costs up while revenue recognition slips into later quarters.
Challenges
| Challenge | (~) % CAGR Friction Drag | Geographic Relevance | Mitigation Horizon |
|---|---|---|---|
| Resilience Engineering Talent Shortage | -1.3% | Global | Long term (4 years or more) |
| Runbook Drift and Configuration Decay | -1.0% | Global | Medium term (2 to 4 years) |
| Backup Infrastructure Targeted by Attackers | -0.8% | North America, Europe | Medium term (2 to 4 years) |
| Cross-Vendor API Interoperability Gaps | -0.6% | Global | Medium term (2 to 4 years) |
| Third-Party Concentration Risk Exposure | -0.5% | Global Financial Hubs | Long term (4 years or more) |
Resilience Engineering Talent Shortage
The structural weakness is a shortage of skilled people. ISC2 workforce studies estimate the global cybersecurity workforce gap at about 4.8 million professionals in 2024. Staff who combine site reliability engineering, cloud architecture, and incident-recovery skills are an even smaller group.
US Bureau of Labor Statistics projections show information security roles growing about 32% over the decade, well ahead of the supply of graduates. The friction is measurable. Orchestration platforms are often under-configured, with only 30–40% of critical applications fully mapped into automated recovery workflows.
Recovery-time objectives drift away from tested reality. ISC2 survey data also shows salary inflation of 8–12% a year for senior resilience engineers. Vendors will need to make long-term adjustments. These include AI-assisted dependency discovery, managed recovery services that absorb skills risk on the customer’s behalf, and certification programmes run with industry bodies.
Opportunities
| Opportunity | (~) % Potential CAGR Upside | Geographic Relevance | Execution Window |
|---|---|---|---|
| Agentic AI Autonomous Recovery Orchestration | +2.4% | North America, Europe, Asia-Pacific | Medium term (2 to 4 years) |
| Resilience-as-a-Service for SMEs via MSPs | +1.9% | Asia-Pacific, Latin America, Africa | Medium term (2 to 4 years) |
| Cyber Insurance-Linked Recovery Validation | +1.5% | North America, Europe | Short term (2 years or less) |
| OT and Industrial Control System Recovery | +1.2% | Global Manufacturing and Energy Hubs | Long term (4 years or more) |
| Sovereign Cloud Recovery Roll-Up Acquisitions | +0.9% | Europe, Middle East, India | Medium term (2 to 4 years) |
Agentic AI Autonomous Recovery Orchestration
This is white space rather than a current driver. Today’s platforms run pre-scripted runbooks that a person has to trigger and supervise. IBM breach-cost research for 2024 puts average breach lifecycles at about 258 days and average breach costs at $4.88 million. Organisations that use automation extensively saved about $2.2 million per incident, which shows how much value remains uncaptured.
The unit economics could shift substantially. Agentic orchestration could cut human recovery hours by 50–70% and bring effective recovery-time objectives down from days to under 4 hours. Sophos ransomware surveys put average recovery costs, excluding ransom, at about $2.73 million, and the cost of each recovery event would fall as labour drops out.
Vendors could add premium autonomy tiers priced 20–30% above standard SaaS subscriptions. Gross margins could expand by 5–8 percentage points as delivery depends less on services. SEC filings from leading cloud data-protection providers already show AI-feature attach rates building.
Key Players Analysis
Tier 1 leaders combine scale, large recurring revenue, and global reach. Rubrik leads on growth. It posted fiscal 2026 total revenue of USD 1.32 billion, up 48%. Its subscription revenue reached USD 1.26 billion, and subscription ARR hit USD 1.46 billion as of 31 January 2026. Rubrik also generated USD 237.8 million in free cash flow, which gives it room to fund new products.
Commvault holds the other top pure-play position. It reported fiscal 2026 revenue of USD 1,184 million, up 19%. Total ARR grew 21% to USD 1,122 million. SaaS revenue jumped 52% to USD 333 million, which shows fast customer movement to cloud delivery. Commvault earned non-GAAP EBIT of USD 238 million, a 20.1% margin, and produced USD 237 million in free cash flow.
Veeam, Microsoft, IBM, Broadcom, OpenText, and HPE Zerto also hold Tier 1 positions through global footprints and large installed bases. Microsoft, IBM, Broadcom, and OpenText bundle recovery tools into wider cloud, infrastructure, and software stacks, so a single purchase often reaches thousands of enterprise seats.
Tier 2 challengers win on focus. Cohesity and Druva compete in cloud and SaaS data protection. Semperis targets identity and Active Directory recovery, a key step in ransomware response. Quest Software, Infrascale, Perpetuuiti, and RackWare serve niche needs such as recovery automation, SME backup, and workload migration.
Top Key Players in the Market
- Veeam Software Group GmbH
- Hewlett Packard Enterprise Company (HPE Zerto)
- Commvault Systems, Inc.
- Rubrik, Inc.
- Druva Inc.
- Cohesity, Inc.
- Broadcom Inc.
- IBM Corporation
- Microsoft Corporation
- OpenText Corporation
- Quest Software Inc.
- Semperis Inc.
- Infrascale, Inc.
- Perpetuiti Co. Ltd.
- RackWare, Inc.
Recent Developments
- In October 2025, Veeam Software signed a definitive agreement to acquire Securiti AI, a Data Security Posture Management leader, for USD 1.725 billion.
- In December 2025, Rubrik reported third quarter fiscal 2026 revenue of USD 350.2 million, up 48%, with subscription ARR of USD 1.35 billion.
- In October 2026, Commvault Systems reported second quarter fiscal 2027 revenue of USD 312.4 million, up 13%, and guided full-year subscription ARR to USD 1,205 million to USD 1,215 million.
Report Scope
| Report Features | Description |
|---|---|
| Market Value (2025) | USD 1.7 Billion |
| Forecast Revenue (2035) | USD 7.5 Billion |
| CAGR (2026-2035) | 16.2% |
| Base Year for Estimation | 2025 |
| Historic Period | 2020-2024 |
| Forecast Period | 2026-2035 |
| Report Coverage | Revenue Forecast, Market Dynamics, Competitive Landscape, Recent Developments |
| Segments Covered | By Component (Software, Services, Professional Services, Managed Services); By Deployment Mode (Cloud-Based, On-Premises, Hybrid); By Organization Size (Small and Medium-Sized Enterprises (SMEs), Large Enterprises); By Recovery Type (Disaster Recovery, Data Recovery, Application Recovery, Cyber Recovery, IT Infrastructure Recovery); By Application (Data Protection and Backup, Business Continuity Management, Cybersecurity and Ransomware Recovery, Cloud Disaster Recovery, IT Service Continuity); By End-Use Industry (Banking, Financial Services, and Insurance (BFSI), IT and Telecommunications, Healthcare, Government and Public Sector, Retail and E-commerce, Manufacturing, Energy and Utilities, Others) |
| Regional Analysis | North America – US, Canada; Europe – Germany, France, The UK, Spain, Italy, Rest of Europe; Asia Pacific – China, Japan, South Korea, India, Australia, Singapore, Rest of APAC; Latin America – Brazil, Mexico, Rest of Latin America; Middle East & Africa – GCC, South Africa, Rest of MEA |
| Competitive Landscape | Veeam Software Group GmbH, Hewlett Packard Enterprise Company (HPE Zerto), Commvault Systems, Inc., Rubrik, Inc., Druva Inc., Cohesity, Inc., Broadcom Inc., IBM Corporation, Microsoft Corporation, OpenText Corporation, Quest Software Inc., Semperis Inc., Infrascale, Inc., Perpetuuiti Co. Ltd., RackWare, Inc. |
| Customization Scope | Customization for segments, region/country-level will be provided. Moreover, additional customization can be done based on the requirements. |
| Purchase Options | We have three licenses to opt for: Single User License, Multi-User License (Up to 5 Users), Corporate Use License (Unlimited Users and Printable PDF) |