Report Overview
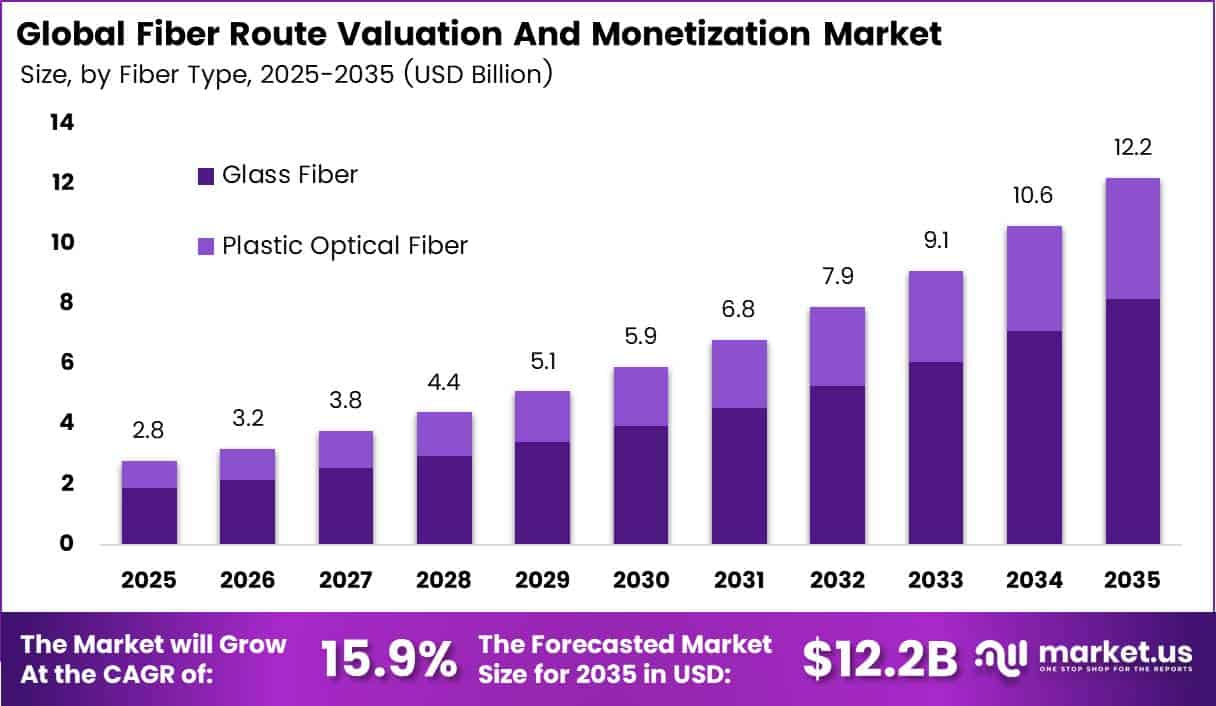
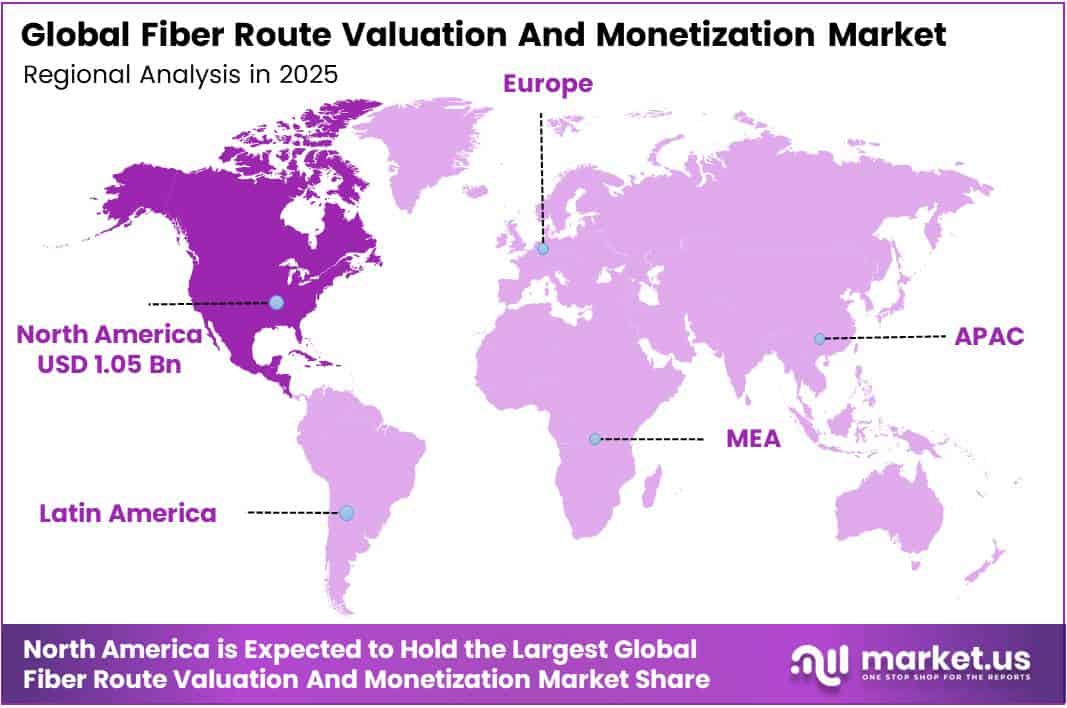
In 2025, the Global Fiber Route Valuation And Monetization Market was valued at USD 2.8 billion. The market is projected to grow at a CAGR of 15.9% during 2026–2035, reaching approximately USD 12.2 billion by 2035. North America dominated the global market in 2025, accounting for more than 37.6% of the total market share and generating approximately USD 1.05 billion in revenue.
More users online means more traffic, and more traffic makes fiber routes worth more. According to the ITU, 6.1 billion people used the internet in 2025. That equals 74% of the world’s population. The ITU also counted 200 million new users in a single year. Every new user adds load to metro, long-haul, and subsea routes.
The North America region has a large and growing base of fiber assets. The Fiber Broadband Association reports that 88.1 million U.S. households can now get fiber, or 56.5% of all homes. Builders passed 10.3 million homes in 2024 alone. Big carriers keep adding route miles too. Lumen deployed 17 million intercity fiber miles by year-end 2025 and plans about 58 million miles by 2031.
Key Takeaways
- The Fiber Route Valuation and Monetization Market was worth USD 2.8 billion in 2025 and will reach USD 12.2 billion by 2035. at a CAGR of 15.9% from 2026 to 2035.
- By fiber type, Glass Fiber leads with a 67.3% share and is also the fastest-growing sub-segment.
- By mode, Single-mode Fiber leads with a 63.5% share.
- By network type, Metro Networks lead with a 41.2% share.
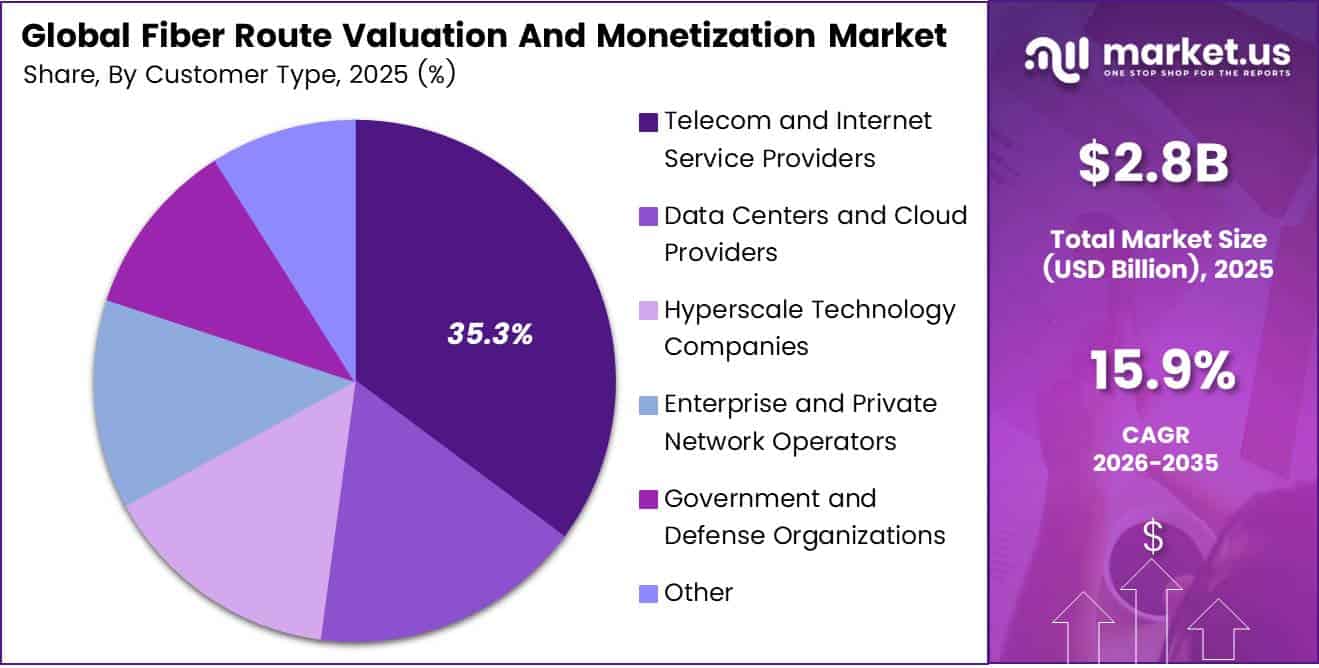
- By customer type, Telecom and Internet Service Providers lead with a 35.3% share.
- By application, Data Transmission and Telecommunications lead with a 28.3% share.
- North America leads with a 37.6% share and USD 1.05 billion in revenue.
By Fiber Type
Glass Fiber dominates with 67.3% due to low signal loss over distance.
Glass fiber leads because carriers, utilities, and investors treat it as the long-life asset behind every valuable route. Buyers and lenders price a route by how much traffic it can carry for decades, and glass fiber delivers low signal loss over very long distances. OECD data shows that fibre now makes up 51% of all fixed broadband subscriptions across member countries, up from 31% in 2020.
Glass fiber also grows fastest, because the strongest markets keep pushing fibre toward full coverage. Iceland reached a 96% fibre share, and Korea hit 92% in 2025, which shows how far upgrades can go once operators commit. Each new subscriber adds steady revenue to the route and lifts its sale or lease value.
By Mode
Single-mode Fiber dominates with 63.5% due to long reach across city networks.
Single-mode fiber holds the top spot because it carries light signals over many kilometers with almost no loss, which makes it the standard for access and backbone builds. The Fiber Broadband Association reports that U.S. builders passed a record 11.8 million homes in 2025, and fiber now reaches more than 60% of U.S. households. Nearly every one of those lines runs on single-mode glass.
Canada adds more scale, with 14.5 million fiber passings covering close to 75% of homes. These large footprints give owners clear, long-term cash flows that support route valuation. Investors favor these single-mode assets because subscribers stay connected for years.
Multi-mode fiber grows fastest because AI data centers need huge numbers of short, low-cost links between servers and switches. The IEA notes that a typical AI-focused data center uses as much power as 100,000 households, while the largest sites under construction will use 20 times as much.
By Network Type
Metro Networks dominate with 41.2% due to dense business and cloud demand clusters.
Metro networks lead since cities hold the densest mix of offices, cell towers, and data centers, so every route kilometer can serve many paying tenants. Operators lease dark fiber and wavelengths to several buyers on the same ring, which raises revenue per route. OECD figures show fixed broadband penetration rising from 33 to 37 subscriptions per 100 inhabitants between 2020 and 2025, and most of that demand flows through metro rings.
Submarine networks grow fastest because cloud and content firms need more capacity between continents. ITU estimates that nearly 200,000 km of new submarine cable went into service in 2024, and more than 500 active and planned systems now span the globe. These cables carry about 99% of the world’s internet traffic, so investors see them as scarce, high-value assets.
By Customer Type
Telecom and Internet Service Providers dominate with 35.3% due to the largest installed base of fiber routes.
Telecom and internet service providers lead because they own and run most of the fiber already in the ground. They value routes to raise capital, sell non-core assets, or lease spare strands to other carriers. The OECD counted 504 million fixed broadband subscriptions across member countries in June 2024, after a gain of 39.7 million, and telecom operators serve most of these users.
Hyperscale technology companies grow fastest because AI forces them to build and buy fiber at record speed. Alphabet’s annual report shows capital spending rising from $52.5 billion in 2024 to $91.4 billion in 2025, and the company expects a further sharp increase in 2026. Much of that money goes to servers, network gear, and data centers that need private fiber links.
By Application
Data Transmission and Telecommunications dominates with 28.3% due to constant growth in mobile data traffic.
Data transmission and telecommunications hold the largest share because every call, stream, and app session travels over fiber at some point. Mobile growth keeps this demand high. Ericsson reports that global 5G subscriptions passed 3.1 billion in the first quarter of 2026, and 5G networks carried 48% of all mobile data traffic at the end of 2025.
Data center interconnect grows fastest because cloud and AI workloads spread across many linked sites. The IEA puts data center electricity use at about 415 TWh in 2024, or 1.5% of global power demand, after growing 12% per year over five years. That load points to a fast rise in facilities, and each one needs high-capacity fiber links to its peers.
Key Market Segments
By Fiber Type
- Glass Fiber
- Plastic Optical Fiber
By Mode
- Single-mode Fiber
- Multi-mode Fiber
By Network Type
- Metro Networks
- Sell-Side Vendor Due Diligence
- Long-Haul Networks
- Submarine Networks
- Local Access and Fiber-to-the-Building Networks
By Customer Type
- Telecom and Internet Service Providers
- Data Centers and Cloud Providers
- Hyperscale Technology Companies
- Enterprise and Private Network Operators
- Government and Defense Organizations
- Other
By Application
- Data Transmission and Telecommunications
- Data Center Interconnect
- Enterprise Networking
- 5G Backhaul and Fronthaul
- Industrial Automation
- Military and Defense Communications
- Network Redundancy and Disaster Recovery
Geopolitical Impact Analysis
Trade friction between the U.S. and China raises the cost of building and replacing fiber routes. The USTR applied Section 301 tariffs of 7.5% to 25% on about USD 370 billion of Chinese imports. These include optical instruments and electrical equipment used in fiber networks. Higher replacement costs push up the value of routes already in the ground.
The 2024 four-year review added tariffs of 25% to 100% on some goods, with new rates taking effect in January 2025 and January 2026. A second review began in May 2026. That keeps import costs for transceivers, splicing gear, and cable parts uncertain. Valuation teams now build tariff risk into their build-cost models.
Shipping problems also hit the logistics for subsea and long-haul projects. UNCTAD reports that ships still avoid the Suez Canal and sail around the Cape of Good Hope. This reroute adds about 10 to 14 days per voyage. Cable ships, cable drums, and repeaters arrive later, so submarine projects take longer. Delays raise prices on routes that already carry traffic.
Tariffs and longer transit times shift buyer demand toward existing routes with spare capacity. Owners can sell dark fiber or long-term capacity rights at higher prices than before. As a result, trade risk now directly influences how buyers and sellers price fiber assets.
Regional Analysis
North America dominates the Fiber Route Valuation and Monetization Market, holding a 37.6% share and generating USD 1.05 billion in revenue. Strong public funding and active private capital drive this lead. The NTIA runs the BEAD program, a USD 42.45 billion federal grant plan. It set funding for all 56 U.S. states and territories in June 2023.
These funds pay for new middle-mile and last-mile fiber, and every new build adds routes that owners must value. The FCC reports that 19.6 million Americans still lack fixed broadband at 100/20 Mbps. This gap keeps the build pipeline full for years. Carriers also sell route capacity to AI and cloud firms.
Asia Pacific is the fastest-growing region in the market. Strong mobile growth drives new fiber demand across China, Japan, South Korea, India, and Australia. The ITU reports that 5G subscriptions worldwide reached 3 billion, and Asia makes up a large part of that base. Every 5G site needs fiber backhaul, which adds new metro routes.
Europe holds a mature position with steady demand. The ITU reports that 93% of people in high-income countries use the internet, and most European markets fall in this group. High usage keeps traffic on routes in Germany, France, the UK, Spain, and Italy steady. Infrastructure funds buy and merge regional fiber platforms across the continent.
Key Regions and Countries
North America
- US
- Canada
Europe
- Germany
- France
- The UK
- Spain
- Italy
- Rest of Europe
Asia Pacific
- China
- Japan
- South Korea
- India
- Australia
- Rest of APAC
Latin America
- Brazil
- Mexico
- Rest of Latin America
Middle East and Africa
- GCC
- South Africa
- Rest of MEA
Market Dynamics
Drivers
| Driver | (~) % Impact on CAGR Forecast | Geographic Relevance | Impact Timeline |
|---|---|---|---|
| Hyperscale AI Data Center Interconnect Demand | +3.1% | North America, Europe, Asia Pacific | Short term (2 years or less) |
| Long-Haul Dark Fiber IRU Leasing Revival | +2.2% | North America, Europe | Short term (2 years or less) |
| Infrastructure Fund Fiber Carve-Outs | +1.8% | Global | Medium term (2 to 4 years) |
| Telecom Balance Sheet Deleveraging | +1.5% | Europe, North America, Latin America | Short term (2 years or less) |
| Public Broadband Subsidy Deployment | +1.2% | United States, India, European Union | Medium term (2 to 4 years) |
| Route Diversity Mandates for Resilience | +0.8% | North America, Europe, Middle East | Medium term (2 to 4 years) |
Hyperscale AI Data Center Interconnect Demand
AI training clusters have changed how operators value fiber routes. Pricing used to depend mostly on per-wavelength lit services, but buyers now pay premium IRU and multi-decade dark fiber prices for low-latency, high-count routes between campuses with lots of power.
Per Lumen Technologies’ earnings disclosures, the company signed roughly $8.5 billion in private connectivity fabric deals with hyperscalers through 2024 and 2025. Per Zayo Group investor communications, the company committed to building more than 5,000 new long-haul route miles to serve AI demand.
Hyperscaler capex lines in Microsoft, Alphabet, Amazon, and Meta SEC filings together topped $350 billion annually in 2025. Each GPU campus needs interconnects of 432 to 864 fiber counts, and per Fiber Broadband Association construction benchmarks, build costs run from about $60,000 to $100,000 per route mile.
As a result, owners now get 20– to 30-year contracted cash flows, with 60% to 70% paid upfront. Those cash flows are being valued at infrastructure-style EBITDA multiples of 15x to 20x rather than telecom-style multiples of 6x to 8x.
Restraints
| Restraint | (~) % Impact on CAGR Forecast | Geographic Relevance | Impact Timeline |
|---|---|---|---|
| Elevated Cost of Capital | -1.9% | Global | Short term (2 years or less) |
| Right-of-Way Permitting Gridlock | -1.4% | United States, India, European Union | Medium term (2 to 4 years) |
| Foreign Investment Screening Blocks | -0.9% | United States, European Union, United Kingdom | Short term (2 years or less) |
| Encumbered Legacy Asset Titles | -0.7% | North America, Latin America | Medium term (2 to 4 years) |
| Regulated Wholesale Price Caps | -0.6% | European Union, Asia Pacific | Long term (4 years or more) |
Elevated Cost of Capital
Fiber route valuations rely on discounted cash flows over 20 to 30 years, so they react strongly to changes in the risk-free rate. US Federal Reserve policy rate data show the federal funds rate held above 4% through most of 2025.
ECB deposit rate records show European rates stayed near 2%, well above the near-zero levels of 2021, when many carve-outs were priced. US Treasury yield curve data puts the 10-year yield at 4.0% to 4.5%. As a rule of thumb, each 100 basis point increase in WACC cuts the present value of a 25-year IRU stream by roughly 10% to 14%.
That has produced bid-ask spreads of 1.5x to 3x EBITDA in secondary fiber deals. Leveraged buyers relying on financing at SOFR plus 300 to 450 basis points have postponed closings or demanded earn-outs. Per the operators’ annual reports, several European carrier fiber sales, including stalled processes at Telefónica and Telecom Italia affiliates, were repriced or withdrawn.
Challenges
| Challenge | (~) % CAGR Friction Drag | Geographic Relevance | Mitigation Horizon |
|---|---|---|---|
| Skilled Splicing Labor Shortage | -1.2% | United States, Europe, India | Medium term (2 to 4 years) |
| Opaque Route Valuation Benchmarks | -0.9% | Global | Medium term (2 to 4 years) |
| Optical Cable Supply Tightness | -0.8% | North America, Asia Pacific | Short term (2 years or less) |
| Fiber Cuts and Sabotage Risk | -0.6% | Europe, Middle East, South Asia | Long term (4 years or more) |
| Legacy GIS Data Gaps | -0.5% | North America, Latin America, Africa | Medium term (2 to 4 years) |
Skilled Splicing Labor Shortage
Route monetization depends on how quickly operators can build laterals, splice in customers, and certify capacity, and the people who do that work are scarce. Per Fiber Broadband Association workforce assessments, the US needs about 200,000 additional fiber technicians over the BEAD deployment cycle.
Per NTIA program guidance, BEAD’s $42.45 billion allocation competes for the same crews that hyperscaler long-haul builds use. US Bureau of Labor Statistics wage data shows telecom line installer pay rising about 5% to 7% a year.
Contractors report lateral turn-up lead times stretching from 60 to 120 days or more. That delay pushes back revenue recognition on new IRUs and cuts first-year route yields by an estimated 8% to 12%. To cope, operators are moving toward in-house training academies, high-fiber-count ribbon cable that cuts splice time by about 40%, and multi-year framework agreements with contractors.
Opportunities
| Opportunity | (~) % Potential CAGR Upside | Geographic Relevance | Execution Window |
|---|---|---|---|
| Utility and Rail Right-of-Way Fiber Monetization | +2.0% | North America, India, Europe | Medium term (2 to 4 years) |
| Fiber Asset-Backed Securitization | +1.4% | United States, Europe | Short term (2 years or less) |
| Distributed Acoustic Sensing Services | +0.9% | Global | Long term (4 years or more) |
| Regional Fiber Roll-Up Consolidation | +0.8% | North America, Europe | Medium term (2 to 4 years) |
| Emerging Market Neutral-Host Backbones | +0.7% | South Asia, Africa, Southeast Asia | Long term (4 years or more) |
Utility and Rail Right-of-Way Fiber Monetization
Electric utilities, pipelines, and railways own large networks of OPGW and trackside fiber, but most of it is booked as internal operating infrastructure, not as an asset that earns revenue. That makes it untapped white space rather than a current driver.
Per US Energy Information Administration grid data, US transmission lines span more than 700,000 circuit miles. Per Indian Railways disclosures, RailTel controls optical fiber on more than 62,000 route kilometers. According to utility regulatory filings, only a small share of strands, often under 20%, is leased commercially.
Monetizing this fiber is still uncommon because regulated utilities face rate-base sharing rules and FERC and state commission approvals, and most lack wholesale sales teams. Selling excess strands on routes that already exist avoids new-build costs of $60,000 or more per route mile.
That could lift incremental EBITDA margins to 70% to 80% and cut cost per delivered fiber pair by roughly 50% to 65% compared with greenfield builds. Joint ventures or concession structures that take these assets off the utilities’ books could add a meaningful amount of high-margin capacity to the market.
Key Players Analysis
Tier 1 leaders include AT&T, Verizon, Lumen, and Zayo. They own the largest U.S. route footprints and lead the biggest fiber deals. Verizon paid about USD 9.8 billion in cash for Frontier and took on about USD 12.9 billion of debt at fair value. It then repaid about USD 12.4 billion of that principal within nine months. The deal gave Verizon about 30 million fiber passings across 31 states.
Lumen has refocused on enterprise and AI traffic. The company cut annual interest costs by about USD 500 million and cut capex by about USD 1 billion. Its route sales to hyperscalers fund its network growth. AT&T bought Lumen’s consumer fiber assets, which shows how carriers now split route portfolios between buyers.
Zayo grows through financial sponsors. DigitalBridge and EQT bought Zayo for USD 14.3 billion in 2019. Zayo later agreed to buy Crown Castle’s Fiber Solutions business, while EQT agreed to buy Crown Castle’s Small Cells unit. The two deals have a combined value of USD 8.5 billion. Crown Castle will exit fiber and keep its tower business.
Tier 2 challengers include Comcast, Cogent, Colt, EXA Infrastructure, Arelion, euNetworks, and FirstLight Fiber. These firms hold strong regional or niche positions. Colt, EXA, and euNetworks focus on European long-haul and metro routes. Arelion runs a global IP backbone. FirstLight serves the U.S. Northeast, and Cogent sells wavelength and dark fiber capacity.
Top Key Players in the Market
- AT&T Inc.
- Lumen Technologies, Inc.
- Zayo Group Holdings, Inc.
- Colt Technology Services Group Limited
- Verizon Communications Inc.
- Crown Castle Inc.
- Comcast Corporation
- Cogent Communications Holdings, Inc.
- EXA Infrastructure
- Arelion Sweden AB
- euNetworks Group Limited
- FirstLight Fiber, Inc.
Recent Developments
- In March 2025, Zayo agreed to buy Crown Castle’s Fiber Solutions business in a deal that values the business at about USD 4.25 billion.
- In May 2025, AT&T agreed to buy Lumen’s Mass Markets fiber business in 11 states for USD 5.75 billion in cash. AT&T completed its purchase of Lumen’s consumer fiber business, adding more than 1 million fiber customers and more than 4 million fiber-enabled locations.
- In January 2026, Verizon closed its USD 20 billion purchase of Frontier Communications after receiving final approval from California regulators.
- In February 2026, Lumen reported nearly USD 13 billion in total Private Connectivity Fabric contracts, including a deal to expand Anthropic’s fiber network across North America.
Report Scope
| Report Features | Description |
|---|---|
| Market Value (2025) | USD 2.8 Billion |
| Forecast Revenue (2035) | USD 12.2 Billion |
| CAGR (2026-2035) | 15.9% |
| Base Year for Estimation | 2025 |
| Historic Period | 2020-2024 |
| Forecast Period | 2026-2035 |
| Report Coverage | Revenue Forecast, Market Dynamics, Competitive Landscape, Recent Developments |
| Segments Covered | By Fiber Type (Glass Fiber, Plastic Optical Fiber); By Mode (Single-mode Fiber, Multi-mode Fiber); By Network Type (Metro Networks, Sell-Side Vendor Due Diligence, Long-Haul Networks, Submarine Networks, Local Access and Fiber-to-the-Building Networks); By Customer Type (Telecom and Internet Service Providers, Data Centers and Cloud Providers, Hyperscale Technology Companies, Enterprise and Private Network Operators, Government and Defense Organizations, Other); By Application (Data Transmission and Telecommunications, Data Center Interconnect, Enterprise Networking, 5G Backhaul and Fronthaul, Industrial Automation, Military and Defense Communications, Network Redundancy and Disaster Recovery) |
| Regional Analysis | North America – US, Canada; Europe – Germany, France, The UK, Spain, Italy, Rest of Europe; Asia Pacific – China, Japan, South Korea, India, Australia, Singapore, Rest of APAC; Latin America – Brazil, Mexico, Rest of Latin America; Middle East & Africa – GCC, South Africa, Rest of MEA |
| Competitive Landscape | AT&T Inc., Lumen Technologies, Inc., Zayo Group Holdings, Inc., Colt Technology Services Group Limited, Verizon Communications Inc., Crown Castle Inc., Comcast Corporation, Cogent Communications Holdings, Inc., EXA Infrastructure, Arelion Sweden AB, euNetworks Group Limited, FirstLight Fiber, Inc. |
| Customization Scope | Customization for segments and region/country-level will be provided. Moreover, additional customization can be done based on the requirements. |
| Purchase Options | We have three licenses to opt for: Single User License, Multi-User License (Up to 5 Users), Corporate Use License (Unlimited Users and Printable PDF) |