Report Overview
In 2025, the Global Cross-Border Fiber Route Market was valued at USD 21.1 billion. The market is projected to grow at a CAGR of 10.2% during 2026–2035, reaching approximately USD 55.7 billion by 2035. North America dominated the global market in 2025, accounting for more than 32.7% of the total market share and generating approximately USD 6.9 billion in revenue.
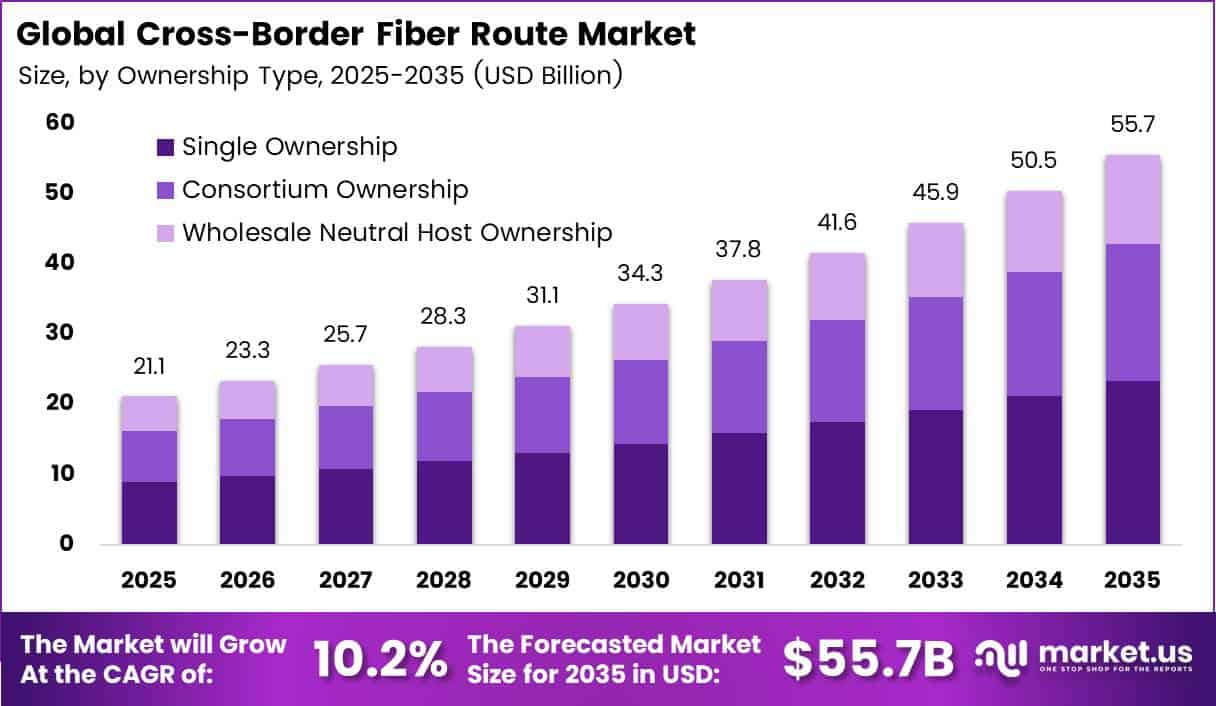
Rising internet use drives this growth. The ITU reported that about 6 billion people used the internet in 2025. That equals 74% of the world’s population, up from 71% a year earlier. Every new user adds traffic that must cross borders between cloud regions, content hubs, and carrier networks.
The ITU also states that submarine cables carry over 99% of all international data flows. As a result, carriers, hyperscalers, and data center operators keep buying more long-haul wavelengths, dark fiber pairs, and IRUs to link markets on different continents.
The North America region holds the densest long-haul fiber base in the world, and private capital keeps adding to it. Zayo reported that its North American network now spans 224,000 route miles, backed by more than USD 35 billion in total network investment. These routes link major US cloud clusters to Canadian and Mexican gateways and to transatlantic and transpacific landing stations.
Key Takeaways
- The Cross-Border Fiber Route Market reached USD 21.1 billion in 2025 and will reach USD 55.7 billion by 2035. grow at a CAGR of 10.2% from 2026 to 2035.
- By service type, International Transport and Carrier Transit lead with a 37.6% share.
- By network type, Terrestrial Cross-Border Fiber Backbone leads with a 46.2% share.
- By ownership type, Single Ownership leads with a 42.3% share.
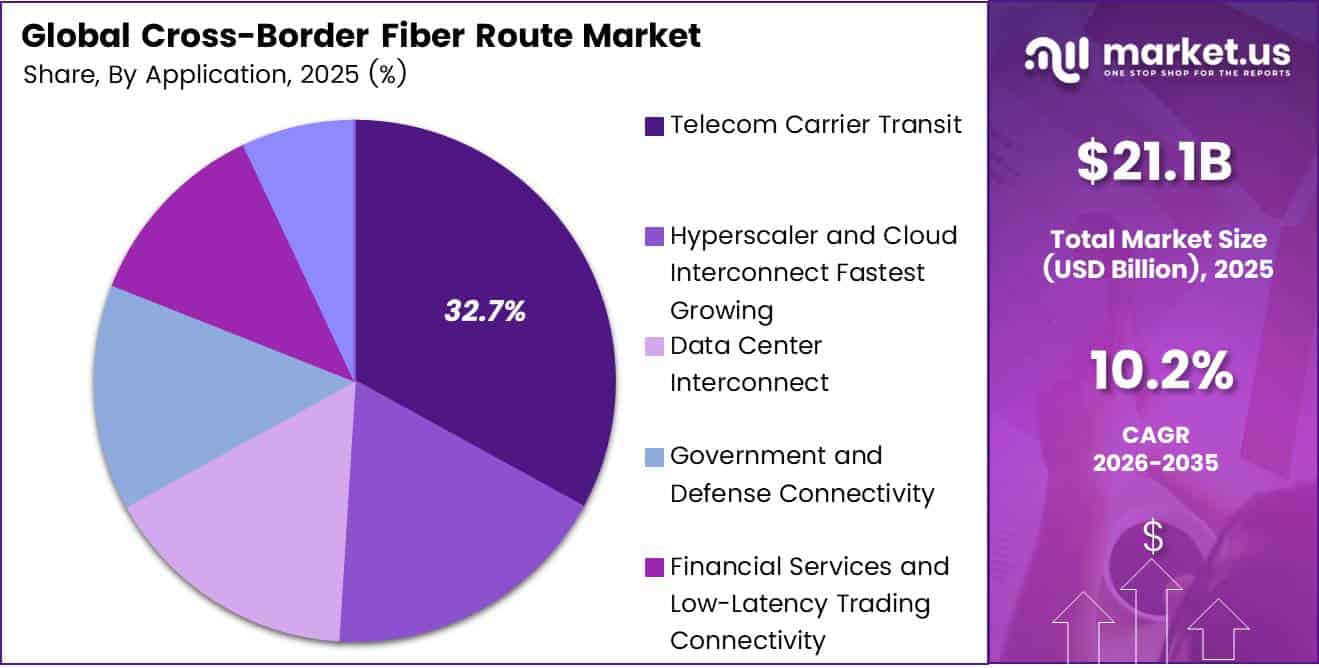
- By application, Telecom Carrier Transit leads with a 32.7% share.
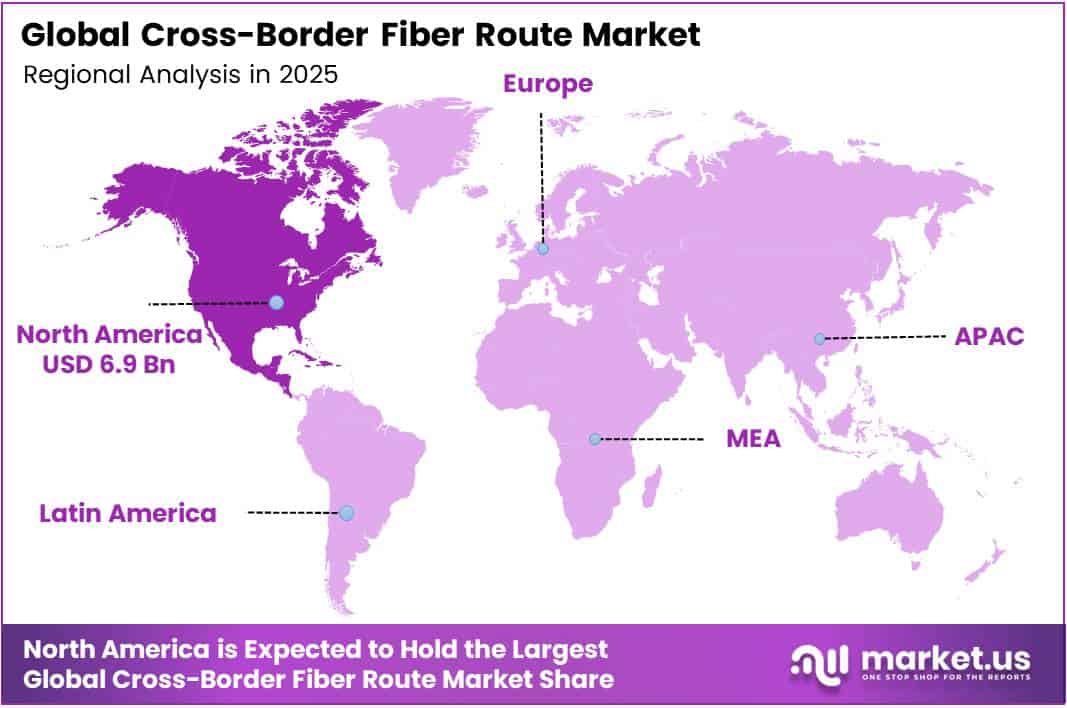
- North America leads with a 32.7% share and USD 6.9 billion in revenue.
By Service Type
International Transport and Carrier Transit dominates with 37.6% due to steady global carrier traffic exchange needs.
International Transport and Carrier Transit holds the top spot because every carrier needs a reliable way to move traffic between countries. ITU data shows that each internet user worldwide used 322.8 kbit/s of international bandwidth in 2025, up from 276.1 kbit/s a year earlier. That jump of about 17% pushes carriers to buy more transit on proven routes.
Dark Fiber and Fiber-Pair IRUs grow fastest because large buyers now want long-term rights to raw fiber instead of shared circuits. Lumen added more than 2.2 million new intercity fiber miles in 2025 and finished IRU conduit work across 55 more routes. These deals let cloud firms and carriers light fiber with their own gear, set their own speeds, and lock in costs over long contract terms. =
By Network Type
Terrestrial Cross-Border Fiber Backbone dominates with 46.2% due to lower build cost over land.
Terrestrial Cross-Border Fiber Backbone leads because land routes cost less to build than sea routes, and most neighboring countries share land borders. Lumen reached 17 million intercity fiber miles in 2025, and its 400G network now spans more than 100,000 route miles. Large land backbones like this feed straight into border crossings.
Hybrid Terrestrial-Submarine Backbone grows fastest because many countries cannot reach the sea on their own. ITU data shows that international bandwidth per user in landlocked developing countries rose from 23.9 kbit/s to 153.3 kbit/s across its ten-year series, yet it still sits below half the world average. The World Bank now backs cross-border land links for landlocked nations such as Malawi, tied to subsea cable landings.
By Ownership Type
Single Ownership dominates with 42.3% due to full route control for operators.
Single Ownership leads because one owner can plan, build, and upgrade a route without waiting for partners. Alphabet spent $91.4 billion on capital spending in 2025, up from $52.5 billion in 2024, mostly on servers, network gear, and data centers. Firms with budgets this big often prefer to own key routes outright.
Consortium Ownership grows fastest because the cost of long routes keeps climbing. Alphabet expects its 2026 capital spending to land between $175 billion and $185 billion, and even spenders this large now team up with carriers to split risk. Shared builds give each partner fiber pairs at a lower price. They also spread permit work across several countries and make local landing rights easier to win.
By Application
Telecom Carrier Transit dominates with 32.7% due to rising broadband traffic per subscriber.
Telecom Carrier Transit holds the largest share because carriers still move most home and business traffic across borders. ITU reports that average fixed broadband traffic reached 3,731.9 GB per subscription, while mobile broadband reached 166.3 GB. Carriers must hand off this growing load between networks every day.
Hyperscaler and Cloud Interconnect is the fastest-growing application as cloud firms connect their regions with private, high-capacity links. Equinix passed 500,000 interconnections, and in the third quarter of 2025 it added 7,100 net connections, which it credited to faster hyperscaler integration. AI training, cloud storage, and backup jobs all need low-delay paths between countries.
Key Market Segments
By Service Type
- International Transport and Carrier Transit
- Dark Fiber and Fiber-Pair IRUs
- Wavelength and Spectrum Capacity
- Managed Cross-Border Network Services
By Network Type
- Terrestrial Cross-Border Fiber Backbone
- Submarine Fiber Backbone
- Hybrid Terrestrial-Submarine Backbone
By Ownership Type
- Single Ownership
- Consortium Ownership
- Wholesale Neutral Host Ownership
By Application
- Telecom Carrier Transit
- Hyperscaler and Cloud Interconnect
- Data Center Interconnect
- Government and Defense Connectivity
- Financial Services and Low-Latency Trading Connectivity
- Content Delivery and Media Distribution
Geopolitical Impact Analysis
The Red Sea crisis hits cross-border fiber directly. The corridor through Egypt and the Red Sea carries many of the cable systems that link Europe with Asia and the Gulf. UNCTAD reported that trade volume through the Suez Canal fell by 42% over two months after attacks on ships began. Weekly container ship transits dropped by 67% compared with a year earlier.
These shipping shocks reach fiber builders through logistics. Cable ships, repeaters, and spools of optical cable move on the same sea lanes. UNCTAD found that over 300 container vessels, more than 20% of global container capacity, were rerouted away from Suez. Rerouting around the Cape of Good Hope adds roughly 10 to 14 days per voyage. That delays the delivery of terminal gear and spare cable.
Security risk also changes route design. Operators now avoid relying on a single chokepoint. Instead, they invest in terrestrial routes through the Gulf, Turkey, and Central Asia, plus hybrid land and sea systems. This shift explains why hybrid terrestrial-submarine backbones grow fastest. It also lifts insurance and repair costs on the routes that remain at risk.
Trade policy adds cost pressure. Tariffs on optical equipment and electronics traded between the US and China raise the landed cost of transponders and line systems. Governments are also screening foreign ownership of landing stations more closely. That slows permits and pushes buyers toward trusted suppliers and consortium builds.
Regional Analysis
North America dominates the Cross-Border Fiber Route Market, holding a 32.7% share and generating USD 6.9 billion in revenue. The US anchors this lead. Its large cloud campuses in Virginia, Texas, Oregon, and Ohio create steady demand for long-haul links to Canada, Mexico, and coastal cable landings. Private infrastructure capital speeds up network growth.
In May 2026, Zayo closed its purchase of Crown Castle’s Fiber Solutions business. The deal added 90,000 metro-dense route miles and lifted its reach to more than 70,000 on-net locations. These metro assets feed traffic into cross-border backbones that serve hyperscaler and enterprise buyers. Large carriers also keep spending to protect their position.
Lumen spent about USD 4 billion on capital projects in 2025 and guided USD 3.2 billion to USD 3.4 billion for 2026. Much of this spending supports private connectivity fabric deals that link AI data centers across long distances. Canada adds value as a transit corridor for traffic between US cloud regions and the transatlantic cables that land in Nova Scotia and Quebec.
Asia Pacific is the fastest-growing region in the Cross-Border Fiber Route Market. India, Southeast Asia, Japan, and Australia keep adding cloud regions and data centers. The ITU reported that the world added more than 240 million new internet users in 2025, and much of that growth came from Asia. Tata Communications runs more than 200,000 km of terrestrial fiber, and its data revenue grew 9.4% in FY2026.
Key Regions and Countries
North America
- US
- Canada
Europe
- Germany
- France
- The UK
- Spain
- Italy
- Rest of Europe
Asia Pacific
- China
- Japan
- South Korea
- India
- Australia
- Rest of APAC
Latin America
- Brazil
- Mexico
- Rest of Latin America
Middle East and Africa
- GCC
- South Africa
- Rest of MEA
Market Dynamics
Drivers
| Driver | (~) % Impact on CAGR Forecast | Geographic Relevance | Impact Timeline |
|---|---|---|---|
| Hyperscaler AI Data Center Interconnect Demand | +2.6% | North America, Europe, Asia Pacific | Short term (2 years or less) |
| Terrestrial Route Diversification Away from Chokepoints | +1.8% | Middle East, Central Asia, Europe | Medium term (2 to 4 years) |
| Regional Digital Corridor Programs | +1.4% | Africa, ASEAN, Latin America | Medium term (2 to 4 years) |
| Cloud Region Expansion into Emerging Markets | +1.2% | South Asia, Middle East, Africa | Short term (2 years or less) |
| Coherent 800G Optics Adoption | +0.9% | Global | Short term (2 years or less) |
| Data Localization Driving In-Region Backhaul | +0.7% | India, EU, Gulf States | Medium term (2 to 4 years) |
Hyperscaler AI Data Center Interconnect Demand
Distributed AI training and inference clusters have moved cross-border fiber away from carrier-wholesale wavelength resale and toward hyperscaler-anchored dark fiber IRUs and spectrum-sharing deals. Per company capital expenditure disclosures in SEC filings, the four largest US cloud operators together spent more than $200 billion in calendar 2024, and guidance for 2025 pointed to over $300 billion.
Earnings calls from optical system vendors in 2024–2025 reported data center interconnect revenue growing above 30% year-on-year. ITU bandwidth tracking also shows international bandwidth use rising about 25–30% a year, with content providers accounting for more than 70% of used international capacity, as reflected in ITU Facts and Figures.
This shift turns route owners from per-circuit sellers into long-tenor infrastructure lessors. Contracts run 15–25 years with upfront IRU payments, which pulls cash forward and support EBITDA margins of 55–65%, compared with roughly 35–40% on managed wavelength sales.
Restraints
| Restraint | (~) % Impact on CAGR Forecast | Geographic Relevance | Impact Timeline |
|---|---|---|---|
| Cross-Border Permitting and Right-of-Way Deadlock | -1.6% | South Asia, Africa, Central Asia | Medium term (2 to 4 years) |
| Geopolitical Route Bans and Sanctions | -1.3% | Russia-Europe, China-adjacent, Red Sea | Short term (2 years or less) |
| Elevated Cost of Infrastructure Capital | -1.0% | Emerging Markets, Europe | Short term (2 years or less) |
| Foreign Ownership Restrictions on Telecom Assets | -0.6% | India, Gulf States, Southeast Asia | Long term (4 years or more) |
| Armed Conflict Zone Route Closures | -0.5% | Eastern Europe, Sahel, Middle East | Short term (2 years or less) |
Cross-Border Permitting and Right-of-Way Deadlock
Each terrestrial cross-border route needs separate rights-of-way, customs clearances, and security approvals in every jurisdiction it crosses. Per World Bank Digital Development assessments, right-of-way and permitting can make up 10–20% of total fiber deployment cost in low- and middle-income economies.
Lead times for a single border crossing often run 18–36 months, against 6–9 months for domestic segments. The ITU Broadband Commission records that several landlocked developing countries still depend on only 1–2 international transit routes, largely because bilateral permitting frameworks stall.
GSMA infrastructure-sharing studies estimate that the lack of dig-once and coordinated corridor policies raises per-kilometre civil works costs by about 25–40%. The commercial result is stranded pre-construction capital, IRU contracts that cannot close until both ends are permitted, and project IRR erosion of 200–400 basis points.
Challenges
| Challenge | (~) % CAGR Friction Drag | Geographic Relevance | Mitigation Horizon |
|---|---|---|---|
| Fiber Cut and Sabotage Exposure | -0.9% | Global, Baltic, Red Sea, Africa | Medium term (2 to 4 years) |
| Skilled Splicing Workforce Shortage | -0.6% | North America, Europe, Africa | Long term (4 years or more) |
| Optical Component Supply Volatility | -0.5% | Global | Short term (2 years or less) |
| Multi-Jurisdiction Interoperability Friction | -0.4% | Africa, ASEAN, Central Asia | Medium term (2 to 4 years) |
| Wholesale Bandwidth Price Erosion | -0.4% | Global | Long term (4 years or more) |
Fiber Cut and Sabotage Exposure
Cross-border routes run through remote, contested, or construction-heavy corridors, which makes them structurally exposed to accidental cuts and deliberate sabotage. Per International Cable Protection Committee data, there are roughly 150–200 subsea cable faults each year, and the terrestrial backhaul segments that link to them see higher cut frequencies.
Events in 2024–2025, including the Red Sea cable damage and the Baltic Sea incidents investigated by NATO and national authorities, affected an estimated 25% of Asia-Europe traffic and forced rerouting at higher latency. Per ENISA telecom security incident reporting, physical infrastructure damage is consistently one of the top root causes of major outages.
Operators now have to build in route diversity at about 1.5–2x the capacity, strengthen SLA penalty reserves, and fund patrol and monitoring systems that add 5–8% to annual opex. Over the long term, the industry is moving toward fiber sensing, armored ducting, and mesh-based protection architectures.
Opportunities
| Opportunity | (~) % Potential CAGR Upside | Geographic Relevance | Execution Window |
|---|---|---|---|
| Energy and Rail Corridor Fiber Co-Deployment | +1.5% | South Asia, Africa, Central Asia, Europe | Medium term (2 to 4 years) |
| Distributed Acoustic Sensing Monetization | +0.9% | Global | Medium term (2 to 4 years) |
| Northeast India to ASEAN Transit Gateway | +0.7% | India, Bangladesh, Myanmar, Bhutan | Long term (4 years or more) |
| Neutral Host Fiber Platform Roll-Ups | +0.6% | Europe, Latin America, Africa | Short term (2 years or less) |
| Quantum-Secure Cross-Border Links | +0.4% | EU, Asia Pacific | Long term (4 years or more) |
Energy and Rail Corridor Fiber Co-Deployment
Building fiber along cross-border power transmission lines and rail corridors is still largely untapped. Most utility OPGW capacity today serves internal grid telemetry rather than commercial transit, so this is unexploited white space rather than an active driver.
Per IEA electricity grid tracking, more than 80 million km of grids will need to be added or refurbished globally by 2040, and the regional interconnectors planned under ASEAN Power Grid and African Continental Power System Master Plan frameworks offer ready-made, pre-permitted cross-border rights-of-way.
Per World Bank infrastructure-sharing analysis, co-deployment cuts fiber rollout cost by about 30–60% per kilometre because civil works are avoided. ITU regulatory guidance also notes that this approach shortens the time to approve border crossings.
If carriers lease dark fiber pairs from utilities, the cost per route-kilometre could fall by about 40%. Utilities would gain a high-margin revenue stream of around 60–70% EBITDA from capacity they already own, which could lift blended corridor project margins by 800–1,200 basis points.
Key Players Analysis
Tier 1 leaders hold the largest route footprints and the highest revenues. Lumen Technologies reported full-year 2025 revenue of USD 12.4 billion. Its Business segment brought in USD 2.425 billion in Q4 2025 alone. Lumen expects USD 116 million in private connectivity fabric revenue for 2025 as AI customers buy dedicated long-haul fiber.
Zayo Group makes the biggest bet on scale. It agreed to buy Crown Castle’s Fiber Solutions business for about USD 4.25 billion, as part of a combined transaction worth USD 8.5 billion. The deal was Zayo’s 50th acquisition and its largest. Tata Communications posted FY2026 gross revenue of INR 24,803 crore. Data revenue reached INR 21,352 crore, up 9.4%, and its EBITDA margin stood at 19.4%.
Tier 2 challengers hold strong regional or niche positions. Telecom Italia Sparkle moved under state-backed control at an enterprise value of EUR 700 million. Arelion, EXA Infrastructure, Colt, and RETN compete on low-latency European and transatlantic routes.
Orange, NTT DOCOMO BUSINESS, and PCCW Global use their stakes in submarine cable consortia to serve carrier and cloud buyers in Africa, Asia, and the Middle East. Consortium models let these players share build costs while securing long-term fiber pair rights.
Top Key Players in the Market
- Arelion AB
- Colt Technology Services Group Limited
- Zayo Group Holdings, Inc.
- EXA Infrastructure Services UK Limited
- RETN Limited
- Tata Communications Limited
- NTT DOCOMO BUSINESS, Inc.
- Orange S.A.
- Telecom Italia Sparkle S.p.A.
- PCCW Global, Inc.
- Lumen Technologies, Inc.
Recent Developments
- In March 2025, Zayo Group signed a definitive agreement to buy Crown Castle’s Fiber Solutions business for about USD 4.25 billion, adding about 90,000 route miles of fiber.
- In April 2025, TIM signed an agreement to sell Telecom Italia Sparkle to Boost BidCo, a vehicle controlled by Italy’s Ministry of Economy and Finance with Retelit, at an enterprise value of EUR 700 million.
- In April 2026, Tata Communications reported FY2026 data revenue of INR 21,352 crore, growing 9.4% year on year, with digital portfolio revenue up 16.7%.
- In May 2026, Zayo Group closed its Crown Castle Fiber Solutions purchase, taking its North American network to 224,000 route miles within a combined transaction worth USD 8.5 billion.
Report Scope
| Report Features | Description |
|---|---|
| Market Value (2025) | USD 21.1 Billion |
| Forecast Revenue (2035) | USD 55.7 Billion |
| CAGR (2026-2035) | 10.2% |
| Base Year for Estimation | 2025 |
| Historic Period | 2020-2024 |
| Forecast Period | 2026-2035 |
| Report Coverage | Revenue Forecast, Market Dynamics, Competitive Landscape, Recent Developments |
| Segments Covered | By Service Type (International Transport and Carrier Transit, Dark Fiber and Fiber-Pair IRUs, Wavelength and Spectrum Capacity, Managed Cross-Border Network Services); By Network Type (Terrestrial Cross-Border Fiber Backbone, Submarine Fiber Backbone, Hybrid Terrestrial-Submarine Backbone); By Ownership Type (Single Ownership, Consortium Ownership, Wholesale Neutral Host Ownership); By Application (Telecom Carrier Transit, Hyperscaler and Cloud Interconnect, Data Center Interconnect, Government and Defense Connectivity, Financial Services and Low-Latency Trading Connectivity, Content Delivery and Media Distribution) |
| Regional Analysis | North America – US, Canada; Europe – Germany, France, The UK, Spain, Italy, Rest of Europe; Asia Pacific – China, Japan, South Korea, India, Australia, Singapore, Rest of APAC; Latin America – Brazil, Mexico, Rest of Latin America; Middle East & Africa – GCC, South Africa, Rest of MEA |
| Competitive Landscape | Arelion AB, Colt Technology Services Group Limited, Zayo Group Holdings, Inc., EXA Infrastructure Services UK Limited, RETN Limited, Tata Communications Limited, NTT DOCOMO BUSINESS, Inc., Orange S.A., Telecom Italia Sparkle S.p.A., PCCW Global, Inc., Lumen Technologies, Inc. |
| Customization Scope | Customization for segments, region/country-level will be provided. Moreover, additional customization can be done based on the requirements. |
| Purchase Options | We have three licenses to opt for: Single User License, Multi-User License (Up to 5 Users), Corporate Use License (Unlimited Users and Printable PDF) |