Report Overview
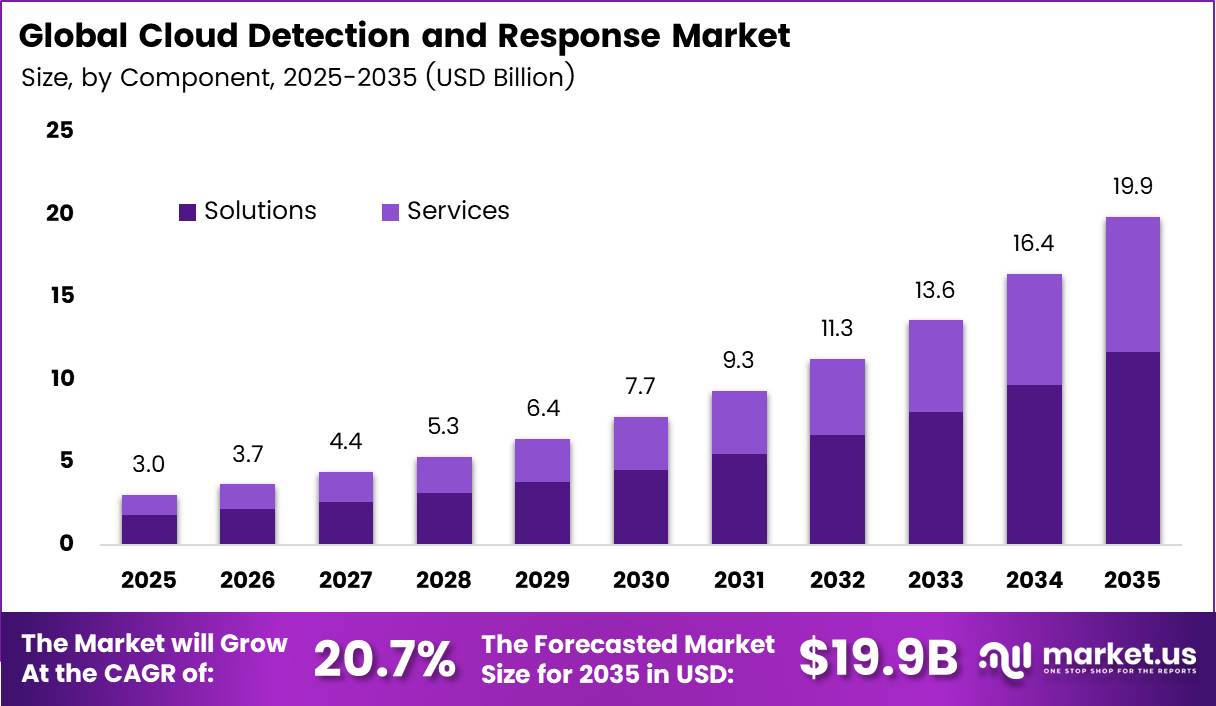
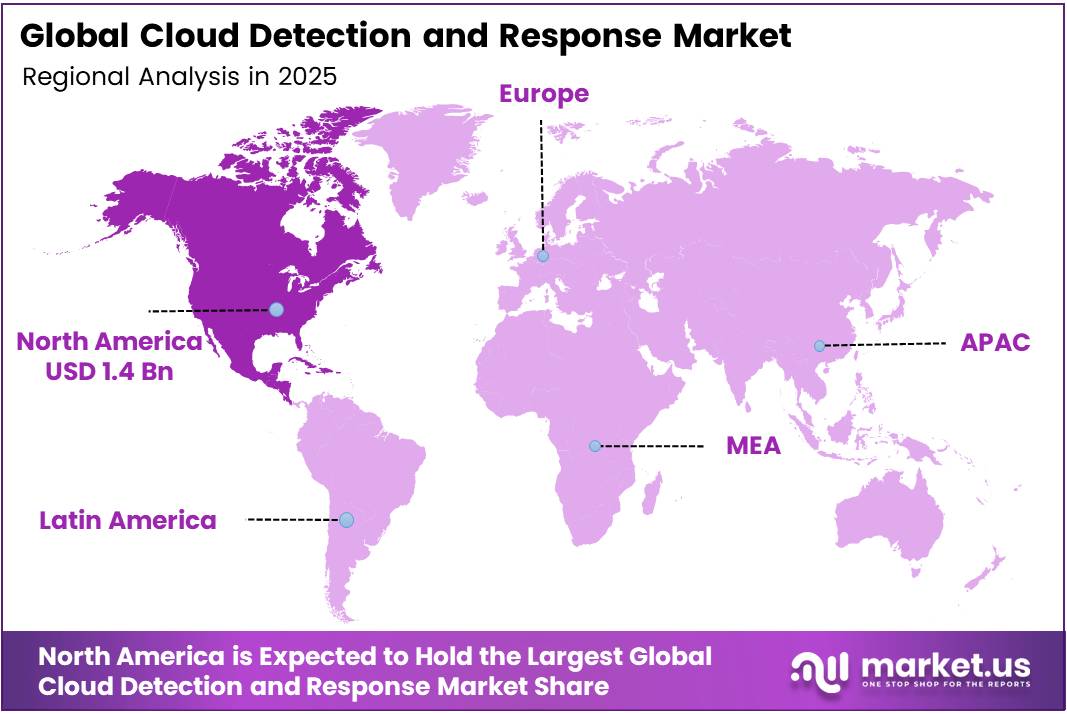
In 2025, the Global Cloud Detection And Response Market was valued at USD 3.0 billion. The market is projected to grow at a CAGR of 20.7% during 2026–2035, reaching approximately USD 19.9 billion by 2035. North America dominated the global market in 2025, accounting for more than 47.9% of the total market share and generating approximately USD 1.4 billion in revenue.
Fast cloud adoption and rising cyber losses drive this growth. The FBI Internet Crime Complaint Center reported USD 16.6 billion in cybercrime losses in 2024, up 33% from 2023. Cloud providers now run more business work than ever. Microsoft reported that Azure and other cloud services revenue grew 39% in fiscal 2025, and its total annual cloud revenue passed USD 168 billion.
The North America region has the deepest cloud base in the world. The World Bank reports that the US produced about USD 27.7 trillion in GDP in 2023, and digital services make up a large part of that output. The ITU found that about 93% of people in North America use the internet.
Strict rules also push demand. Since December 2023, the US SEC has required listed firms to disclose material cyber incidents within 4 business days. Large cloud hyperscalers and security vendors also have their headquarters in the US. This mix of high spending, strict rules, and local vendors keeps the region in first place.
Key Takeaways
- The Cloud Detection And Response Market reached USD 3.0 billion in 2025 and should hit USD 19.9 billion by 2035. at a CAGR of 20.7% from 2026 to 2035.
- By component, Solutions lead with a 58.5% share, while Services show faster growth.
- By deployment mode, Public Cloud leads with a 57.3% share, while Private Cloud shows faster growth.
- By organization size, Large Enterprises lead with a 64.6% share, while SMEs show faster growth.
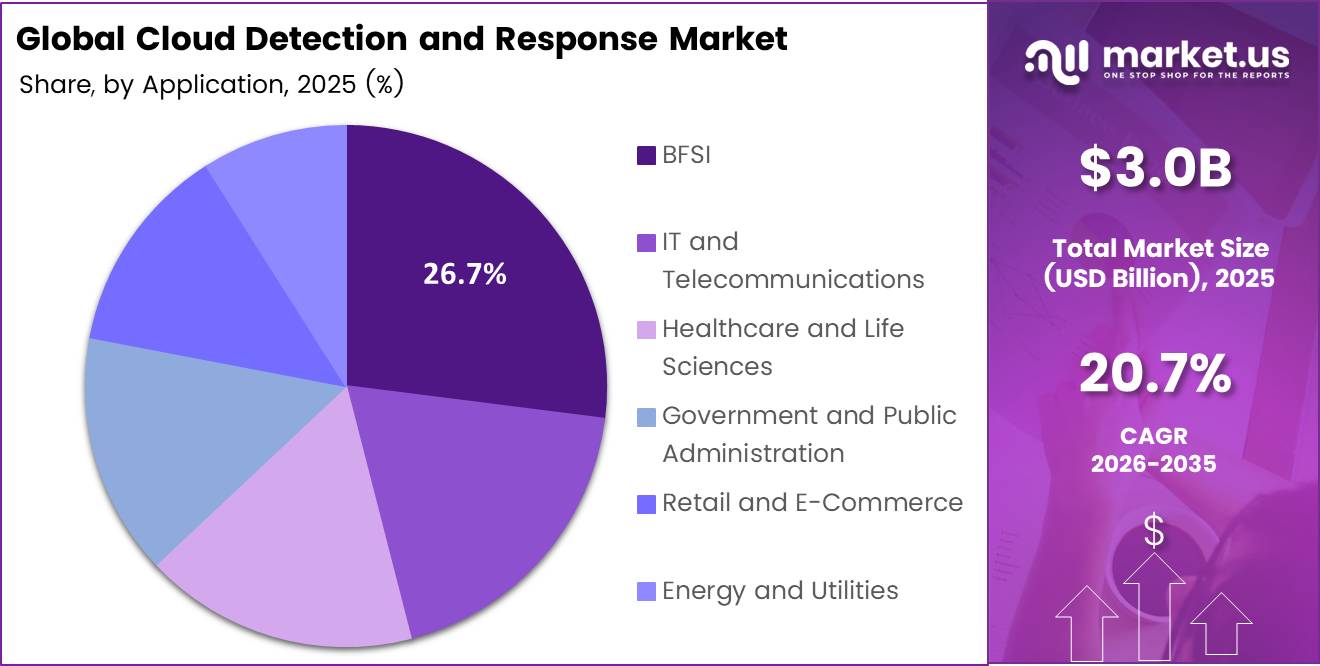
- By end-use industry, BFSI leads with a 26.7% share of the market.
- North America leads with a 47.9% share and USD 1.4 billion in revenue.
By Component
Solutions dominate with 58.5% due to real-time threat detection and automated response.
Solutions lead because firms need tools that watch cloud workloads, flag threats, and act in real time. IBM’s 2025 Cost of a Data Breach Report puts the global average breach cost at USD 4.44 million, down 9% from USD 4.88 million in 2024.
Services grow fastest because many firms lack the skilled staff to run these tools every day. IBM finds that the average U.S. breach cost climbed to a record USD 10.22 million, partly due to higher detection and escalation costs and bigger regulatory fines. This pushes companies to buy managed detection, incident response, and 24/7 monitoring from outside experts.
By Deployment Mode
Public Cloud dominates with 57.3% due to fast-growing hyperscale workload migration.
Public Cloud leads because most companies now run new apps on large shared platforms. Alphabet’s 2025 Form 10-K reports Google Cloud revenue of $58.7 billion, up $15.5 billion, or 36%, from 2024, mainly from infrastructure and platform services.
Fourth-quarter Google Cloud revenue alone jumped 48% to $17.7 billion. Every new workload creates more identities, APIs, and storage buckets that attackers can target. Detection vendors build native links with public cloud providers, so buyers can switch on protection fast.
By Organization Size
Large Enterprises dominate with 64.6% due to complex multi-account cloud estates.
Large Enterprises lead because they run the biggest and most complex cloud estates. Eurostat reports that 84.67% of large EU enterprises bought paid cloud computing services in 2025, against 52.74% of all EU enterprises.
Small and Medium-Sized Enterprises (SMEs) grow fastest because their cloud use is rising quickly from a lower base. Eurostat shows that 66.78% of medium-sized and 49.3% of small EU firms used paid cloud services in 2025. The small-firm share rose 7.48 percentage points since 2023.
By End-Use Industry
Banking, Financial Services, and Insurance (BFSI) dominates with 26.7% due to high-value payment and identity data.
Banking, Financial Services, and Insurance (BFSI) leads because banks and insurers hold money, identity data, and payment systems that attackers prize. IBM’s 2025 industry data places the average financial-sector breach at USD 5.56 million, second highest among 17 industries studied.
The FBI’s IC3 also recorded $3.046 billion in business email compromise losses in 2025 from 24,768 complaints. Strict rules from financial regulators force firms to detect and report incidents fast, which keeps BFSI spending high.
Healthcare and Life Sciences grows fastest as hospitals move patient records, imaging, and research data to the cloud. IBM ranks healthcare as the costliest industry for breaches for the 14th year in a row, at USD 7.42 million per incident. The FBI received 3,611 BFSI spending reports in 2025, up from 3,156 in 2024, and attackers often target hospitals because downtime harms patients.
Key Market Segments
By Component
- Solutions
- Services
By Deployment Mode
By Organization Size
- Small and Medium-Sized Enterprises (SMEs)
- Large Enterprises
By End-Use Industry
- Banking, Financial Services, and Insurance (BFSI)
- IT and Telecommunications
- Healthcare and Life Sciences
- Government and Public Administration
- Retail and E-Commerce
- Energy and Utilities
- Others
Geopolitical Impact Analysis
Trade tensions now shape the cost of cloud security. The US set a baseline tariff of 10% on most imports in April 2025, with much higher rates on goods from China. Cloud detection tools run in data centers filled with servers, chips, and network gear. Higher costs for this hardware raise the price of the platforms that host security software.
Global trade also slowed. In April 2025, the WTO cut its forecast for 2025 merchandise trade volume to a drop of 0.2%, which it said was about 3 points below its earlier outlook. Fewer and slower hardware shipments delay new data center builds. Security vendors then wait longer to roll out regional cloud points of presence.
Shipping risks add more delay. UNCTAD reported that Suez Canal transits fell by more than 50% after the Red Sea attacks, and that rerouting around Africa added about 10 to 14 days per voyage. Servers and storage arrays bound for European and Asian data centers took these longer routes. This pushed back capacity that cloud security vendors need.
Energy prices also matter. The IEA expects data center power use to more than double to about 945 TWh by 2030. Gas price swings after the Russia and Ukraine conflict raised operating costs for cloud regions in Europe. State-backed cyberattacks have also grown with these conflicts. The IMF found that cyber incidents have more than doubled since before the COVID-19 pandemic.
Regional Analysis
North America dominates the Cloud Detection And Response Market, holding a 47.9% share and generating USD 1.4 billion in revenue. The US drives most of this demand. Large banks, health systems, and tech firms run critical work on Amazon Web Services, Microsoft Azure, and Google Cloud.
CISA also runs the Known Exploited Vulnerabilities catalog, which lists more than 1,200 flaws that agencies must fix by set deadlines. Health rules add pressure as well. The US Department of Health and Human Services reported that large health data breaches affected more than 275 million records in 2024. Each breach pushes hospitals and insurers to buy tools that watch cloud activity.
Asia Pacific is the fastest-growing region in the market. China, Japan, and India lead fast cloud adoption. India’s CERT-In requires firms to report cyber incidents within 6 hours. Japan’s Active Cyber Defense law, passed in 2025, expands state threat monitoring. Australia’s cyber strategy commits AUD 586.9 million to its plan through 2030.
Europe holds the second position. The EU NIS2 Directive took effect in October 2024 and covers 18 critical sectors. It sets fines of up to EUR 10 million or 2% of global turnover. The EU Digital Operational Resilience Act has also applied to financial firms since January 2025. Germany, France, and the UK lead regional spending, and data sovereignty rules push demand for private cloud detection.
Key Regions and Countries
North America
- US
- Canada
Europe
- Germany
- France
- The UK
- Spain
- Italy
- Rest of Europe
Asia Pacific
- China
- Japan
- South Korea
- India
- Australia
- Rest of APAC
Latin America
- Brazil
- Mexico
- Rest of Latin America
Middle East and Africa
- GCC
- South Africa
- Rest of MEA
Market Dynamics
Drivers
| Driver | (~) % Impact on CAGR Forecast | Geographic Relevance | Impact Timeline |
|---|---|---|---|
| Multi-Cloud and Container Workload Proliferation | +3.1% | Global, led by North America | Short term (2 years or less) |
| Cyber Incident Disclosure Mandates | +2.3% | North America, Europe | Short term (2 years or less) |
| Identity-Centric Cloud Intrusions | +1.9% | Global | Short term (2 years or less) |
| CNAPP Platform Consolidation | +1.4% | North America, Western Europe | Medium term (2 to 4 years) |
| AI-Assisted SOC Triage Adoption | +1.1% | North America, Asia-Pacific | Medium term (2 to 4 years) |
Multi-Cloud and Container Workload Proliferation
The underlying cause is structural. Hyperscaler capital spending has kept growing: Microsoft, Alphabet, and Amazon each guided to more than $75 billion in annual CapEx in their FY2025 earnings calls. CNCF annual survey data shows Kubernetes production use above 80% of surveyed organizations.
The cost of failure grows with this workload spread. IBM breach-cost research put the global average breach cost at $4.88 million in 2024. Breaches spanning multiple environments took more than 270 days to identify and contain.
SEC filings from public cloud security vendors show net revenue retention of roughly 115% to 125%. That means growth comes increasingly from expanding existing accounts rather than from new-logo acquisition, which lowers blended CAC and supports subscription gross margins near 75% to 80%.
Restraints
| Restraint | (~) % Impact on CAGR Forecast | Geographic Relevance | Impact Timeline |
|---|---|---|---|
| Data Sovereignty Limits on Telemetry Export | -1.3% | Europe, China, India, Middle East | Short term (2 years or less) |
| Hyperscaler Native Tool Bundling | -1.1% | Global | Short term (2 years or less) |
| Security Budget Consolidation Freezes | -0.8% | North America, Europe | Short term (2 years or less) |
| Kernel-Level Agent Deployment Restrictions | -0.5% | Global | Medium term (2 to 4 years) |
| Public Sector Certification Backlogs | -0.4% | North America, Europe | Medium term (2 to 4 years) |
Data Sovereignty Limits on Telemetry Export
The result is a hard procurement barrier. Fines under the European Data Protection Board’s GDPR enforcement framework can reach 4% of global turnover, so regulated buyers in banking, health, and government often stop deals until in-region processing is available. Running a separate regional analytics instance can raise a vendor’s per-tenant hosting costs by an estimated 20% to 35%.
The commercial impact shows up in slower deals and thinner margins. Sales cycles in affected regions can stretch by 3 to 6 months. Vendors that must build sovereign points of presence face extra CapEx before they see revenue, which compresses gross margin by an estimated 2 to 4 percentage points during the build-out phase.
Challenges
| Challenge | (~) % CAGR Friction Drag | Geographic Relevance | Mitigation Horizon |
|---|---|---|---|
| Cloud Security Talent Deficit | -1.2% | Global | Long term (4 years or more) |
| Alert Fatigue and False Positives | -0.7% | Global | Medium term (2 to 4 years) |
| Rising Telemetry Ingestion Costs | -0.6% | North America, Europe | Medium term (2 to 4 years) |
| Ephemeral Workload Visibility Gaps | -0.4% | Global | Medium term (2 to 4 years) |
| Fragmented Tool Integration Overhead | -0.3% | Global | Short term (2 years or less) |
Cloud Security Talent Deficit
The weakness here is a shortage of people with the right skills. The ISC2 Cybersecurity Workforce Study estimated a global workforce gap of about 4.8 million professionals in 2024, with cloud security named the most-needed skill. NIST’s NICE framework data reflects similar shortages across U.S. public and private employers.
The shortage limits how fast customers can absorb new tools without stopping purchases. U.S. Bureau of Labor Statistics data shows information security analyst pay above $120,000 a year, alongside projected occupational growth of roughly 33% over the decade. Many buyers license detection capability that they cannot fully staff, which leaves an estimated 25% to 30% of purchased features underused and weakens renewal expansion.
Vendors need long-term structural changes to work around this. They are bundling managed detection services, building guided response playbooks, and funding certification pipelines with academic and government workforce programs. These moves shift revenue mix toward services that carry lower gross margins of about 45% to 55%, compared with 75% or more for pure software.
Opportunities
| Opportunity | (~) % Potential CAGR Upside | Geographic Relevance | Execution Window |
|---|---|---|---|
| AI Model and LLM Runtime Protection | +1.8% | North America, Europe, Asia-Pacific | Medium term (2 to 4 years) |
| MSSP-Delivered CDR for SMEs | +1.3% | Global, led by Asia-Pacific and Latin America | Short term (2 years or less) |
| Sovereign Cloud Detection Offerings | +1.0% | Europe, India, Gulf Cooperation Council | Medium term (2 to 4 years) |
| Cyber Insurance-Linked Bundles | +0.7% | North America, United Kingdom | Medium term (2 to 4 years) |
| Platform M&A Roll-Ups | +0.5% | North America, Israel | Long term (4 years or more) |
AI Model and LLM Runtime Protection
This is still white space rather than a current driver. Existing detection engines watch processes, containers, and identities, but they do not inspect model inference calls, prompt-injection chains, or misuse of autonomous agent permissions. The OWASP Top 10 for LLM Applications and the NIST AI Risk Management Framework identify these as new attack classes.
The unit economics are attractive. Vendors that extend existing runtime sensors to AI workloads can reuse current telemetry pipelines, so the marginal cost of serving each extra workload is an estimated 15% to 20% below building a standalone product. Premium AI-security modules could also add 20% to 30% to average contract values, supporting gross margin gains of about 3 to 5 percentage points.
Key Players Analysis
Tier 1 leaders hold the largest global footprint. Palo Alto Networks reported USD 9.22 billion in fiscal 2025 revenue, up about 15%. It closed its USD 25 billion CyberArk deal in February 2026, which adds identity security to its Cortex Cloud platform. CrowdStrike reported USD 4.81 billion in fiscal 2026 revenue, up 22%, and ended the year with USD 5.25 billion in ARR. In Q2 of fiscal 2027, CrowdStrike revenue rose 26% to USD 1.47 billion.
Microsoft brings huge scale. It reported more than USD 20 billion in annual security revenue and said it would invest USD 20 billion in security over 5 years. Google moved into the top tier when it closed its USD 32 billion all-cash Wiz deal in March 2026, its largest deal ever. Wiz now runs inside Google Cloud and supports AWS, Azure, and Oracle Cloud.
Network security firms make up the next group. Fortinet posted USD 5.96 billion in 2024 revenue. Check Point reported USD 2.57 billion in 2024 revenue. Cisco extends its reach through the USD 28 billion Splunk deal it closed in 2024. These firms use large existing customer bases to sell cloud detection.
Tier 2 challengers hold strong niche positions. SentinelOne reported USD 821.5 million in fiscal 2025 revenue, up 32%. Tenable posted about USD 900 million in 2024 revenue, and Rapid7 posted about USD 844 million. Arctic Wolf, Orca Security, Sysdig, Sophos, and Trend Micro compete in managed detection, agentless scanning, and runtime security.
Top Key Players in the Market
- Palo Alto Networks, Inc.
- CrowdStrike Holdings, Inc.
- Microsoft Corporation
- Wiz, Inc.
- Arctic Wolf Networks, Inc.
- Cisco Systems, Inc.
- Fortinet, Inc.
- Check Point Software Technologies Ltd.
- Trend Micro Incorporated
- SentinelOne, Inc.
- Orca Security Ltd.
- Sysdig, Inc.
- Rapid7, Inc.
- Sophos Limited
- Tenable Holdings, Inc.
Recent Developments
- In March 2025, Google agreed to buy Wiz for USD 32 billion in cash to strengthen Google Cloud security across multiple clouds.
- In July 2025, Palo Alto Networks announced a deal to buy CyberArk for about USD 25 billion to add identity security to its platform.
- In August 2025, SentinelOne agreed to buy Prompt Security for about USD 250 million to protect AI use in cloud settings.
Report Scope
| Report Features | Description |
|---|---|
| Market Value (2025) | USD 3.0 Billion |
| Forecast Revenue (2035) | USD 19.9 Billion |
| CAGR (2026-2035) | 20.7% |
| Base Year for Estimation | 2025 |
| Historic Period | 2020-2024 |
| Forecast Period | 2026-2035 |
| Report Coverage | Revenue Forecast, Market Dynamics, Competitive Landscape, Recent Developments |
| Segments Covered | By Component (Solutions, Services); By Deployment Mode (Public Cloud, Private Cloud); By Organization Size (Small and Medium-Sized Enterprises (SMEs), Large Enterprises); By End-Use Industry (Banking, Financial Services, and Insurance (BFSI), IT and Telecommunications, Healthcare and Life Sciences, Government and Public Administration, Retail and E-Commerce, Energy and Utilities, Others) |
| Regional Analysis | North America – US, Canada; Europe – Germany, France, The UK, Spain, Italy, Rest of Europe; Asia Pacific – China, Japan, South Korea, India, Australia, Singapore, Rest of APAC; Latin America – Brazil, Mexico, Rest of Latin America; Middle East & Africa – GCC, South Africa, Rest of MEA |
| Competitive Landscape | Palo Alto Networks, Inc., CrowdStrike Holdings, Inc., Microsoft Corporation, Wiz, Inc., Arctic Wolf Networks, Inc., Cisco Systems, Inc., Fortinet, Inc., Check Point Software Technologies Ltd., Trend Micro Incorporated, SentinelOne, Inc., Orca Security Ltd., Sysdig, Inc., Rapid7, Inc., Sophos Limited, Tenable Holdings, Inc. |
| Customization Scope | We will provide customization for segments and region/country levels. Moreover, additional customization can be done based on the requirements. |
| Purchase Options | We have three licenses to opt for: Single User License, Multi-User License (Up to 5 Users), Corporate Use License (Unlimited Users and Printable PDF) |