Report Overview
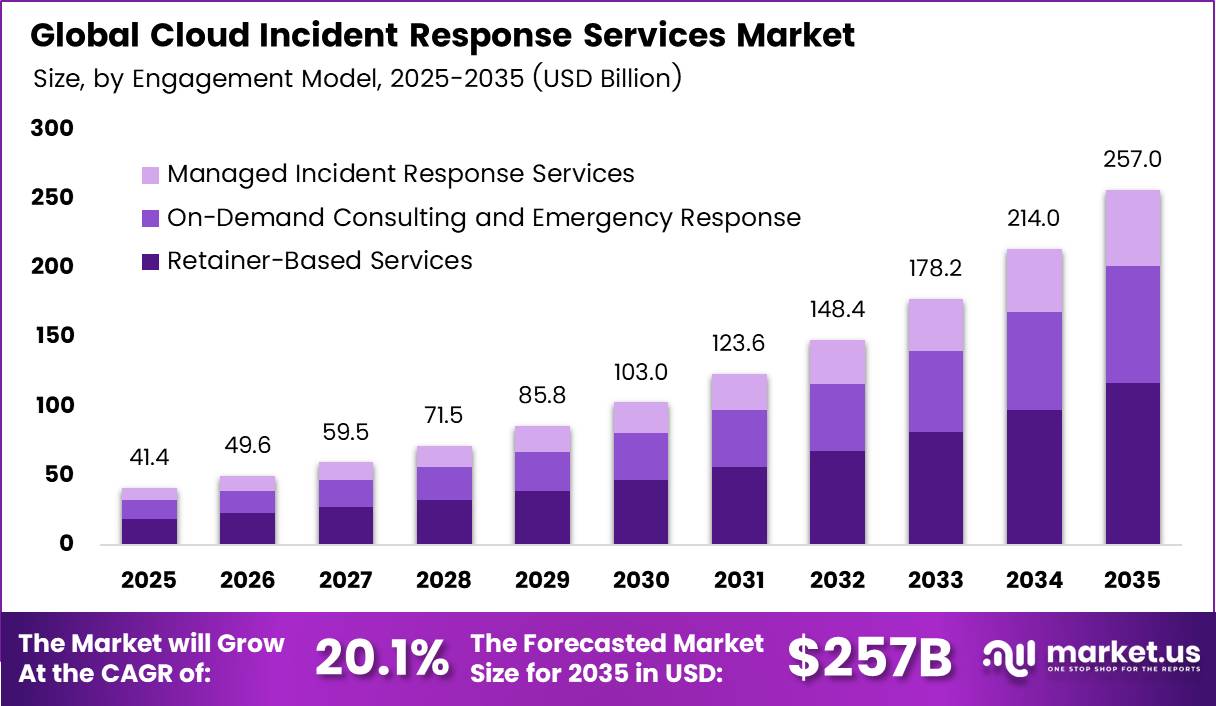
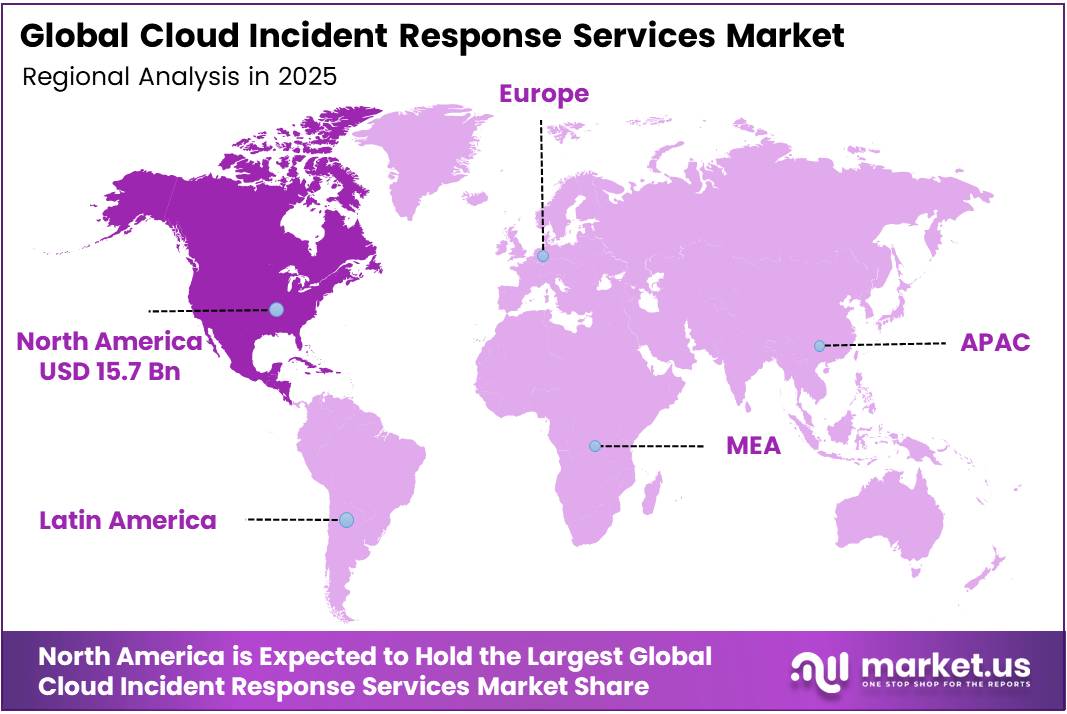
In 2025, the Global Cloud Incident Response Services Market was valued at USD 41.4 billion. The market is projected to grow at a CAGR of 20.1% during 2026–2035, reaching approximately USD 257.0 billion by 2035. North America dominated the global market in 2025, accounting for more than 37.9% of the total market share and generating approximately USD 15.7 billion in revenue.
Cyber losses keep rising, and this pushes firms to buy expert response help. The FBI Internet Crime Complaint Center logged 1,008,597 complaints in 2025, with losses of USD 20.877 billion. That is a 26% jump from 2024.
Cyber-enabled fraud alone caused USD 17.697 billion in losses, or 85% of the total. At the same time, IBM found that faster containment cut the global average breach cost by 9% to USD 4.44 million. Results like this show buyers that fast response teams save real money, so more firms sign response contracts.
The North America region faces the highest breach costs in the world. IBM reported that the average US breach cost rose 9% to USD 10.22 million, an all-time high for any region. Higher regulatory fines and rising detection costs drove this increase. Ransomware and extortion incidents disclosed by attackers cost an average of USD 5.08 million each.
Key Takeaways
- The Cloud Incident Response Services Market was valued at USD 41.4 billion in 2025 and will reach USD 257.0 billion by 2035. at a CAGR of 20.1% from 2026 to 2035.
- Containment and Eradication leads the Service Type segment with a 28.3% share.
- Retainer-Based Services lead the Engagement Model segment with a 45.2% share.
- Endpoint Security leads the Security Type segment with a 32.7% share.
- Remote delivery leads the Service Delivery Mode segment with a 42.1% share.
- Large Enterprises lead the Organization Size segment with a 71.3% share.
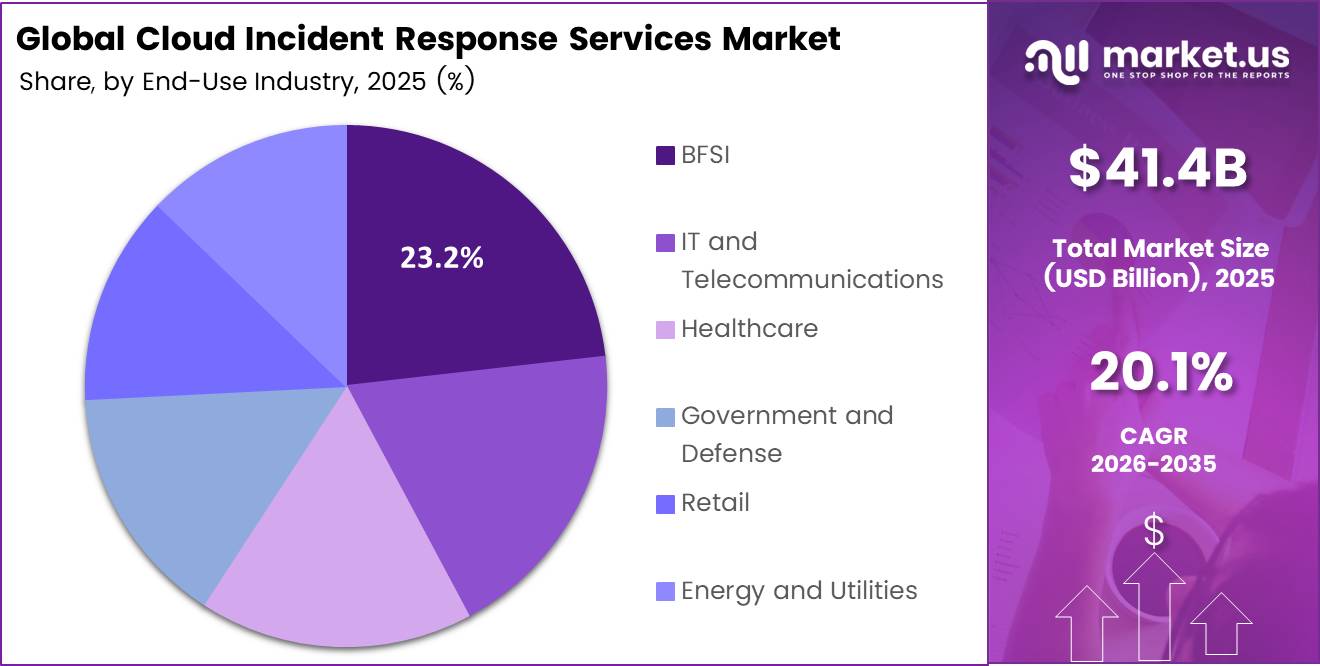
- BFSI leads the End-Use Industry segment with a 23.2% share.
- North America leads with a 37.9% share and USD 15.7 billion in revenue.
By Service Type
Containment and Eradication dominates with 28.3% due to the urgent need to stop attacks.
Containment and Eradication leads because every breach response has one first goal: stop the damage fast. Buyers pay the most for teams that isolate infected systems, cut off attacker access, and block the spread across the network.
Advanced Threat Hunting grows the fastest because attack volumes keep rising and firms no longer want to wait for alarms. India’s CERT-In handled 20,41,360 incidents in 2024 and 29,44,248 in 2025, which is over 9,00,000 more cases in one year. Hunters search networks for hidden attackers before they strike, so clients now move budget from reacting to finding threats early.
By Engagement Model
Retainer-Based Services dominate with 45.2% due to guaranteed fast expert response access.
Retainer deals lead because companies want help ready before a crisis hits. A retainer locks in set rates, agreed response times, and a team that already knows the client’s systems. The FBI’s Internet Crime Complaint Center logged 859,532 complaints in 2024, so few boards feel safe without a response partner on standby.
Rising losses make the case even stronger. IC3 recorded USD 16.6 billion in reported losses, a 33% jump from 2023. Retainers also help firms meet insurer and regulator demands for a tested response plan, which keeps renewal rates high.
Managed Cloud Incident Response Services is the fastest-growing model because firms want round-the-clock monitoring and action in one contract. Providers bundle detection, AI tools, and response for a monthly fee. IBM found that teams using AI and automation widely cut breach times by 80 days and lowered costs by USD 1.9 million. Most mid-sized firms cannot build this setup alone, so they buy it as a service.
By Security Type
Endpoint Security dominates with 32.7% due to user devices being the main entry points.
Endpoint work leads because most attacks still start on a user’s laptop, desktop, or phone. Phishing links, stolen passwords, and unsafe downloads all land on endpoints first. Verizon’s 2025 Data Breach Investigations Report shows the human element played a part in about 60% of breaches, and those human mistakes almost always happen on a device.
Cloud Security grows the fastest as firms move data and apps onto shared platforms run by outside vendors. These links widen the attack surface. Verizon found that breaches involving a third party doubled from 15% to 30% in a single year. Cloud cases need special skills in identity, logs, and provider tools, so clients call in outside experts more often
By Service Delivery Mode
Remote dominates with 42.1% due to faster start without travel delays.
Remote delivery leads because responders can log in and start work within minutes, with no flights or site visits. Modern tools let experts collect logs, isolate devices, and hunt threats from anywhere. IBM data shows that organizations’ own security teams and tools spotted breaches in 172 days, 6 days faster than the year before. Gains like this come from strong remote tooling.
Hybrid delivery grows the fastest because clients want quick remote action plus on-site help with hardware, legal evidence, and staff support. Attack levels stay high. The UK Cyber Security Breaches Survey found that 43% of businesses, or about 612,000 firms, faced a breach or attack in the past year. Many of these cases need both models, so providers now sell blended packages.
By Organization Size
Large Enterprises dominate with 71.3% due to complex networks and larger security budgets.
Large Enterprises lead because they run huge networks across many sites, clouds, and partners, and one breach can stop global operations. They also face strict rules from regulators, so they keep retainers and in-house teams ready. Verizon reports that ransomware was part of 39% of breaches at larger organizations.
SMEs grow the fastest because attackers now target them on purpose. Verizon found ransomware in 88% of breaches at small and medium businesses, more than double the rate at large firms. Most SMEs lack full-time security staff, so they turn to affordable packaged services and pay-as-you-go response plans.
By End-Use Industry
Banking, Financial Services, and Insurance (BFSI) dominates with 23.2% due to high-value data and strict regulations.
BFSI leads because banks and insurers hold money, account data, and payment systems that attackers value most. One breach can freeze payments and trigger heavy fines, so these firms spend early and often on response. IBM puts the average cost of a financial sector breach at USD 5.56 million, well above most other industries.
Healthcare grows the fastest as hospitals digitize records and connect medical devices, yet often lack security staff. The US HHS Office for Civil Rights received 663 reports of large health data breaches in 2024, affecting about 242.9 million people. IBM also found that healthcare breaches took the longest to identify and contain, at 279 days.
Key Market Segments
By Service Type
- Assessment and Preparedness
- Cloud Incident Response Readiness Assessment
- Cloud Incident Response Planning and Playbook Development
- Tabletop Exercises and Simulations
- Investigation and Digital Forensics
- Containment and Eradication
- Remediation and Recovery
- Advanced Threat Hunting
- Other
By Engagement Model
- Retainer-Based Services
- On-Demand Consulting and Emergency Response
- Managed Cloud Incident Response Services
By Security Type
- Endpoint Security
- Network Security
- Cloud Security
- Application Security
- Web Security
By Service Delivery Mode
- Remote
- On-Site
- Hybrid
By Organization Size
- Small and Medium-Sized Enterprises (SMEs)
- Large Enterprises
By End-Use Industry
- Banking, Financial Services, and Insurance (BFSI)
- IT and Telecommunications
- Healthcare
- Government and Defense
- Retail
- Energy and Utilities
- Others
Geopolitical Impact Analysis
Trade conflict raises the cost of the tools that response teams use. In April 2025, the US put a baseline tariff of 10% on most imports. Tariffs on Chinese goods peaked at 145% before falling to 30% in May 2025. Forensic workstations, storage drives, and network sensors use chips and parts from Asia. These tariffs raise the cost of the forensic labs and deployable kits that providers maintain.
Shipping problems also slow hardware delivery. UNCTAD reported that Suez Canal traffic fell to 33 transits per day, 57% below its peak. Ship capacity sent around the Cape of Good Hope rose 89%. This route adds about 10 to 14 days of transit. Container ship demand rose 12% because of rerouting. Providers that ship on-site kits to Europe and Asia now face longer lead times.
Higher costs reach clients through prices. UNCTAD warned that the rise in freight rates could lift global consumer prices by 0.6%. Insurance and fuel costs on longer routes also add to total logistics costs of about 2% to 3%. Providers pass part of this to clients through higher retainer and hardware fees.
Geopolitical tension also creates new demand. The WTO cut its 2025 goods trade forecast as trade conflict spread. State-backed hacking groups target banks, energy grids, and government networks in these regions. The IMF and World Bank both list cyber risk as a growing threat to financial stability. As tension rises, firms add remote response services, which avoid shipping and travel delays.
Regional Analysis
North America dominates the Cloud Incident Response Services Market, holding a 37.9% share and generating USD 15.7 billion in revenue. The US drives most of this demand. Business email compromise caused USD 3.046 billion in reported US losses in 2025, the largest enterprise-focused threat.
Crypto-related complaints reached 181,565, with losses of USD 11.4 billion, up 22% from 2024. Victims aged 60 and older lost USD 7.7 billion, up 59% in one year. AI-related complaints reached 22,364, with more than USD 893 million in losses. These attacks hit banks, hospitals, and retailers. Each of them needs fast forensic and containment support.
Asia Pacific is the fastest-growing region in the market. India’s CERT-In handled about 2.04 million cyber incidents in 2024. India requires firms to report incidents within 6 hours. The Australian Signals Directorate received more than 87,400 cybercrime reports in FY2024, about 1 every 6 minutes. China, Japan, and South Korea keep expanding cloud use, which adds new attack surfaces.
Europe holds the second-largest position. The EU NIS2 Directive now covers 18 critical sectors. It sets fines of up to EUR 10 million or 2% of global turnover for essential entities. NIS2 also requires an early warning within 24 hours of a major incident. Germany, France, and the UK lead spending. The EU Digital Operational Resilience Act adds strict response testing for banks.
Key Regions and Countries
North America
- US
- Canada
Europe
- Germany
- France
- The UK
- Spain
- Italy
- Rest of Europe
Asia Pacific
- China
- Japan
- South Korea
- India
- Australia
- Rest of APAC
Latin America
- Brazil
- Mexico
- Rest of Latin America
Middle East and Africa
- GCC
- South Africa
- Rest of MEA
Market Dynamics
Drivers
| Driver | (~) % Impact on CAGR Forecast | Geographic Relevance | Impact Timeline |
|---|---|---|---|
| Mandatory Breach Disclosure Deadlines | +2.4% | North America, Europe | Short term (2 years or less) |
| Ransomware and Extortion Escalation | +2.1% | Global | Short term (2 years or less) |
| Cyber Insurance Panel-Mandated Retainers | +1.6% | North America, UK, Western Europe | Medium term (2 to 4 years) |
| Retainer-to-MDR Subscription Bundling | +1.3% | North America, Asia Pacific | Medium term (2 to 4 years) |
| Cloud and Identity Attack Surface Expansion | +1.1% | Global | Medium term (2 to 4 years) |
| Critical Infrastructure OT Intrusions | +0.8% | North America, Middle East, Europe | Long term (4 years or more) |
Mandatory Breach Disclosure Deadlines
Disclosure windows that run in hours or days have changed Cloud Incident Response from an occasional emergency purchase into a standing compliance cost. The U.S. SEC’s Form 8-K Item 1.05 rule requires listed issuers to disclose material cybersecurity incidents within 4 business days of determining materiality, and it has applied since December 2023.
The cost of missing these deadlines is high. Under the NIS2 directive text, fines for essential entities can reach €10 million or 2% of global turnover. IBM’s breach cost research puts the global average breach cost at USD 4.88 million in 2024, and found that organizations with tested IR teams and plans saved over USD 2 million per incident.
Restraints
| Restraint | (~) % Impact on CAGR Forecast | Geographic Relevance | Impact Timeline |
|---|---|---|---|
| SME Budget Constraints Under High Rates | -1.3% | Global, Emerging Markets | Short term (2 years or less) |
| Data Localization and Cross-Border Forensics Bans | -0.9% | China, India, Middle East, Russia | Medium term (2 to 4 years) |
| Insurer Panel Rate Caps | -0.7% | North America, UK | Short term (2 years or less) |
| Sovereign Vendor Exclusion Rules | -0.5% | Europe, Asia Pacific | Medium term (2 to 4 years) |
| In-House SOC Insourcing by Large Enterprises | -0.4% | North America, Western Europe | Long term (4 years or more) |
SME Budget Constraints Under High Rates
High policy rates have squeezed the discretionary security budgets of smaller firms. According to IMF World Economic Outlook tracking, policy rates in major advanced economies stayed above 4% through much of 2024. ECB and Federal Reserve lending surveys showed tighter credit standards for small firms over the same period. The OECD reports that SMEs make up about 99% of businesses and around 60% of private employment.
The bottleneck is affordability. Annual IR retainers usually start between USD 25,000 and USD 50,000. For companies with fewer than 250 employees, the UK Government’s Cyber Security Breaches Survey shows typical security spend is a fraction of that, and only about 22% of businesses have a formal Cloud Incident Response plan.
The result is that many SME buyers delay purchases and only engage a responder after a breach. That shrinks the pool of retainer customers. It also pushes providers toward lower-margin emergency work, where collecting payment after a breach is less certain and gross margins can fall by 5 to 8 percentage points.
Challenges
| Challenge | (~) % CAGR Friction Drag | Geographic Relevance | Mitigation Horizon |
|---|---|---|---|
| DFIR Talent Supply Deficit | -1.4% | Global | Long term (4 years or more) |
| Responder Burnout and Attrition | -0.6% | North America, Europe | Medium term (2 to 4 years) |
| Fragmented Multi-Jurisdiction Reporting | -0.5% | Europe, Asia Pacific | Medium term (2 to 4 years) |
| AI-Accelerated Attacker Dwell Compression | -0.4% | Global | Short term (2 years or less) |
| Telemetry Gaps in SaaS Environments | -0.3% | Global | Medium term (2 to 4 years) |
DFIR Talent Supply Deficit
The industry does not have enough trained responders. The ISC2 Cybersecurity Workforce Study estimated the global workforce gap at about 4.8 million professionals in 2024, a rise of 19% from the prior year. U.S. NIST CyberSeek data showed more than 450,000 open U.S. cybersecurity positions. Digital forensics and Cloud Incident Response (DFIR) roles are among the hardest to fill because they need 3 to 5 years of hands-on experience.
The shortage creates direct friction. U.S. Bureau of Labor Statistics data put median information security analyst pay above USD 120,000, and annual wage growth for senior responders runs 8% to 12%. When several clients are hit at once, providers turn down or queue engagements, so capacity, not demand, sets the ceiling on growth.
Providers will need lasting changes to cope. These include apprenticeship pipelines run with CISA and ENISA skills frameworks, automated playbooks that cut analyst hours per case by 20% to 30%, and delivery hubs in India and Eastern Europe to rebalance labor costs.
Opportunities
| Opportunity | (~) % Potential CAGR Upside | Geographic Relevance | Execution Window |
|---|---|---|---|
| Agentic AI-Driven Automated Response | +1.9% | Global | Medium term (2 to 4 years) |
| Fractional IR-as-a-Service for SMEs | +1.4% | Asia Pacific, Latin America, Europe | Short term (2 years or less) |
| OT and Medical Device Forensics | +1.0% | North America, Europe, Middle East | Long term (4 years or more) |
| Boutique DFIR Firm Roll-Ups | +0.8% | North America, Europe | Medium term (2 to 4 years) |
| Sovereign In-Region IR Delivery Hubs | +0.6% | Middle East, India, Southeast Asia | Medium term (2 to 4 years) |
Agentic AI-Driven Automated Response
Autonomous containment and triage is still largely unused. Most current AI deployments stop at alert summarization, and SEC filings and earnings calls from listed security vendors describe fully agentic response as still in early pilots. Containment, evidence collection, and first-pass root-cause analysis therefore remain mostly manual.
The unit economics are attractive. IBM breach cost research found that organizations using security AI and automation extensively cut breach lifecycles by about 100 days and lowered average costs by nearly USD 2.2 million.
Applied to service delivery, automation could cut the cost per engagement by 30% to 40% and lift gross margins from roughly 35% to 50%. It would also allow outcome-based pricing per contained incident. Guidance from NIST’s AI Risk Management Framework and CISA’s secure-by-design principles gives providers a governance baseline for launching these offerings in regulated sectors.
Key Players Analysis
Tier 1 leaders include Palo Alto Networks, CrowdStrike, Microsoft, Google, and IBM. Palo Alto Networks posted fiscal 2026 revenue of USD 11.5 billion, up 24%. Its fourth-quarter revenue rose 34% to USD 3.41 billion. The firm closed its USD 25 billion CyberArk deal in February 2026, which added identity security to its Unit 42 response business.
CrowdStrike reported fiscal 2026 revenue of USD 4.81 billion, up 22%. Subscription revenue reached USD 4.56 billion, and ARR grew 24% to USD 5.25 billion. The firm spends about 25% of revenue on research and development to grow its Falcon platform and its response services.
Google closed its USD 32 billion all-cash purchase of Wiz in March 2026, the largest deal in its history. Wiz passed USD 1 billion in ARR in 2025. Combined with Mandiant, the deal makes Google Cloud a strong response provider for cloud incidents. Microsoft reported more than USD 20 billion in annual security revenue.
Tier 2 challengers include Rapid7, NCC Group, Check Point, and Kroll. The large consulting firms, Accenture, Deloitte, PwC, EY, and KPMG, also compete in this tier. Rapid7 earns more than USD 800 million in yearly revenue. These firms win business through global consulting networks, forensic depth, and strong ties with regulators.
Top Key Players in the Market
- CrowdStrike Holdings, Inc.
- Google LLC
- IBM Corporation
- Palo Alto Networks, Inc.
- Microsoft Corporation
- Cisco Systems, Inc.
- Rapid7, Inc.
- NCC Group plc
- Check Point Software Technologies Ltd.
- Kroll LLC
- Accenture plc
- Deloitte Touche Tohmatsu Limited
- PricewaterhouseCoopers (PwC)
- Ernst and Young Global Limited (EY)
- KPMG International Limited
Recent Developments
- In July 2025, Palo Alto Networks agreed to buy CyberArk for about USD 25 billion, offering USD 45.00 in cash and 2.2005 Palo Alto shares for each CyberArk share.
- In September 2025, CrowdStrike agreed to buy data pipeline firm Onum for about USD 290 million to speed up threat detection and response.
- In March 2026, Google completed its USD 32 billion purchase of Wiz after US and EU approvals, adding a business with more than USD 1 billion in ARR.
Report Scope
| Report Features | Description |
|---|---|
| Market Value (2025) | USD 41.4 Billion |
| Forecast Revenue (2035) | USD 257.0 Billion |
| CAGR (2026-2035) | 20.1% |
| Base Year for Estimation | 2025 |
| Historic Period | 2020-2024 |
| Forecast Period | 2026-2035 |
| Report Coverage | Revenue Forecast, Market Dynamics, Competitive Landscape, Recent Developments |
| Segments Covered | By Service Type (Assessment and Preparedness (Cloud Incident Response Readiness Assessment, Cloud Incident Response Planning and Playbook Development, Tabletop Exercises and Simulations), Investigation and Digital Forensics (Digital Forensic Investigation, Malware Analysis), Containment and Eradication, Remediation and Recovery, Advanced Threat Hunting, Other); By Engagement Model (Retainer-Based Services, On-Demand Consulting and Emergency Response, Managed Cloud Incident Response Services); By Security Type (Endpoint Security, Network Security, Cloud Security, Application Security, Web Security); By Service Delivery Mode (Remote, On-Site, Hybrid); By Organization Size (Small and Medium-Sized Enterprises (SMEs), Large Enterprises); By End-Use Industry (Banking, Financial Services, and Insurance (BFSI), IT and Telecommunications, Healthcare, Government and Defense, Retail, Energy and Utilities, Others) |
| Regional Analysis | North America – US, Canada; Europe – Germany, France, The UK, Spain, Italy, Rest of Europe; Asia Pacific – China, Japan, South Korea, India, Australia, Singapore, Rest of APAC; Latin America – Brazil, Mexico, Rest of Latin America; Middle East & Africa – GCC, South Africa, Rest of MEA |
| Competitive Landscape | CrowdStrike Holdings, Inc., Google LLC, IBM Corporation, Palo Alto Networks, Inc., Microsoft Corporation, Cisco Systems, Inc., Rapid7, Inc., NCC Group plc, Check Point Software Technologies Ltd., Kroll LLC, Accenture plc, Deloitte Touche Tohmatsu Limited, PricewaterhouseCoopers (PwC), Ernst and Young Global Limited (EY), KPMG International Limited |
| Customization Scope | Customization for segments, region/country-level will be provided. Moreover, additional customization can be done based on the requirements. |
| Purchase Options | We have three licenses to opt for: Single User License, Multi-User License (Up to 5 Users), Corporate Use License (Unlimited Users and Printable |