


Report Overview
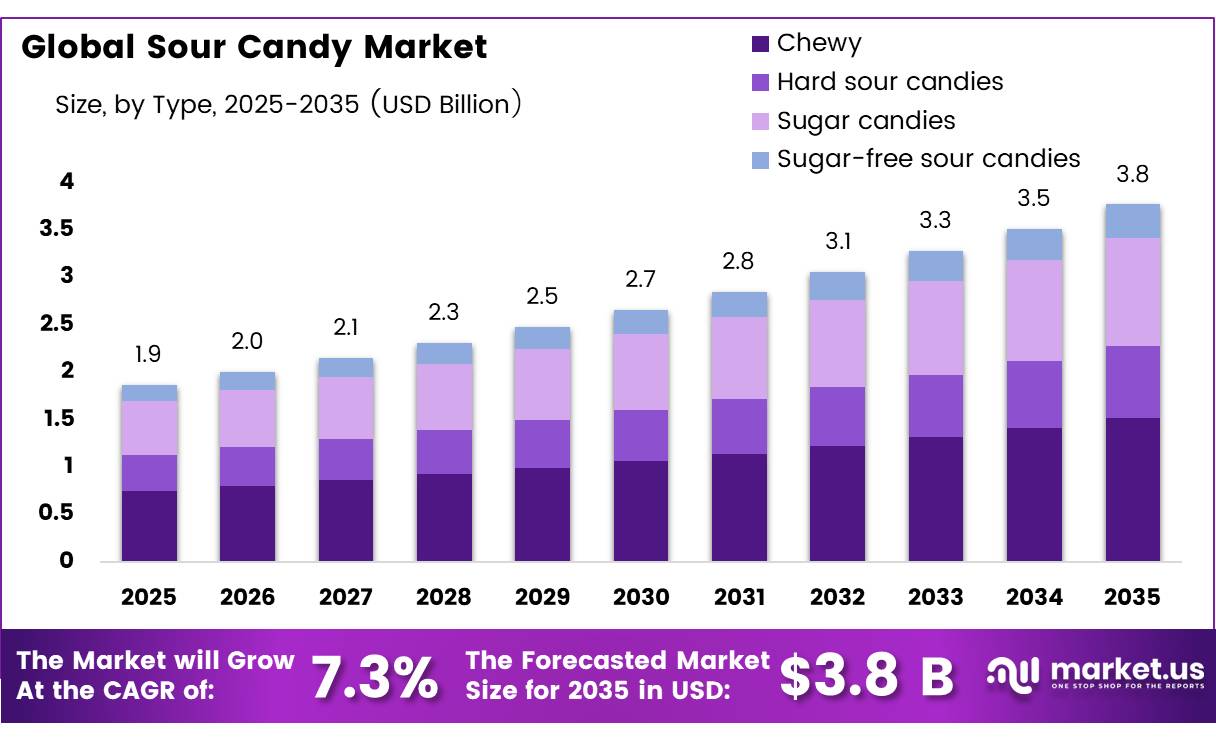
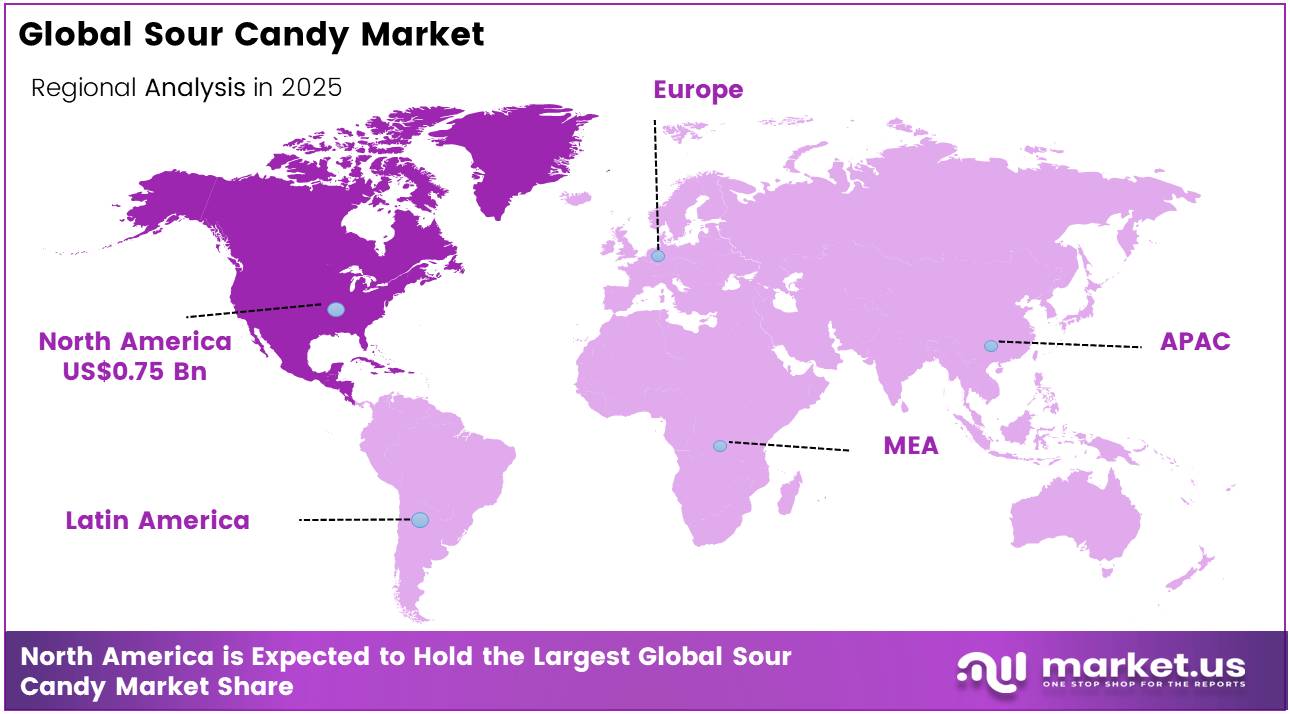
In 2025, the Global Sour Candy Market was valued at USD 1.9 billion, and between 2026 and 2035, this market is projected to grow at a CAGR of 7.3%, reaching about USD 3.8 billion by 2035. In 2025, North America held a dominant market position, capturing more than a 40.1% share, holding USD 0.7 Billion revenue.
This growth is supported by increasing confectionery consumption, stable sugar demand, expanding sugar production, and continued product innovation across the candy industry.These factors enable manufacturers to continuously introduce new sour candy products while complying with evolving nutritional regulations.
- According to the USDA, U.S. sugar deliveries for food are estimated at approximately 12.275 million short tons in 2024/25, reflecting stable demand from confectionery categories such as candies, chewing gums, and chewy sweets. Consumer consumption patterns also remain favorable. Data from the CDC show that Americans consume an average of 17 teaspoons of added sugar per day, with desserts and sweet snacks remaining among the largest sources of sugar intake.
- On the supply side, the OECD-FAO projects global sugar production to increase from about 178 million tons to 205 million tons by 2034, primarily driven by growth across Asian markets. This expanding supply base provides confectionery manufacturers with reliable access to a key raw material for future production growth.
Key Takeaways
- The global Sour Candy Market was valued at USD 1.9 billion in 2025.
- The global Sour Candy Market is projected to grow at a CAGR of 7.3% and is estimated to reach USD 3.8 billion by 2035.
- On the basis of type, Chewy Sour Candy dominated the market, constituting 40.1% of the total market share.
- Based on the flavor, the Fruit flavors dominated the Sour Candy Market, with a substantial market share of around 44.1%.
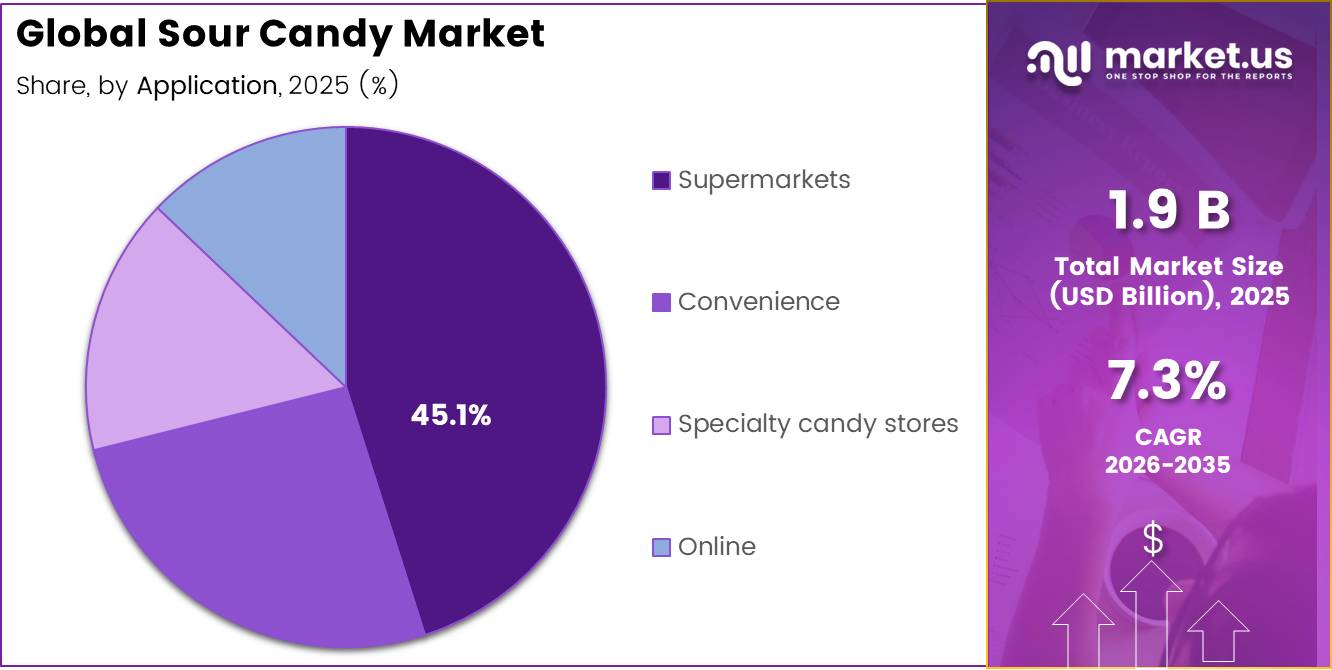
- Based on the Application, Supermarkets led the market, comprising 45.1% of the total market.
- In 2025, the North America was the most dominant region in the Sour Candy Market, accounting for 40.1% of the total global consumption.
Regulatory developments are also influencing market dynamics and creating opportunities for differentiated confectionery products. The World Health Organization (WHO) supports fiscal measures, including sugar taxes, to reduce free sugar consumption, encouraging manufacturers to develop lower-sugar, portion-controlled, and value-added products. Sour candy is well positioned within this environment because ingredients such as citric acid, malic acid, and tartaric acid deliver strong flavor intensity while allowing reductions in sugar content.
With more than 80 countries either implementing or considering sugar taxes and stricter food-labeling regulations, confectionery companies are increasing investments in product innovation. Industry efforts are focused on reduced-sugar formulations, layered sour flavor profiles, and novel textures that enhance consumer experience. These innovations are strengthening the competitive position of sour candy compared with traditional confectionery products.
Type Analysis
Chewy Sour Candy represents dominant Segment in the Market.
Chewy sour candy accounts for approximately 40.1% of the global sour candy market, making it the largest product segment. Its leadership is strongly supported by the widespread availability and affordability of sugar, which is the primary ingredient used to create the soft and chewy texture consumers prefer. According to the USDA Sugar and Sweeteners Outlook (June 2025), U.S. food and beverage sugar deliveries for 2024/25 are estimated at 12.125 million short tons (raw value), highlighting the large-scale supply available to food manufacturers.
- In addition, USDA Economic Research Service data shows that per-capita refined sugar availability reached 68.4 pounds per person in 2023, supporting strong consumption of confectionery products. Looking globally, the OECD-FAO Agricultural Outlook 2025–2034 projects world sugar consumption to grow by 1.2% annually, reaching 202 million metric tonnes by 2034. Rising populations and increasing disposable incomes, particularly across Asia and Africa, are expected to boost demand for affordable treats such as chewy candies.
Sugar-free sour candy is the fastest-growing segment. Growth is being driven by increasing consumer focus on healthier diets and regulatory efforts to reduce sugar consumption. The World Health Organization (WHO) recommends limiting free sugar intake to less than 10% of total daily energy intake and suggests reducing it further to below 5% for additional health benefits. In response, manufacturers are expanding sugar-free product offerings. The U.S. FDA has approved 6 high-intensity sweeteners saccharin, aspartame, acesulfame potassium, sucralose, neotame, and advantame and recognizes stevia and monk fruit extracts as safe ingredients.
Flavor Analysis
Fruit flavors a significant type.
Fruit flavors account for the largest share of the global sour candy market, representing approximately 44.1% of total revenue. Their leadership is driven by strong consumer familiarity, broad flavor acceptance, and reliable raw material availability. Popular fruit-based varieties such as strawberry, lemon, lime, and cherry remain core products across major sour candy brands, benefiting from long-standing consumer preference and repeat purchases. Among these, citrus flavors hold a particularly strong position because they deliver the tart taste profile that consumers associate with sour candy while also supporting efficient product formulation.
- According to the USDA National Agricultural Statistics Service, U.S. citrus utilized production reached 5.02 million tons during the 2024–25 season, with California contributing 84% of total national output. In addition, the USDA Foreign Agricultural Service projects continued strong citrus utilization across the 2024/25 and 2025/26 marketing years. This stable supply environment supports ingredient availability, cost predictability, and consistent production, reinforcing the dominance of fruit flavors in the global sour candy market.
From a manufacturing perspective, citrus ingredients provide a dual advantage by serving as both flavor sources and suppliers of citric acid, one of the most widely used acidulants in sour confectionery products. This reduces formulation complexity and helps manufacturers maintain consistent flavor profiles and production costs. Supply availability further strengthens the segment’s position.
Application Analysis
Supermarkets Are the Most Widely Used.
Supermarkets hold the largest share of the global sour candy distribution market, accounting for 45.1%, due to their strong retail reach, high customer traffic, and ability to drive impulse purchases. According to the USDA Economic Research Service (ERS), grocery stores, including supermarkets, represented 92.1% of total U.S. food store sales, highlighting their central role in packaged food distribution. Sour candy is largely an impulse-buy product, and supermarkets are well positioned to capture these purchases through strategic placement in checkout lanes and high-visibility promotional areas.
The Food Industry Association reported that 45,575 supermarkets operated across the U.S. in 2024, generating average weekly sales of $711,806 per store. Supermarkets also benefit from their ability to run large-scale seasonal promotions during major holidays, supported by extensive shelf space and dedicated merchandising displays. These advantages enable supermarkets to maintain their leading position in sour candy sales compared with convenience stores and specialty retail formats.
Key Market Segments
By Type
- Chewy
- Hard sour candies
- Sugar candies
- Sugar‑free sour candies
By Flavor
- Fruit flavors
- Tropical / novelty
- Other / specialty flavors
By Application
- Supermarkets
- Convenience
- Specialty candy stores
- Online
Driver Analysis
Gen Z-led sour flavor experimentation
Sour candy is benefiting from a demand mix that is more experience-driven than legacy sweet-only confectionery, with younger consumers showing disproportionate willingness to trial sour, spicy, and “mystery” profiles; the National Confectioners Association reporting cited in trade coverage shows Gen Z candy spending rose 47% year over year, while Millennials are also moving toward leadership in non-chocolate candy purchases, reinforcing the customer pool most aligned to sour formats.
This matters for CAGR because sour candy converts novelty into repeat purchase more effectively than one-time seasonal candy when brands can rotate acid intensity, dual-flavor combinations, and imported-style textures across peg-bag and theater-channel assortments; operationally, it improves velocity per facing without requiring a full brand relaunch, which lowers customer acquisition cost relative to new masterbrand creation. For 2026, the demand effect is strongest in North America and Western Europe because these markets already support rapid flavor testing, convenience-channel resets, and premium impulse buying, making a roughly +1.4 percentage-point CAGR uplift plausible versus a flat non-innovative baseline.
Drivers Impact Analysis
| Driver | (~) % Impact on CAGR | Geographic Relevance | Impact Timeline |
|---|---|---|---|
| Gen Z-led sour flavor experimentation | +1.4% | North America core, UK/EU, urban APAC spill-over | Short term (≤ 2 years) |
| New SKU pipeline in gummies, strips, fizz formats | +1.1% | North America core, Western Europe, selective Gulf and APAC import channels | Short term (≤ 2 years) |
| Sugar-free and reduced-sugar sour positioning | +0.9% | North America, EU, Australia, premium urban Asia | Medium term (2-4 years) |
| U.S. dye reformulation and cleaner-label reset | +0.6% | U.S. core, Canada adjacency, EU benchmark effect | Medium term (2-4 years) |
| EU packaging compliance and recyclable format redesign | +0.4% | EU core, UK alignment risk, exporters into Europe | Medium term (2-4 years) |
| Inflation-led premiumization and small-pack price architecture | +0.7% | U.S., Canada, Western Europe, India metros, LATAM spill-over | Short term (≤ 2 years) |
Restraint Analysis
Volatile sugar & sweetener costs
Volatility in sugar and sweetener costs is a structural restraint because it compresses gross margins and forces price increases that can slow sour candy volume growth, with U.S. data showing sugar and sweets prices in May 2026 were 7.1% higher than a year earlier and forecast to rise about 6.9% for full-year 2026, while long-run analysis indicates U.S. sugar has averaged roughly 80–90% above world prices due to policy, creating sustained cost overhang versus global benchmarks.
For sour candy specifically, sugar typically represents 25–35% of material cost and can reach 40% in high-sugar hard formats, so a mid-single-digit annual price increase, when combined with rising labor and packaging costs, can erode EBITDA margins by 150–250 basis points for subscale players, forcing either list-price increases or grammage reductions that weaken perceived value and may trim CAGR by an estimated 1.2 percentage points versus a stable-cost scenario.
Restraint Impact Analysis
| Restraint | (~) % Impact on CAGR | Geographic Relevance | Impact Timeline |
|---|---|---|---|
| Volatile sugar & sweetener costs | -1.2% | North America core, EU, APAC corridors, LATAM | Short term (≤ 2 years) |
| Tightening color & ingredient rules | -1.0% | U.S., Canada, EU, UK | Medium term (2-4 years) |
| Front-of-pack nutrition & HFSS policies | -0.9% | Canada, UK, EU, select APAC | Medium term (2-4 years) |
| Subscale manufacturing & automation gaps | -0.8% | Emerging APAC, LATAM, MENA | Long term (≥ 4 years) |
| Logistics, cold-chain & lead-time risk | -0.7% | Global export corridors | Short term (≤ 2 years) |
| Private-label & price-war pressure | -0.6% | North America, EU, India, Brazil | Medium term (2-4 years) |
Opportunity Analysis
Plant-based, halal & clean-label sour
Strategically, building unified platforms fully vegan sour gummy ranges, formally halal-certified sour assortments for MENA and Muslim-majority markets, and “no artificial color” or “few-ingredient” sour lines for EU consumers would allow manufacturers to tap into large but currently under-served pockets of TAM: for example, the Muslim population exceeding 1.8–2.0 billion globally, substantial vegan and flexitarian cohorts in Europe and India, and environmentally and ingredient-conscious shoppers in urban centers.
Execution requires reformulating gelatin-based sour products with pectin or starch systems, certifying plants and recipes to halal or other religious standards, and aligning with impending color and ingredient regulations in North America and Europe, but the payoff is attractive: these ranges can command 20–30% premium price points, expand margins by 200–400 basis points via reduced discounting, and open new export corridors into markets where conventional sour candy struggles with compliance, collectively offering around 1.3 percentage points of CAGR upside as a distinct, purpose-built platform rather than merely an incremental driver of existing lines.
Opportunity Impact Analysis
| Opportunity | (~) % Potential CAGR | Geographic Relevance | Execution Window |
|---|---|---|---|
| Sugar-free & BFY sour platforms | +1.5% | North America core, EU, urban APAC | Short term (≤ 2 years) |
| Plant-based, halal & clean-label sour | +1.3% | EU, MENA, India, SE Asia | Medium term (2-4 years) |
| Sour candy as snack & meal-topper | +1.1% | U.S., EU, Japan, Korea | Medium term (2-4 years) |
| Interactive, AR-linked sour experiences | +1.0% | North America, Western Europe, tech-forward APAC | Medium term (2-4 years) |
| D2C personalization & subscription bundles | +0.9% | U.S., UK, Germany, Australia | Short term (≤ 2 years) |
| M&A roll-ups in fragmented local brands | +1.2% | India, LATAM, ASEAN, Africa corridors | Long term (≥ 4 years) |
Challenges Analysis
Throughput vs. SKU flexibility
Typical medium-sized confectionery plants running deposited gummies or hard sour candies face line speeds in the range of tens of thousands of pieces per minute, but frequent changeovers for new sour intensity levels, colorways, or promotional packs can add 45–120 minutes of downtime per switch, and plants carrying 150–250 active SKUs often see 10–15% of scheduled time lost to cleaning, allergen segregation, and packaging reconfiguration.
This friction translates into higher conversion cost per kilogram, increased scrap from off-spec batches, and more complex production planning, forcing companies to choose between broader assortments that drive top-line growth and streamlined portfolios that preserve margins; the net effect is a realistic drag of about 1.0 percentage point on maximum achievable CAGR, as some incremental demand is left unmet or delayed due to capacity constraints and cautious production scheduling.
Challenges Impact Analysis
| Challenge | (~) % CAGR Friction | Geographic Relevance | Mitigation Horizon |
|---|---|---|---|
| Throughput vs. SKU flexibility | -1.0% | North America core, EU hubs, APAC export plants | Medium term (2-4 years) |
| Food safety & dust compliance | -0.9% | U.S., EU regulatory hubs, global factories | Long term (≥ 4 years) |
| Labor gaps & skills scarcity | -0.8% | North America, Europe, emerging APAC | Long term (≥ 4 years) |
| Logistics, cold-chain & transit risk | -0.8% | Global logistics corridors, key ports | Medium term (2-4 years) |
| Contract manufacturing dependency | -0.7% | U.S., EU, OEM-heavy APAC | Medium term (2-4 years) |
| Digital traceability & data integration | -0.6% | Global multi-plant operators | Long term (≥ 4 years) |
Geopolitical Impact Analysis
Geopolitical Realignment and Supply Chain Fragmentation Reshaping Sour Candy Manufacturing.
The global sour candy market is experiencing growing pressure from geopolitical trade disruptions, particularly the US–China tariff conflict. In mid-2025, US tariffs on Chinese imports were reduced from 145% to 30% under a 90-day truce, but sourcing challenges remain. This is highly relevant to sour candy manufacturers because China is a major global supplier of citric acid and malic acid, the key ingredients responsible for sour flavor.
China’s citric acid exports were valued at approximately USD 2 billion, highlighting its importance in the supply chain. As a result, manufacturers relying on Chinese acidulants faced raw material cost increases of around 8–25%, while shifting purchases to alternative suppliers often extended delivery times by 30–45 days. In addition, the WTO projects global merchandise trade growth to decline by 0.2% in 2025, with potential downside risk of a 1.5% contraction, creating further uncertainty for ingredient sourcing and procurement activities.
Transportation challenges are adding to cost pressures across the industry. Ongoing security disruptions in the Red Sea have forced many Asia–Europe shipping routes to divert around the Cape of Good Hope, increasing transit distances and delivery times. The Shanghai Containerized Freight Index averaged 2,496 points in 2024, up 149% from 2023, while spot rates peaked at 3,600 points in July 2024.
- According to UNCTAD, these rerouted routes increased global container ton-miles by 17% and added up to 17 days to shipping times. This has raised the landed cost of key confectionery inputs such as sugar, glucose syrup, and gelatin. Although the World Bank forecasts a 7% decline in global food commodity prices in 2025, the benefit is largely offset by continued tariff-related inflation in acidulant costs, keeping overall production expenses elevated for sour candy manufacturers.
Regional Analysis
North America Held the Largest Share of the Global Sour Candy Market.
North America leads the global sour candy market with a 40.1% share. This is due to strong traditions of eating sweets, organized retail, and lots of available sweeteners. The U.S. is the main driver, helped by a steady supply of sugar. This keeps candies constantly on shelves. Furthermore, the USDA ERS noted that in 2023, each person had access to 68.4 pounds of refined sugar. This intensive use of sweeteners helps maintain those high sour candy volumes. So, all these factors together keep North America’s strong hold on the market.
Asia Pacific growing due to rapid urbanization and increased spending on treats. The FAO’s Agricultural Outlook shows that urban growth and income hikes in Asia boost global confectionery demand. This happens because sugar consumption there is still relatively low, so there’s a lot of room for growth.
Key Regions and Countries Covered
- North America
- The US
- Canada
- Europe
- Germany
- France
- The UK
- Spain
- Italy
- Russia & CIS
- Rest of Europe
- APAC
- China
- Japan
- South Korea
- India
- ASEAN
- Rest of APAC
- Latin America
- Brazil
- Mexico
- Rest of Latin America
- Middle East & Africa
- GCC
- South Africa
- Rest of MEA
Key Players Analysis
Sour candy makers focus on boosting product uniqueness, creating new formulas, and improving how they distribute their goods to stay ahead. A big part of this involves always looking for fresh ingredients, like developing sweets with less sugar, no sugar, or even adding health benefits. They use high-intensity sweeteners like stevia and sugar alcohols for this.
These businesses expand into grocery stores, convenience stores, and online platforms, especially in North America and Asia Pacific. This lets them reach areas where there’s lots of demand for their products. To stand out, they introduce unique flavors, cool packaging, and special edition treats. Plus, they sign deals with the biggest retailers to put their candies in premium spots, driving home their position in the health-focused sweets market.
The Major Players In The Industry
- Mondelez International, Inc.
- The Hershey Company
- Ferrara Candy Company
- Wrigley Jr. Company
- Haribo GmbH & Co. KG
- Perfetti Van Melle
- Jelly Belly Candy Company
- Tootsie Roll Industries, Inc.
- Albanese Confectionery Group, Inc.
- The Topps Company, Inc.
- Taffy Town, Inc.
- SmartSweets
- Impact Confections (Warheads)
- YumEarth
- Nestlé S.A.
- Others
Key Development
- In November 2024, The Hershey Company bought Sour Strips, a rapidly growing sour candy brand, to beef up their position in the sour candies market and get their products to more people through big retailers like Walmart, Target, and Amazon.
- In May 2024, SmartSweets upgraded their sour candies, making Sour Blast Buddies and Sourmelon Bites super sour and chewier. The best part? They’ve only got up to 8% of the sugar found in typical candy.
Report Scope
| Report Features | Description |
|---|---|
| Market Value (2025) | USD 1.9 Bn |
| Forecast Revenue (2035) | USD 3.8 Bn |
| CAGR (2026-2035) | 7.3% |
| Base Year for Estimation | 2025 |
| Historic Period | 2020-2024 |
| Forecast Period | 2026-2035 |
| Report Coverage | Revenue Forecast, Market Dynamics, Competitive Landscape, Recent Developments |
| Segments Covered | By Type (Chewy , Hard sour candies, Sugar candies ,Sugar‑free sour candies ), By Flavor ( Fruit flavors, Tropical / novelty, Other / specialty flavors ), By Application (Supermarkets, Convenience, Specialty candy stores, Online ) |
| Regional Analysis | North America – The US & Canada; Europe – Germany, France, The UK, Spain, Italy, Russia & CIS, Rest of Europe; APAC– China, Japan, South Korea, India, ASEAN & Rest of APAC; Latin America– Brazil, Mexico & Rest of Latin America; Middle East & Africa– GCC, South Africa, & Rest of MEA |
| Competitive Landscape | Mondelez International, Inc., The Hershey Company, Ferrara Candy Company, Wm. Wrigley Jr. Company, Haribo GmbH & Co. KG, Perfetti Van Melle, Jelly Belly Candy Company, Tootsie Roll Industries, Inc., Albanese Confectionery Group, Inc., The Topps Company, Inc., Taffy Town, Inc., SmartSweets, Impact Confections (Warheads), YumEarth, Nestlé S.A., Others. |
| Customization Scope | Customization for segments, region/country-level will be provided. Moreover, additional customization can be done based on the requirements. |
| Purchase Options | We have three licenses to opt for: Single User License, Multi-User License (Up to 5 Users), Corporate Use License (Unlimited Users and Printable PDF) |





































