


Report Overview
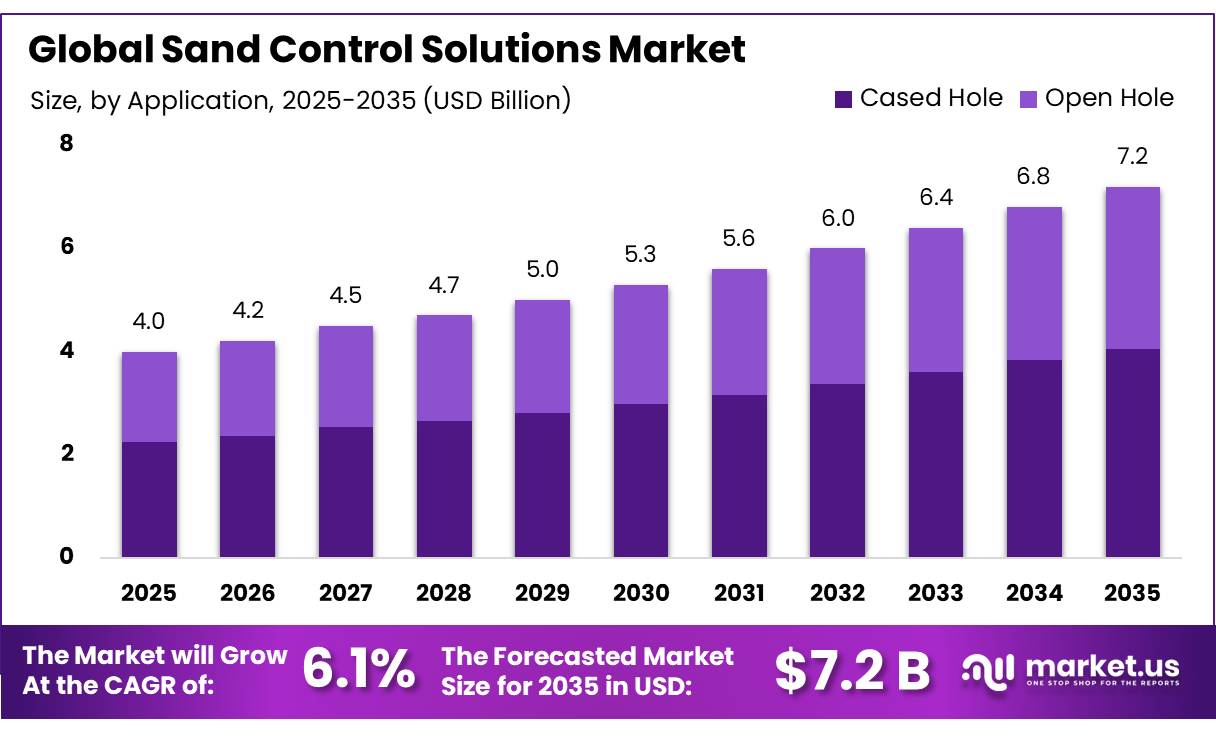
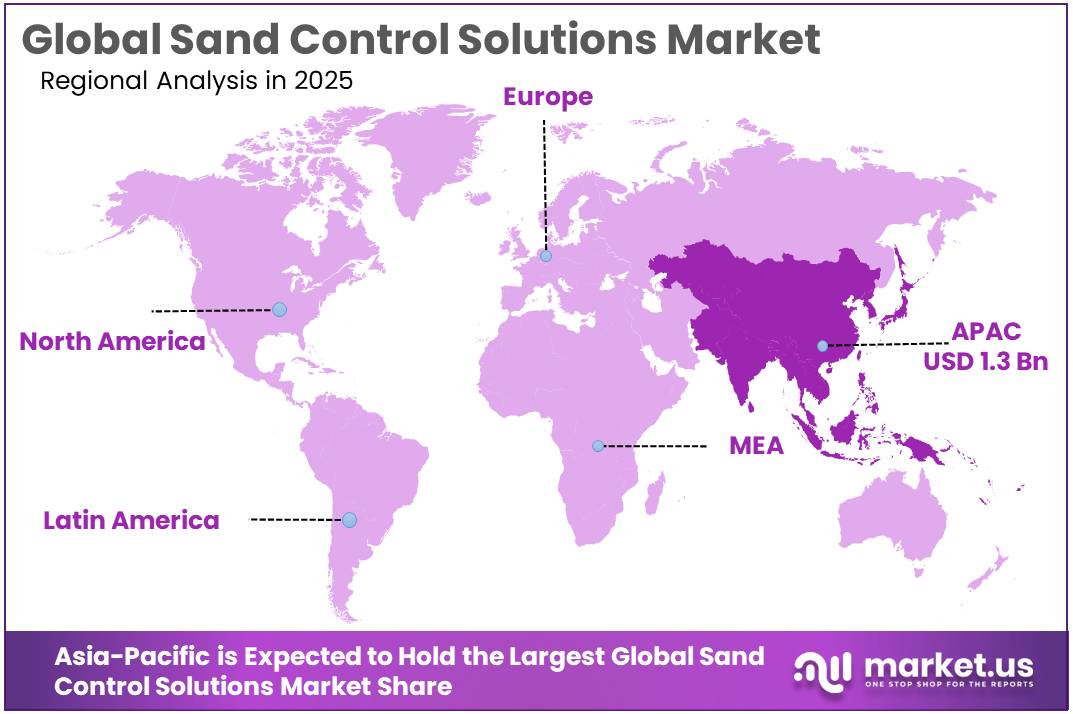
The Global Sand Control Solutions Market size is expected to be worth around USD 7.2 Billion by 2035, from USD 4.0 Billion in 2025, growing at a CAGR of 6.1% during the forecast period from 2026 to 2035. In 2025, Asia-Pacific held a dominant market position, capturing more than a 34.21% share, holding USD 1.3 Billion revenue.
Sand control solutions are specialized technologies used in oil and natural gas wells to prevent sand and other formation particles from entering the wellbore along with produced fluids. These solutions include gravel packing, sand control screens, frac-pack systems, and chemical consolidation methods. They help protect pumps, valves, pipelines, and other production equipment from erosion and blockages while maintaining stable production.
- According to the U.S. Energy Information Administration, United States crude oil production reached a record 13.2 million barrels per day in 2024, representing a 2% increase from 2023. The Permian region, spanning parts of Texas and New Mexico, accounted for 48% of total United States crude oil production that year. These figures illustrate the scale of production activity that requires dependable well completion and production-management technologies.
Driving factors include the need to reduce unplanned well interventions, limit equipment wear, improve production continuity, and extend the productive life of oil and gas assets. Offshore operations provide a particularly important application because equipment replacement and well intervention can require substantial vessel, rig, and logistical resources.
- The U.S. Bureau of Ocean Energy Management reported that offshore federal production reached approximately 668 million barrels of oil and 700 billion cubic feet of natural gas in fiscal year 2024, accounting for about 14% of domestic oil production and 2% of domestic natural gas production. This production base highlights the operational importance of dependable completion systems in offshore reservoirs.
Technological development is creating further opportunities for the sand control solutions industry. In May 2026, Halliburton introduced its Optimized Single-Trip Multi-Zone sand control system, designed to treat multiple production zones in one trip without repeated tool repositioning or surface-equipment testing. Such systems aim to reduce rig time, simplify completion operations, and lower total operating costs. Halliburton has also reported that its Endurance Hydraulic Screen systems reduced overall completion time by 35% to 50% in a North Sea application, illustrating the potential benefits of simplified installation. These are company-reported results from specific applications, rather than industry-wide performance figures.
Future growth opportunities are expected to emerge from deepwater exploration, mature-field redevelopment, complex multizone wells, and demand for completion technologies that reduce intervention requirements. Government-supported research also provides a foundation for continued technical development.
The United States Department of Energy supports offshore research focused on subsea reliability, automation, well control, and improved recovery through industry and research partnerships. These priorities are relevant to the development of more durable screens, improved gravel-pack placement, advanced monitoring systems, and materials suited to demanding reservoir conditions.
Key Takeaways
- Sand Control Solutions Market size is expected to be worth around USD 7.2 Billion by 2035, from USD 4.0 Billion in 2025, growing at a CAGR of 6.1%.
- Gravel Pack held a dominant market position, capturing more than a 43.78% share.
- Cased Hole held a dominant market position, capturing more than a 56.34% share.
- Horizontal held a dominant market position, capturing more than a 43.23% share.
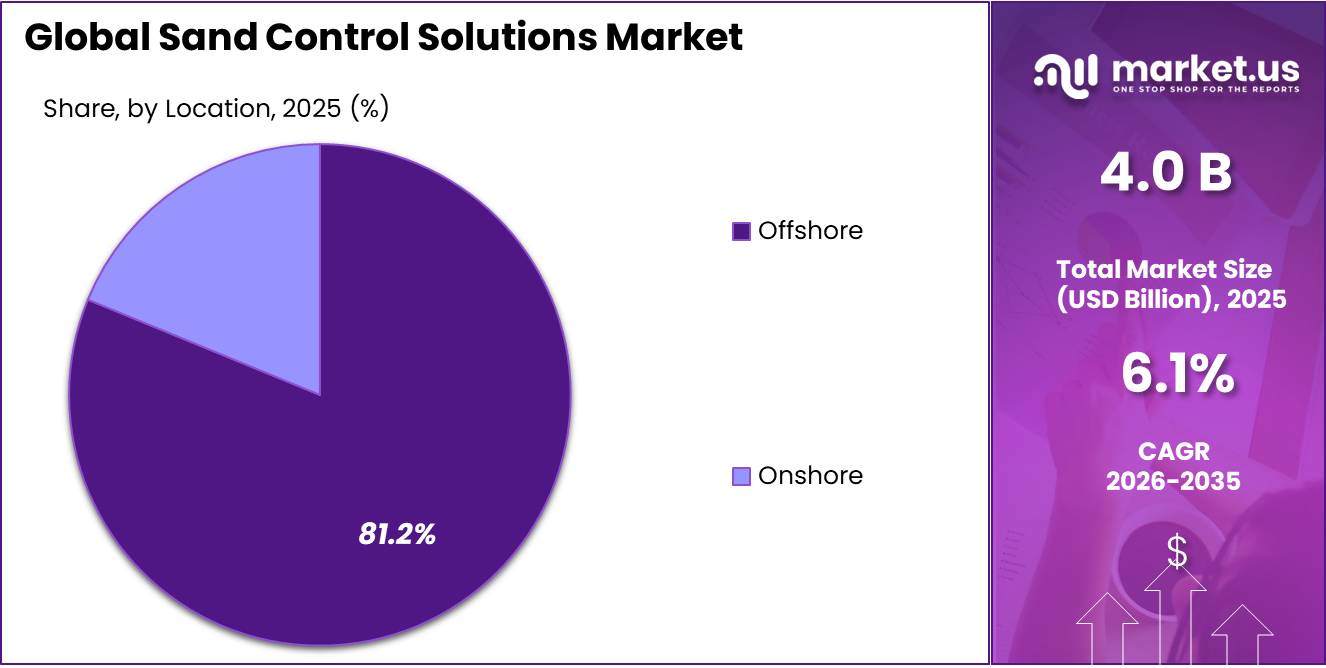
- Offshore held a dominant market position, capturing more than an 81.23% share.
- Asia-Pacific held a dominant position in the Sand Control Solutions Market, accounting for a supplied share of 34.21%, valued at USD 1.3 billion.
By Type Analysis
Gravel Pack leads with a 43.78% share due to its role in controlling formation sand and supporting well productivity.
In 2025, “Gravel Pack” held a dominant market position, capturing more than a 43.78% share. Gravel packing is widely used in oil and gas wells to prevent formation sand from entering production equipment while allowing oil and gas to flow through the completion. The method places sized gravel around a specially designed screen to retain sand particles and reduce the risk of erosion, blockages, and production interruptions. Its suitability for unconsolidated reservoirs supports its use in both onshore and offshore well-completion projects. The 43.78% figure is the supplied market share; it is not a government statistic.
Frac Pack combines hydraulic fracturing with gravel-pack sand control to improve reservoir flow while limiting the movement of formation sand into the well. The technique is particularly useful in reservoirs where low permeability or sand production can restrict well performance. In 2025, demand for frac-pack solutions was supported by the need to improve well productivity, protect completion equipment, and reduce costly intervention work.
According to the U.S. Bureau of Ocean Energy Management, offshore federal production reached approximately 668 million barrels of oil and 700 billion cubic feet of natural gas in fiscal year 2024, demonstrating the scale of offshore operations where advanced completion technologies may be required. These government production figures provide industry context and do not represent the frac-pack segment’s market share.
By Application Analysis
Cased Hole leads with a 56.34% share due to its controlled well structure and compatibility with established completion methods.
In 2025, “Cased Hole” held a dominant market position, capturing more than a 56.34% share. Cased-hole sand control is used when steel casing is installed and cemented in the well before selected production intervals are opened. This structure allows operators to manage production zones and install sand control equipment suited to the reservoir’s conditions. The approach is valuable in wells where formation sand can damage production equipment, restrict flow, or increase maintenance requirements. Its compatibility with gravel-pack systems and other completion technologies supports its use in complex oil and gas developments.
“Open Hole” sand control solutions are installed in the reservoir section without cementing casing across the production interval. This approach commonly uses screen systems and gravel packing to limit sand entry while allowing oil and gas to flow into the well. In 2025, open-hole applications continued to offer an option for operators seeking effective sand management with fewer completion steps across suitable reservoir formations.
Their suitability depends on well stability, formation characteristics, and the ability to maintain reliable sand retention. The U.S. Bureau of Ocean Energy Management reported that offshore federal production reached approximately 668 million barrels of oil and 700 billion cubic feet of natural gas in fiscal year 2024, demonstrating the scale of offshore activity that can support demand for advanced well-completion technologies.
By Well Type Analysis
Horizontal wells lead with a 43.23% share, supported by their ability to access larger reservoir sections.
In 2025, “Horizontal” held a dominant market position, capturing more than a 43.23% share. Horizontal wells extend through the reservoir over a longer distance than conventional vertical wells, increasing contact with oil- or gas-bearing formations. However, this longer contact can also expose the well to sand production, making suitable screens, gravel packing, and other sand control technologies important in unconsolidated formations. Operators use these solutions to reduce equipment damage, maintain production flow, and limit costly well interventions. Horizontal drilling is particularly relevant in unconventional reservoirs and complex offshore developments where well design plays an important role in production efficiency.
“Vertical” wells are drilled mainly downward toward the target reservoir and are often suitable for conventional oil and gas formations. Sand control systems in these wells help prevent formation particles from entering the production stream, reducing the risk of equipment wear, flow restrictions, and maintenance requirements.
According to the U.S. Energy Information Administration, horizontal wells accounted for 22% of producing U.S. oil and natural gas wells in 2024, compared with 10% in 2014. This government data highlights the growing role of horizontal drilling and provides context for sand control technology demand across well types.
By Location Analysis
Offshore leads with an 81.23% share, supported by complex well conditions and the need for reliable sand control.
In 2025, “Offshore” held a dominant market position, capturing more than an 81.23% share. Offshore oil and gas wells often operate under demanding conditions, where formation sand can damage production equipment, restrict fluid flow, and increase the cost of maintenance. Sand control screens, gravel-pack systems, and frac-pack completions help operators manage these risks and maintain production reliability. Deepwater and other technically challenging developments can increase the importance of effective sand control because well interventions may require specialized equipment and substantial logistical support.
“Onshore” sand control solutions are used in land-based oil and gas wells to prevent formation particles from entering production equipment and disrupting flow. Operators may use screens, gravel packs, and other completion methods depending on reservoir conditions, well design, and sand-production risks. In 2025, onshore applications remained relevant for conventional fields and mature wells where production efficiency, equipment protection, and maintenance costs influenced completion decisions. Although onshore wells can generally be accessed more easily than offshore wells, effective sand control remains important for reducing erosion and avoiding unplanned interventions.
For comparison, the U.S. Bureau of Ocean Energy Management reported that offshore federal production reached approximately 668 million barrels of oil and 700 billion cubic feet of natural gas in fiscal year 2024, accounting for 14% of domestic oil production and 2% of domestic natural gas production. These official figures provide context for the offshore segment’s importance, rather than direct onshore market measurements.
Key Market Segments
By Type
- Gravel Pack
- Frac Pack
- Sand Screens
By Application
- Open Hole
- Cased Hole
By Well Type
- Horizontal
- Vertical
By Location
- Onshore
- Offshore
Driver Analysis
Brazil-Guyana FPSO Well Wave
The largest near-term source of sand control demand is deepwater development drilling off Brazil and Guyana, where every new FPSO needs 15 to 20 subsea wells. In 2025, Petrobras started 44 new offshore production wells, split evenly between the Santos and Campos basins, and raised capex 22% to $20.3B. In 2Q26 it brought 10 more wells online and started the P-79 FPSO on May 1, 2026, three months early, taking production to a record 3.34 MMboe/d. Its 2026-2030 plan allocates $69.2B to E&P, 62% to pre-salt and 24% to post-salt fields. The post-salt share matters most here because those unconsolidated sandstones depend heavily on frac packs.
Equinor’s Bacalhau started in October 2025 with 19 Phase 1 wells. In Guyana, Stabroek output reached 900,000 bopd in November 2025, and the 250,000 bpd Uaru FPSO is due in 4Q26. The $6.8B Hammerhead project adds 18 production and injection wells for 2029. At our estimated $2.5M to $5M of screens, packers, fluids and pumping per deepwater frac-packed producer, this pipeline puts roughly 60 to 80 sand-control wells a year into the Atlantic margin market. Contracting is also changing.
Instead of buying screens item by item, operators now award multi-year integrated packages, as in Baker Hughes’ fully integrated completions contract with Petrobras and Halliburton’s October 2025 awards for stimulation vessels and intelligent completions.
Drivers Impact Analysis
| Driver | (~) % Impact on CAGR | Geographic Relevance | Impact Timeline |
|---|---|---|---|
| Brazil-Guyana FPSO Well Wave | +1.3% | South America core, Atlantic margin | Short term (≤ 2 years) |
| Decline-Offset Brownfield Infill | +1.0% | China Bohai, North Sea, SE Asia, West Africa | Medium term (2-4 years) |
| Offshore Gas and LNG Feed Wells | +0.8% | East Med, East and West Africa, Brazil | Long term (≥ 4 years) |
| Gulf Paleogene 20K Developments | +0.7% | North America core (U.S. Gulf) | Medium term (2-4 years) |
| Smart Sand-Face Completions | +0.7% | Global, Middle East and China uptake | Medium term (2-4 years) |
| Thermal Heavy Oil Expansion | +0.6% | Canada, China Bohai, Kuwait | Medium term (2-4 years) |
Restraint Analysis
Gulf War Supply Shock
The U.S.-Israeli strikes on Iran on February 28, 2026 led to the effective closure of the Strait of Hormuz, cutting sand control demand in the region that buys the most completions. By April, output from affected Gulf producers was 14.4 mb/d below pre-war levels, and global supply losses since February had reached 12.8 mb/d. Aramco shut four supergiant offshore fields, Safaniya, Marjan, Zuluf and Abu Safa, idling about 2 to 2.5 mb/d. Several of these produce from clastic reservoirs that use gravel packs and screens.
Arabian Drilling described its offshore suspensions as a precautionary measure taken with the client (BTW Media). Analysts trimmed oilfield services targets over Saudi rig suspensions and the risk to Q4 estimates. Halliburton cited a slower Saudi contract start-up, inflation, higher logistics costs and difficulty moving materials through key shipping routes.
Wood Mackenzie notes that costs for equipment, shipping, insurance and risk premiums have risen across the Gulf, and the loss of Middle East activity outweighs the margin gains. We estimate that 3 to 6 months of deferred Gulf offshore completions remove 40 to 70 sand-control installations from the 2026 order book. War-risk freight and insurance add about 8% to 15% to landed costs for screens and packers, which squeezes margins on fixed-price frame contracts until they are rebid in 2027.
Restraint Impact Analysis
| Restraint | (~) % Impact on CAGR Forecast | Geographic Relevance | Impact Timeline |
|---|---|---|---|
| Gulf War Supply Shock | -1.1% | Middle East core, Asia import corridors | Short term (≤ 2 years) |
| Upstream Oil Capex Discipline | -0.9% | Global, Brazil, North America | Medium term (2-4 years) |
| Steel and Alloy Cost Inflation | -0.7% | North America core, global supply chain | Short term (≤ 2 years) |
| Frontier FID Delays | -0.7% | East and West Africa, Namibia, India | Medium term (2-4 years) |
| Screen Price Commoditization | -0.6% | China, Middle East, Brazil, SE Asia | Medium term (2-4 years) |
| North Sea Fiscal Drag | -0.4% | UK, NW Europe | Long term (≥ 4 years) |
Opportunity Analysis
Post-War Gulf Well Restoration
This opportunity comes from the Iran war shut-ins and is separate from the Middle East drilling growth already in the baseline. The baseline assumes new wells. Restoration is a separate pool of remediation work on wells that were shut in under stress. Saudi output was below 7 mb/d for most of the first six months of the war, against more than 10 mb/d before it. Safaniya, Marjan, Zuluf and Abu Safa were shut, idling 2 to 2.5 mb/d. Wells shut in for long periods suffer sand settling, scale and corrosion, and restarting them may require remediation or intervention. Idle wells also lose pressure balance and take on water.
Both conditions destabilize sandstone and break down existing gravel packs. At least 44 oil and gas facilities need repairs worth tens of billions of dollars, and Halliburton now expects years of service growth as the region rebuilds (TT News). We estimate that if 5% to 8% of the roughly 1,500 to 2,000 affected clastic producers need sand remediation, through-tubing screens, resin consolidation or re-gravel packs at $0.4M to $1.2M each, this creates a $40M to $190M pool over 2026-2028. Suppliers that pre-position restart kits and offer fixed-price programs could earn margins 5 to 8 points above standard frame contracts.
Opportunity Impact Analysis
| Opportunity | (~) % Potential CAGR Upside | Geographic Relevance | Execution Window |
|---|---|---|---|
| Post-War Gulf Well Restoration | +0.8% | Saudi Arabia, Kuwait, Iraq, UAE | Short term (≤ 2 years) |
| Idle-Well Reactivation Contracts | +0.7% | Indonesia, UK, Malaysia, Nigeria | Short term (≤ 2 years) |
| Integrated Sand-Face Roll-Ups | +0.6% | North America, Latin America, global | Medium term (2-4 years) |
| CO2 Injector Sand Management | +0.6% | U.S. Gulf Coast, North Sea | Long term (≥ 4 years) |
| Sedimentary Geothermal Wells | +0.4% | Netherlands, Germany, France | Medium term (2-4 years) |
| Sand-Hosted Gas Hydrates | +0.3% | Japan, India, U.S. Alaska | Long term (≥ 4 years) |
Challenges Analysis
High-Rate Screen Erosion Failures
The main technical weakness in sand control is that high-flux gas wells wear screens out from the inside. Field failure analysis cited in industry training material finds screen erosion is by far the most common screen failure mechanism. Even small amounts of fine sand sharply accelerate wear when flow concentrates at hot spots. In deepwater gas wells, CO2 in the flow makes it worse. Lab tests on a deepwater gas field showed erosion-corrosion wears screens away faster than erosion and corrosion combined. Field cases show what is at stake. A South China Sea floating facility saw expandable screens fail on several wells, which cut choke life, filled separators and eroded control valves.
In East Kalimantan, an operator had to shut in 30 gas wells because of sand. BSEE’s lifecycle cost models for subsea clusters now include sand-control failure rates and unplanned workovers in a separate risk-cost line. We estimate that a 5% to 10% early failure rate on deepwater gas completions, each needing a $15M to $40M rig intervention, makes operators cut design flow rates by 15% to 25%. That lowers revenue per well and slows the switch to cheaper standalone screens. Suppliers will need flux-based design software, ceramic or erosion-resistant filter media, downhole monitoring and warranty-backed qualification data to recover operator confidence.
Challenges Impact Analysis
| Challenge | (~) % CAGR Friction | Geographic Relevance | Mitigation Horizon |
|---|---|---|---|
| High-Rate Screen Erosion Failures | -0.8% | Deepwater gas, SE Asia, East Med | Long term (≥ 4 years) |
| Completion Engineering Talent Gap | -0.7% | North America, Brazil, Guyana | Long term (≥ 4 years) |
| Sand Prediction Data Uncertainty | -0.6% | India KG, Gulf clastics, NW Europe | Medium term (2-4 years) |
| 20K Equipment Qualification Lag | -0.5% | U.S. Gulf core | Medium term (2-4 years) |
| Bromide Brine Supply Concentration | -0.5% | Global, Israel-Jordan dependent | Medium term (2-4 years) |
| Stimulation Vessel Capacity Limits | -0.4% | Brazil, U.S. Gulf, West Africa | Medium term (2-4 years) |
Geopolitical Impact Analysis
Geopolitical Impact Analysis: Impact of the Russia–Ukraine War and Middle East Conflicts on the Sand Control Solutions Market
The ongoing Russia–Ukraine war and conflicts in the Middle East continue to create uncertainty across global oil and gas supply chains. Changes in crude oil prices, trade restrictions, shipping routes, and energy investment decisions can affect demand for sand control solutions. When oil prices remain strong, energy companies may increase drilling and well-completion spending, supporting demand for gravel packs, sand screens, and frac-pack systems. However, price volatility and political uncertainty can also delay projects, increase equipment procurement costs, and disrupt deliveries of specialized metals, chemicals, and completion components.
The scale of the disruption is reflected in government energy data. The U.S. Energy Information Administration reported that Brent crude oil averaged US$114 per barrel in September 2026, following attacks on energy infrastructure and shipping disruptions in the Middle East. Higher oil prices may encourage investment in selected producing regions, but they can also raise drilling and transportation costs and lead operators to postpone projects. Consequently, the sand control solutions market faces both opportunities and risks. Suppliers that maintain reliable component supplies, diversify sourcing, and offer cost-efficient completion technologies may be better positioned to manage geopolitical uncertainty.
Regional Insights
Dominating Region: Asia-Pacific
In 2025, Asia-Pacific held a dominant position in the Sand Control Solutions Market, accounting for a supplied share of 34.21%, valued at USD 1.3 billion. Regional demand is supported by offshore oil and gas production, mature field development, and continued investment in well-completion technologies. Countries such as China, Malaysia, Indonesia, and Australia contribute to regional upstream activity, creating demand for sand screens, gravel-pack systems, and other technologies that protect production equipment. Malaysia’s Department of Statistics reported that crude oil and condensate production reached 183.6 million barrels in 2025, an increase of 1.1% from 2024.
The International Energy Agency estimated that the region would invest approximately USD 130 billion in oil and gas supply in 2025, representing around 15% of global investment. Saudi Arabia’s upstream oil and gas investment was expected to reach approximately USD 40 billion during the same year. These investments can support demand for sand screens, gravel-pack completions, and other technologies used to maintain production and manage formation sand in challenging wells.
Key Regions and Countries Insights
- North America
- US
- Canada
- Europe
- Germany
- France
- The UK
- Spain
- Italy
- Rest of Europe
- Asia Pacific
- China
- Japan
- South Korea
- India
- Australia
- Rest of APAC
- Latin America
- Brazil
- Mexico
- Rest of Latin America
- Middle East & Africa
- GCC
- South Africa
- Rest of MEA
Key Players Analysis
Baker Hughes maintains a presence in sand control through its well-completion and production technologies, including screen systems and gravel-pack solutions. In 2025, the company reported total revenue of USD 27.733 billion, while its Oilfield Services and Equipment segment generated USD 14.324 billion. Its Completions, Intervention, and Measurements product line recorded USD 3.750 billion in revenue, reflecting its broader completion-related business. These figures demonstrate the company’s scale in energy technology, although the company does not separately disclose revenue from sand control solutions.
SLB offers sand control technologies through its well-completion portfolio, supporting gravel packing, screen-based completions, and production management in challenging reservoirs. In 2025, the company reported total revenue of USD 35.708 billion. Its Production Systems division generated USD 13.325 billion, while Reservoir Performance recorded USD 6.820 billion. These businesses support well-completion and production activities relevant to sand management. SLB’s broad international operations position it to serve offshore and onshore operators, although separate sand control revenue was not disclosed.
Weatherford International plc provides well-completion and production technologies that help operators manage formation sand and maintain reliable well performance. In 2025, the company reported total revenue of USD 4.918 billion, including USD 2.980 billion from services and USD 1.938 billion from products. Its product and service portfolio supports oil and gas operators across different well environments, including projects that require specialized completion equipment. These financial figures reflect Weatherford’s overall business rather than sand control sales alone.
Top Key Players Outlook
- Baker Hughes Company
- Schlumberger Limited
- Weatherford International plc
- NOV Inc.
- Halliburton Energy Services Inc.
- Superior Energy Services, Inc.
- Welltec A/S
- Siao Petroleo S.A
- Other Key Players
Recent Developments
- In March 2026, NOV announced a USD 200 million investment to roughly double the capacity of its flexible-pipe manufacturing facility in Açu, Brazil, over 3 years, with expanded production expected to begin in late 2029.
- In April 2026, Halliburton also acquired Sekal AS to expand drilling automation capabilities, although this acquisition was not directly related to sand control. For investment, Halliburton reported that 2025 capital expenditure was approximately 6% of revenue, reflecting its focus on managing spending while supporting technology development.
Report Scope
| Report Features | Description |
|---|---|
| Market Value (2025) | USD 4.0 Bn |
| Forecast Revenue (2035) | USD 7.2 Bn |
| CAGR (2026-2035) | 6.1% |
| Base Year for Estimation | 2025 |
| Historic Period | 2020-2024 |
| Forecast Period | 2026-2035 |
| Report Coverage | Revenue Forecast, Market Dynamics, Competitive Landscape, Recent Developments |
| Segments Covered | By Type (Gravel Pack, Frac Pack, Sand Screens), By Application (Open Hole, Cased Hole), By Well Type (Horizontal, Vertical), By Location (Onshore, Offshore) |
| Regional Analysis | North America – US, Canada; Europe – Germany, France, The UK, Spain, Italy, Rest of Europe; Asia Pacific – China, Japan, South Korea, India, Australia, Singapore, Rest of APAC; Latin America – Brazil, Mexico, Rest of Latin America; Middle East & Africa – GCC, South Africa, Rest of MEA |
| Competitive Landscape | Baker Hughes Company, Schlumberger Limited, Weatherford International plc, NOV Inc., Halliburton Energy Services Inc., Superior Energy Services, Inc., Welltec A/S, Siao Petroleo S.A, Other Key Players |
| Customization Scope | Customization for segments, region/country-level will be provided. Moreover, additional customization can be done based on the requirements. |
| Purchase Options | We have three licenses to opt for: Single User License, Multi-User License (Up to 5 Users), Corporate Use License (Unlimited User and Printable PDF) |








