


Report Overview
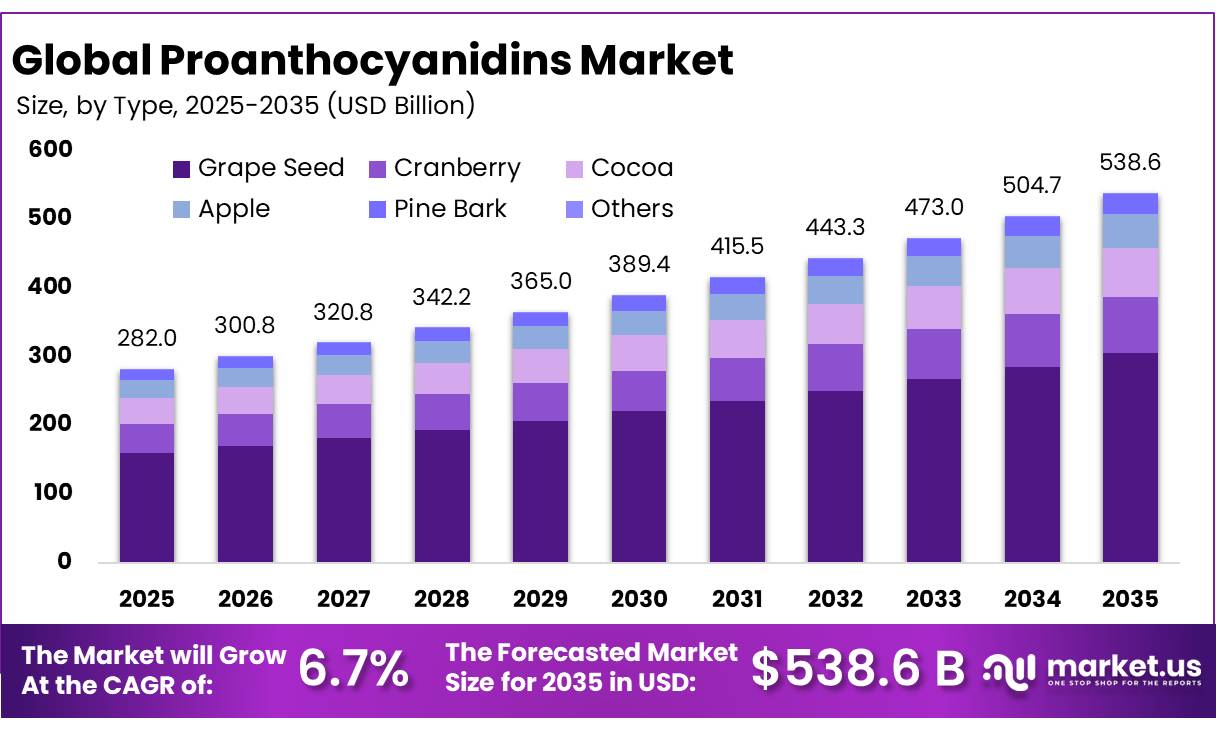
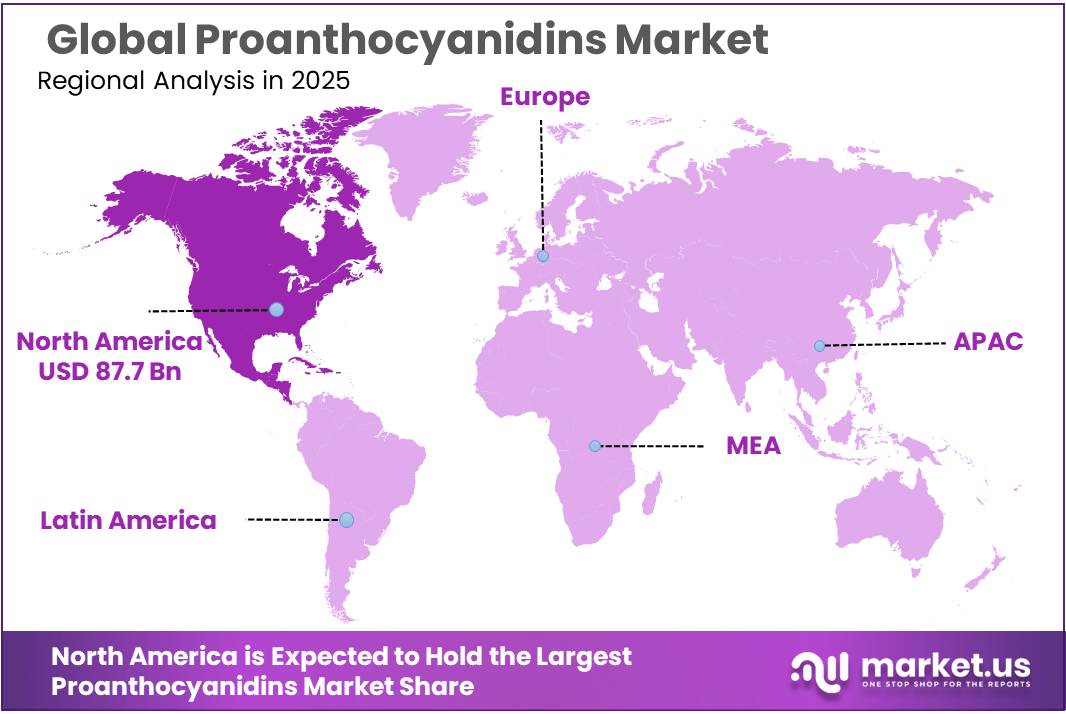
The Global Proanthocyanidins Market size is expected to be worth around USD 538.6 Billion by 2035, from USD 282.0 Billion in 2025, growing at a CAGR of 6.7% during the forecast period from 2026 to 2035. In 2025, North America held a dominant market position, capturing more than a 31.11% share, holding USD 87.2 Billion revenue.
Proanthocyanidins are naturally occurring plant compounds belonging to the polyphenol family. They are found in sources such as grape seeds, cranberries, apples, cocoa, nuts, and other plant materials. These compounds are valued for their antioxidant properties and are used in dietary supplements, functional foods, beverages, and selected personal-care formulations. Commercial production generally involves extracting and purifying the compounds from plant materials, followed by testing their concentration, purity, stability, and suitability for specific applications.
The industry is closely linked to the growing use of plant-derived ingredients in food, nutrition, and wellness products. The United States Department of Agriculture (USDA) developed a database documenting proanthocyanidin levels in 206 selected foods and beverages, including fruits, nuts, and chocolate. This provides a useful scientific reference for ingredient research and product formulation.
Commercial demand is supported by interest in plant-based nutrition, natural antioxidant ingredients, and products designed for health-conscious consumers. Grape seed and cranberry extracts are important commercial sources. The United States Food and Drug Administration (FDA) lists grape seed extract as a food-substance ingredient with a flavouring function in its database.
In addition, the FDA reviewed a cranberry extract notification for use in beverages, beverage bases, coffee, tea, processed fruits, and fruit juices at 150 to 300 milligrams per serving. This demonstrates a practical route for incorporating selected botanical extracts into food and beverage formulations, although authorization and safety requirements depend on the ingredient and its intended use.
Technological development is another important factor. Manufacturers are working to improve extraction efficiency, preserve the natural structure of proanthocyanidins, and produce consistent ingredient quality.
Key Takeaways
- Proanthocyanidins Market size is expected to be worth around USD 538.6 Billion by 2035, from USD 282.0 Billion in 2025, growing at a CAGR of 6.7%.
- Type-B held a dominant market position, capturing more than a 71.56% share.
- Grape Seed held a dominant market position, capturing more than a 53.67% share.
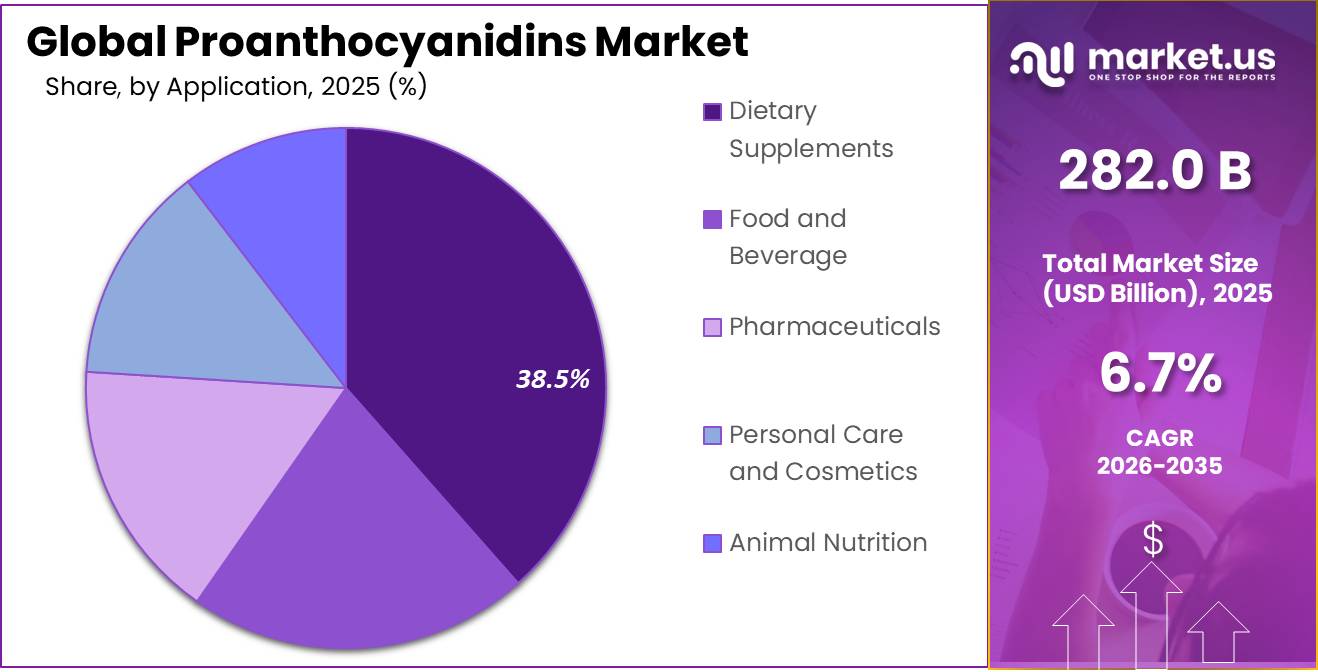
- Dietary Supplements held a dominant market position, capturing more than a 38.56% share.
- North America 31.11% share; USD 87.7 billion.
By Type Analysis
Type-B proanthocyanidins lead due to their broad occurrence in plant-based foods and botanical extracts.
In 2025, “Type-B” held a dominant market position, capturing more than a 71.56% share of the Proanthocyanidins Market. Type-B proanthocyanidins are commonly found in sources such as grape seeds, cocoa, apples, and several nuts. Their availability in a wide range of plant materials supports their use in dietary supplements, functional foods, and botanical ingredients.
Type-A proanthocyanidins are particularly associated with cranberries and are studied for their ability to limit the attachment of certain bacteria to urinary tract cells. This property supports their use in cranberry-based dietary supplements and functional nutrition products. In 2025, a clinical trial published in the American Journal of Clinical Nutrition evaluated a whole-cranberry fruit powder supplement over 6 months in women with a history of recurrent urinary tract infections.
The United States National Center for Complementary and Integrative Health notes that cranberry products may help reduce recurrent infections in some women, but the evidence remains mixed and cranberry products are not treatments for existing infections. These findings support continued scientific interest in Type-A proanthocyanidins, although they do not establish a market share for this segment.
By Source Analysis
Grape seed dominates due to its rich polyphenol content and wide use in botanical extracts.
In 2025, “Grape Seed” held a dominant market position, capturing more than a 53.67% share of the Proanthocyanidins Market. Grape seeds are a valuable source of proanthocyanidins and other polyphenols, making them suitable for dietary supplements, antioxidant formulations, and functional food ingredients. The segment benefits from the availability of grape-processing by-products, which can be used to recover valuable plant compounds. The United States Department of Agriculture (USDA) has also studied grape seed polyphenolics, including their potential biological effects, supporting continued scientific interest in these ingredients.
Cranberry is an important source of Type-A proanthocyanidins, which are studied for their role in preventing certain bacteria from attaching to urinary tract cells. Cranberry extracts are used in supplements and functional nutrition products, although their effectiveness depends on the product and intended use.
According to the United States Department of Agriculture (USDA), the U.S. cranberry crop was forecast to reach 8.13 million barrels in 2025, with Wisconsin accounting for an estimated 5.3 million barrels. This large agricultural supply supports the availability of cranberry raw materials for juice, processed foods, and extract production. However, these production figures measure cranberry supply, not proanthocyanidin output or market share.
By Application Analysis
Dietary supplements lead due to the use of proanthocyanidins in concentrated botanical and plant-based formulations.
In 2025, “Dietary Supplements” held a dominant market position, capturing more than a 38.56% share of the Proanthocyanidins Market. Proanthocyanidins are plant-based polyphenols commonly sourced from grape seeds and cranberries. Supplement manufacturers use these extracts in capsules, tablets, powders, and other formulations designed for health-conscious consumers. Demand is supported by interest in botanical ingredients and antioxidant compounds, while product quality depends on extract concentration, purity, and consistent sourcing.
The U.S. National Center for Complementary and Integrative Health notes that cranberry products have been studied for reducing recurrent urinary tract infections, although their effects vary by product and population. This supports continued scientific interest in cranberry-based supplements but does not establish the segment’s market share.
Food and Beverage applications use proanthocyanidins from ingredients such as cranberry and grape seed extracts to add plant-derived polyphenols to selected formulations. In 2020, the U.S. Food and Drug Administration closed cranberry extract notice GRN No. 873 with no questions regarding the notifier’s conclusion that the ingredient was generally recognized as safe under the proposed conditions of use. The notice covered cranberry extract powder at 150 mg per 8-ounce serving for beverages, coffee, and tea, and 300 mg per 8-ounce serving for processed fruits and fruit juices. These figures show defined ingredient-use levels for cranberry extract, not a universal recommended dose or a market-size estimate.
Key Market Segments
By Type
- Type-A
- Type-B
By Source
- Grape Seed
- Cranberry
- Cocoa
- Apple
- Pine Bark
- Others
By Application
- Dietary Supplements
- Food and Beverage
- Pharmaceuticals
- Personal Care and Cosmetics
- Animal Nutrition
Driver Analysis
Grape Pomace Valorization
Grape-pomace valorization is the market’s strongest near-term volume and margin driver because wineries generate a low-cost feedstock stream containing skins, seeds and stems that can be converted into high-value oligomeric proanthocyanidin extracts instead of being composted, distilled or used as low-value feed. Global wine production recovered to an estimated 232 million hectolitres in 2025, up 3% from the historic 2024 low but still 7% below the five-year average, while roughly 20–30% of grape mass processed becomes pomace and around 60–70% of grape polyphenols can remain in that residue after vinification.
Using the industry conversion of about 1 kg of pomace per 6 L of wine, the 2025 wine stream implies approximately 3.9 million tonnes of pomace, of which even 5% routed through extraction at a modeled 2–4% standardized PAC yield could generate 3,900–7,800 tonnes of extractable polyphenol concentrate.
The business model shifts from buying premium virgin grape seed to long-term winery offtake, regional drying hubs, solvent-recovery systems and traceable batch standardization, potentially reducing feedstock cost by an analyst-estimated 20–35% and improving extract gross margin by 5–12 percentage points; European and New World wineries are investing in pilot lines using ultrasound, microwave and low-solvent extraction to improve recovery while lowering energy consumption.
This driver adds an estimated +2.0 percentage points to CAGR because it simultaneously expands raw-material availability, reduces waste-disposal cost and creates ESG-compliant product narratives for food, supplements, cosmetics and feed applications.
Drivers Impact Analysis
| Driver | (~) % Impact on CAGR Forecast | Geographic Relevance | Impact Timeline |
|---|---|---|---|
| Grape Pomace Valorization | +2.0 pp | Europe, China, U.S., Chile, Australia | Short term (≤ 2 years) |
| Nutricosmetic Formulations | +1.6 pp | Europe, North America, Japan, South Korea | Medium term (2–4 years) |
| Clean-Label Preservation | +1.3 pp | EU, North America, APAC food hubs | Medium term (2–4 years) |
| Clinical Nutraceutical Positioning | +1.1 pp | U.S., EU, Japan, China | Medium term (2–4 years) |
| Methane-Reducing Feed Additives | +0.9 pp | EU, North America, Australia, China | Long term (≥ 4 years) |
| Standardized Botanical Supply | +0.7 pp | EU, U.S., India, China | Short term (≤ 2 years) |
Restraint Analysis
Climate-Driven Grape Shortfalls
Proanthocyanidin supply is structurally exposed to vineyard output because grape seeds and pomace remain the principal industrial feedstocks, and climate-driven volatility directly constrains extractable biomass, raises procurement prices and makes long-term standardized-extract contracts harder to honor. OIV initially estimated 2025 global wine output at 232 million hectolitres, 3% above the 2024 historic low but 7% below the five-year average, while its later 2025 estimate was 227 million hectolitres, only 0.6% above 2024 and marking the third consecutive low-output year; drought, heat, hail, frost and heavy rainfall affected both hemispheres.
France recorded its lowest harvest since 1957, Spain one of its smallest harvests in decades, Chile remained affected by water shortages and heatwaves for a fourth year, and Portugal’s 2025 output reportedly fell 11%, demonstrating that regional sourcing diversification does not eliminate correlated weather risk. Under an analyst scenario in which winery throughput falls 10%, pomace availability drops about 0.4–0.6 million tonnes globally, and processors compete for the remaining seed-rich residue; a 15–30% raw-material price escalation can raise the cost of a standardized 75% PAC extract by 8–18%, compressing gross margin by 300–700 basis points where customer contracts cannot be repriced.
Producers must therefore secure multi-vintage winery offtake contracts, diversify across Europe, China, Chile, South Africa and Australia, invest in drying/storage to carry 12–18 months of inventory, and develop pine-bark, cranberry, cocoa and berry-based alternatives, but biological yield exposure makes this a -1.8-point long-term CAGR restraint.
Restraint Impact Analysis
| Restraint | (~) % Impact on CAGR Forecast | Geographic Relevance | Impact Timeline |
|---|---|---|---|
| Climate-Driven Grape Shortfalls | -1.8 pp | Europe, Chile, Australia, South Africa | Long term (≥ 4 years) |
| Restricted Health Claims | -1.5 pp | EU, UK, North America, Japan | Medium term (2–4 years) |
| Batch Potency Variability | -1.2 pp | Global; China, India, EU supply | Medium term (2–4 years) |
| Contaminant Testing Burden | -1.0 pp | EU, U.S., Japan, South Korea | Short term (≤ 2 years) |
| Extraction Cost Inflation | -0.9 pp | Europe, North America, China | Medium term (2–4 years) |
| Low-Cost Polyphenol Substitutes | -0.7 pp | Global mass-market channels | Long term (≥ 4 years) |
Opportunity Analysis
Precision Gut-Health Ingredients
Precision gut-health is an underexploited monetization opportunity rather than a current market driver because most PAC products remain sold as generic antioxidants, despite evidence that oligomeric PACs are metabolized by intestinal microbiota into potentially active phenolic metabolites and may support personalized microbiome-oriented formulations. A 2026 prospective pilot study in 25 ulcerative-colitis patients in remission administered 300 mg/day of greater-than-95% proanthocyanidins for 8 weeks and recorded an average 11.2-point rise in IBDQ quality-of-life score, with 11 high responders achieving a 24.2-point improvement; responders also showed increased Lachnospiraceae and Sutterellaceae, although no control group was included and zonulin did not change.
This creates a white space for suppliers to develop 150–300 mg standardized oligomeric PAC products paired with baseline stool testing, responder segmentation, prebiotic combinations and 8–12-week digital coaching subscriptions, where an analyst-modeled $15–30 monthly ingredient-and-data service can generate 3–5 times the revenue per customer of a $5–10 commodity antioxidant capsule.
A 5,000-person pilot cohort at $20 per month represents $1.2 million annual recurring revenue before white-label licensing, while a 10% responder-enrichment improvement can lower customer-acquisition cost by an estimated 15–25% through targeted marketing. This is not a baseline driver because controlled, multi-site trials, validated biomarkers, privacy-compliant data architecture and compliant non-disease claims are still required, but it could add +1.8 percentage points to CAGR in the EU, U.S., Japan and South Korea.
Opportunity Impact Analysis
| Opportunity | (~) % Potential CAGR Upside | Geographic Relevance | Execution Window |
|---|---|---|---|
| Precision Gut-Health Ingredients | +1.8 pp | EU, U.S., Japan, South Korea | Medium term (2–4 years) |
| Low-Methane Feed Additives | +1.5 pp | EU, U.S., Australia, China, Brazil | Medium term (2–4 years) |
| Active Packaging Systems | +1.2 pp | EU, North America, Japan, China | Medium term (2–4 years) |
| Clinical Ingredient Licensing | +1.0 pp | U.S., EU, Japan, China | Short term (≤ 2 years) |
| Circular Winery Biorefineries | +0.9 pp | Europe, Chile, U.S., Australia, China | Medium term (2–4 years) |
| Dermocosmetic Delivery Systems | +0.7 pp | South Korea, Japan, EU, North America | Short term (≤ 2 years) |
Challenges Analysis
Feedstock Chemistry Variance
Proanthocyanidin output is operationally vulnerable because grape cultivar, terroir, harvest maturity, seed-to-skin ratio, wine-making regime, weather, drying time and storage conditions alter both total PAC yield and the commercially important oligomer-to-polymer distribution, so equal tonnes of pomace cannot be assumed to deliver equivalent standardized extract. Research confirms that polyphenol concentration in grape pomace changes with grape variety and vinification conditions, while PAC extraction performance is sensitive to ethanol concentration, temperature, solid-to-solvent ratio and processing time; laboratory optimums range from 47% aqueous ethanol at 60°C and 53 minutes of sonication for seed extracts to roughly 62% ethanol, 16 hours and a 50:1 liquid-to-solid ratio for pomace PAC recovery.
In an analyst plant model processing 10,000 tonnes of wet pomace annually, a shift from 3.5% to 2.5% recoverable PAC content cuts potential output by 100 tonnes; at $30–60/kg standardized extract, that is $3–6 million of annual revenue-at-risk before fixed-cost absorption. A 10-percentage-point fall in raw extract assay also requires 11–20% more feedstock, solvent, filtration capacity and drying energy per kilogram of saleable product, producing 300–600 basis points of gross-margin dilution if prices are fixed. Suppliers must implement cultivar-linked procurement, vineyard and winery intake specifications, near-infrared pre-screening, multi-origin blending, 12–18-month inventory balancing and dynamic extraction recipes; without these controls, feedstock variability imposes a modeled -1.3-point medium-term drag across Europe, China, Chile and U.S. supply chains.
Challenges Impact Analysis
| Challenge | (~) % CAGR Friction Drag | Geographic Relevance | Mitigation Horizon |
|---|---|---|---|
| Feedstock Chemistry Variance | -1.3 pp | Europe, China, Chile, U.S. | Medium term (2–4 years) |
| Green Extraction Scale-Up | -1.1 pp | Europe, China, India, U.S. | Medium term (2–4 years) |
| Assay Method Misalignment | -1.0 pp | Global; EU, U.S., APAC | Medium term (2–4 years) |
| Bioavailability Evidence Gap | -0.9 pp | EU, U.S., Japan, South Korea | Long term (≥ 4 years) |
| Multi-Market Quality Complexity | -0.8 pp | EU, North America, China, India | Medium term (2–4 years) |
| Seasonal Pomace Logistics | -0.6 pp | Europe, Chile, Australia, U.S. | Short term (≤ 2 years) |
Geopolitical Impact Analysis
Impact of the Iran War on the Proanthocyanidins Market
The ongoing Iran war is putting indirect pressure on the proanthocyanidins market by increasing transportation costs, energy prices and uncertainty across global supply chains. Proanthocyanidins are obtained from botanical sources such as grape seeds and cranberries, so their supply depends on agricultural production, processing and reliable international trade.
Higher fuel costs can increase the expense of transporting raw materials, botanical extracts and finished dietary supplements, food and beverage products. If the conflict continues to disrupt shipping routes, manufacturers may face longer delivery times and higher procurement costs, particularly when sourcing ingredients from overseas suppliers.
Government data highlights the scale of the disruption. In March 2026, the United Nations Conference on Trade and Development reported that around one-third of global seaborne fertilizer trade, equivalent to approximately 16 million tonnes, passed through the Strait of Hormuz. The agency also reported rising freight rates, marine fuel costs and war-risk insurance premiums.
These pressures could raise farming and processing costs over time, although the actual effect on proanthocyanidins will depend on crop availability, supplier locations and shipping exposure. Companies may respond by diversifying suppliers, building raw-material inventories and securing longer-term sourcing agreements.
Regional Insights
Dominating Region: North America (31.11% share; USD 87.7 billion, as provided)
North America dominates the proanthocyanidins market due to its established dietary supplement industry, availability of botanical raw materials, and demand for plant-based ingredients in food, beverages, and wellness products. The United States supports the supply chain through grape and cranberry production, which provides important sources of proanthocyanidins for extract manufacturers.
According to the United States Department of Agriculture (USDA), the US grape crop was forecast at 5.59 million tons in 2025, up 3% from 2024. California accounted for approximately 4.98 million tons of that forecast. The USDA also forecast US cranberry production at 8.13 million barrels in 2025, with Wisconsin contributing 5.3 million barrels. These agricultural resources support the availability of botanical ingredients for processing and extraction. However, the supplied market share and value represent the market estimates provided for this analysis, not USDA statistics.
Asia-Pacific presents growth opportunities as manufacturers expand their use of botanical extracts in dietary supplements, functional foods, beverages, and personal care formulations. Growing interest in plant-derived ingredients and wider access to nutraceutical products may encourage demand from consumers and product developers.
The region also has established agricultural and food-processing industries that can support the development of botanical ingredient supply chains. USDA Foreign Agricultural Service data estimated global table grape production at 28.87 million metric tons in 2024/2025, an annual increase of 3%, highlighting the scale of an important agricultural input used in grape-derived extracts. However, this global figure does not establish Asia-Pacific as the fastest-growing proanthocyanidins market. Confirming that ranking would require comparable regional market-growth data.
Key Regions and Countries Insights
- North America
- US
- Canada
- Europe
- Germany
- France
- The UK
- Spain
- Italy
- Rest of Europe
- Asia Pacific
- China
- Japan
- South Korea
- India
- Australia
- Rest of APAC
- Latin America
- Brazil
- Mexico
- Rest of Latin America
- Middle East & Africa
- GCC
- South Africa
- Rest of MEA
Key Players Analysis
Artemis International supplies botanical ingredients for health and nutrition applications, including cranberry extracts containing proanthocyanidins. Its product portfolio includes cranberry ingredients with different proanthocyanidin concentrations, including 0.5%, 1%, 5% and 15% grades. Its WHOLECran ingredient is described as containing at least 4% proanthocyanidins. These specifications allow supplement and food manufacturers to select ingredients according to formulation needs. The company serves the botanical ingredient sector, where extract consistency and standardization are important purchasing factors.
Botaniex Inc. develops botanical extracts and natural ingredients for dietary supplements, functional foods, beverages and other applications. Its Grapeseed-EX™ range includes grape seed extracts standardized to 80% and 95% oligomeric proanthocyanidins (OPCs). The company reports having an research and development team of more than 16 scientists, supporting ingredient development and customization. Its capabilities include botanical extraction, contract manufacturing and private-label services. These offerings position Botaniex as a supplier for manufacturers seeking standardized grape seed ingredients for proanthocyanidin-based formulations.
Givaudan SA participates in the proanthocyanidins sector through its Pacran cranberry ingredient, developed for nutritional and dietary supplement applications. The ingredient is associated with cranberry proanthocyanidins and supports product development using standardized botanical extracts. In 2025, Givaudan reported total group sales of CHF 7.472 billion, with like-for-like growth of 5.1%. Its Taste & Wellbeing business generated CHF 3.642 billion in sales. These figures reflect the wider company, not proanthocyanidin-specific revenue, but demonstrate its scale in ingredient solutions.
Top Key Players Outlook
- Artemis International
- Botaniex Inc.
- Givaudan SA
- Indena S.p.A.
- Nexira
- Eevia Health Oy
- Polyphenolics
- Xi’an Yuensun Bio-Tech
- Fruit d’Or
- Martin Bauer Group
- Other Key Players
Recent Developments
- In May 2025, Eevia launched FENO-ARONIA™ 50 Organic, a high-strength Aronia extract containing polyphenols, including proanthocyanidins and anthocyanins, and reported receiving 2 initial orders. The same month, it signed a 5-year exclusive global supply agreement for FENO-CHAGA™ Organic with a European partner. For research and development, Eevia sought EUR 570,000 in funding for a planned MaxBIOME™ clinical study. Its proposed Pro-URO™ urinary-health formulation was targeted for early 2026,
- In July 2026, Nexira announced its acquisition of Keragum, a Moroccan carob ingredient specialist, to strengthen raw-material sourcing and expand its natural ingredient portfolio; financial terms were not disclosed.
Report Scope
| Report Features | Description |
|---|---|
| Market Value (2025) | USD 282.0 Bn |
| Forecast Revenue (2035) | USD 538.6 Bn |
| CAGR (2026-2035) | 6.7% |
| Base Year for Estimation | 2025 |
| Historic Period | 2020-2024 |
| Forecast Period | 2026-2035 |
| Report Coverage | Revenue Forecast, Market Dynamics, Competitive Landscape, Recent Developments |
| Segments Covered | By Type (Type-A, Type-B), By Source (Grape Seed, Cranberry, Cocoa, Apple, Pine Bark, Others), By Application (Dietary Supplements, Food and Beverage, Pharmaceuticals, Personal Care and Cosmetics, Animal Nutrition) |
| Regional Analysis | North America – US, Canada; Europe – Germany, France, The UK, Spain, Italy, Rest of Europe; Asia Pacific – China, Japan, South Korea, India, Australia, Singapore, Rest of APAC; Latin America – Brazil, Mexico, Rest of Latin America; Middle East & Africa – GCC, South Africa, Rest of MEA |
| Competitive Landscape | Artemis International, Botaniex Inc, Givaudan SA, Indena S.p.A., Nexira, Eevia Health Oy, Polyphenolics, Xi’an Yuensun Bio-Tech, Fruit d’Or, Martin Bauer Group, Other Key Players |
| Customization Scope | Customization for segments, region/country-level will be provided. Moreover, additional customization can be done based on the requirements. |
| Purchase Options | We have three licenses to opt for: Single User License, Multi-User License (Up to 5 Users), Corporate Use License (Unlimited User and Printable PDF) |








