


Report Overview
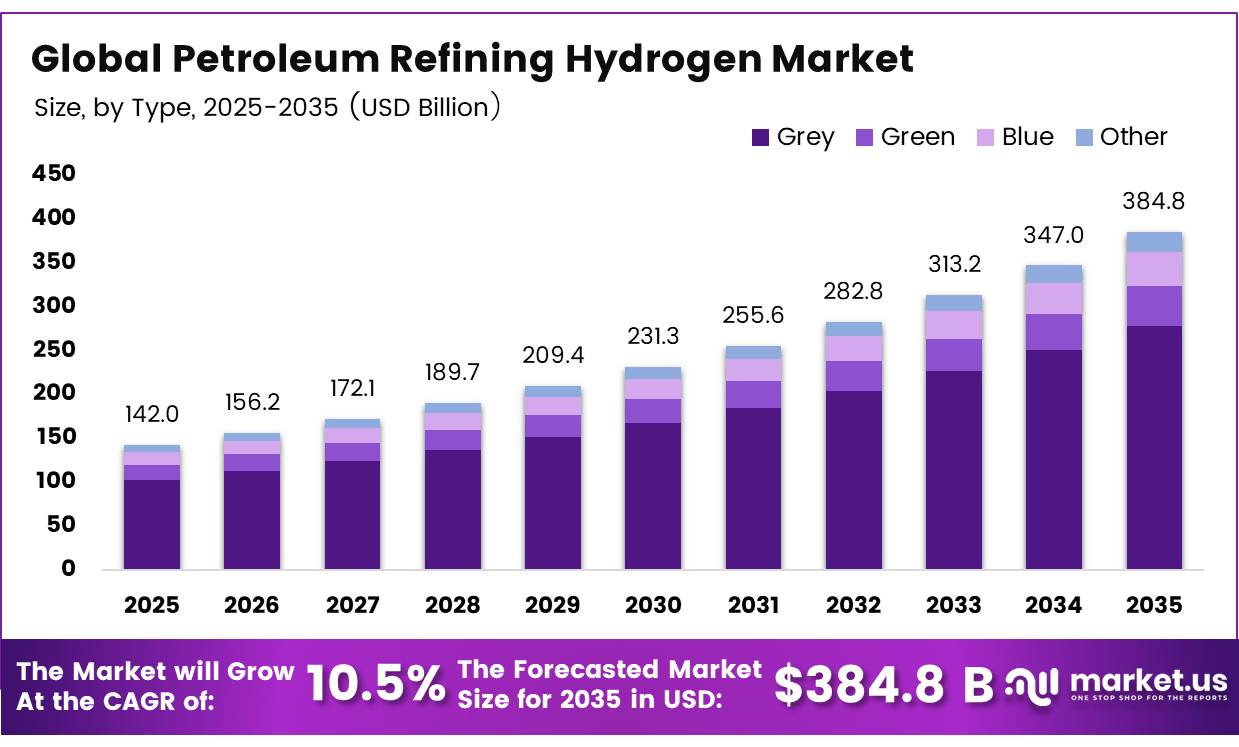
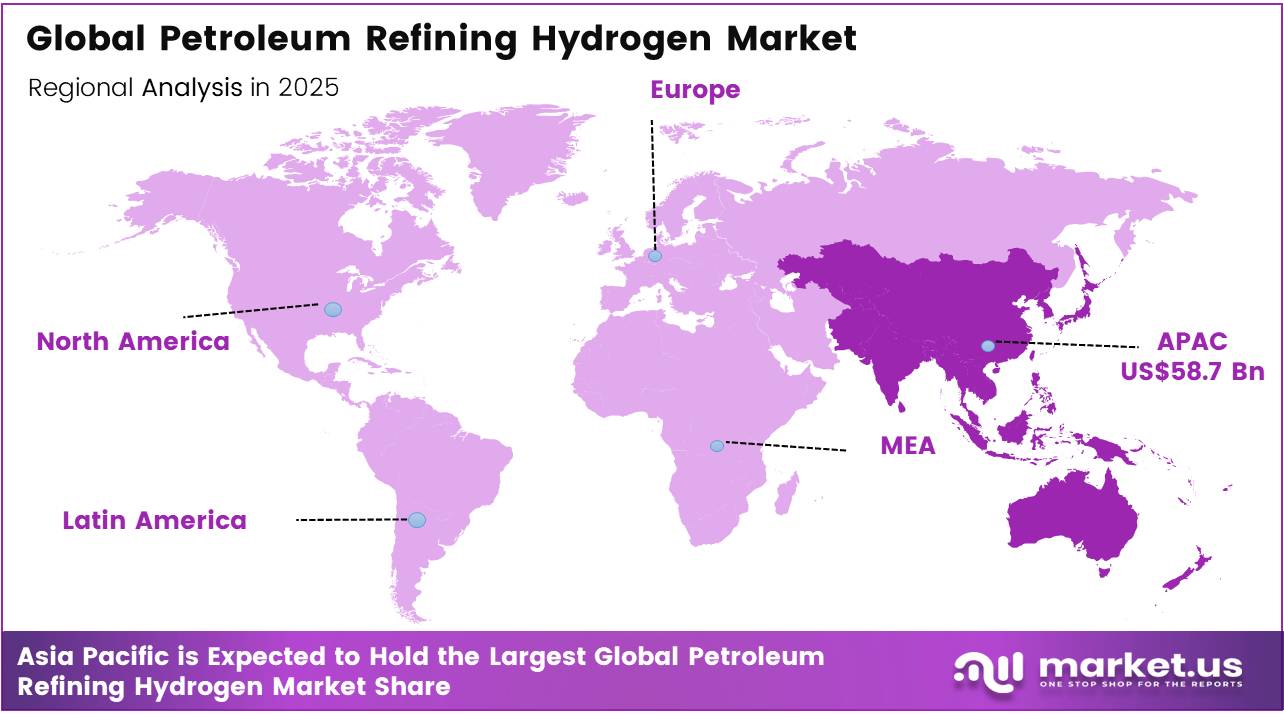
In 2025, the Global Petroleum Refining Hydrogen Market was valued at USD 140.0 billion, and between 2026 and 2035, this market is estimated to register a CAGR of 10.5%, reaching about USD 384.8 billion by 2035. In 2025, Asia Pacific held a dominant market position, capturing more than a 41.4% share, holding USD 58.7 Billion revenue.
Petroleum refining hydrogen remains an essential process input for hydrocracking, hydrotreating and sulphur removal, helping refineries produce cleaner fuels from increasingly complex crude streams.
- In 2025, global hydrogen demand grew almost 3% and exceeded 100 million tonnes, as refining and industry accounted for almost all consumption. Low-emissions hydrogen demand increased 20% to almost 1 million tonnes, showing that refinery decarbonisation is expanding but remains at an early stage.
The United States illustrates the sector’s scale. On January 1, 2026, refinery distillation capacity stood at 18.2 million barrels per calendar day, down more than 250,000 barrels per day, or about 1%, from 2025. Refinery hydrogen production capacity decreased from 3,022 million cubic feet per day in 2025 to 2,767 million cubic feet per day in 2026. Refineries also consumed 156,248 million cubic feet of natural gas as hydrogen-production feedstock during 2025.
Future opportunities will centre on renewable electrolysis, carbon capture and refinery-linked offtake. New low-emissions hydrogen agreements reached 1.7 million tonnes annually in 2025, but only one-fifth were firm. Committed projects could supply 2.5 million tonnes to refineries and industrial plants by 2030. EU rules require renewable hydrogen to represent at least 42% of industrial hydrogen use by 2030 and 60% by 2035.
Key Takeaways
- The global Petroleum Refining Hydrogen market was valued at USD 142.0 billion in 2025.
- The global market is projected to grow at a CAGR of 10.50% and is estimated to reach USD 384.8 billion by 2035.
- On the basis of type, the Grey Petroleum Refining Hydrogen dominated the market, constituting 72.2% of the total market share.
- Based on the Supply & Distribution System, the Captive dominated the Petroleum Refining Hydrogen market, with a substantial market share of around 57.6%.
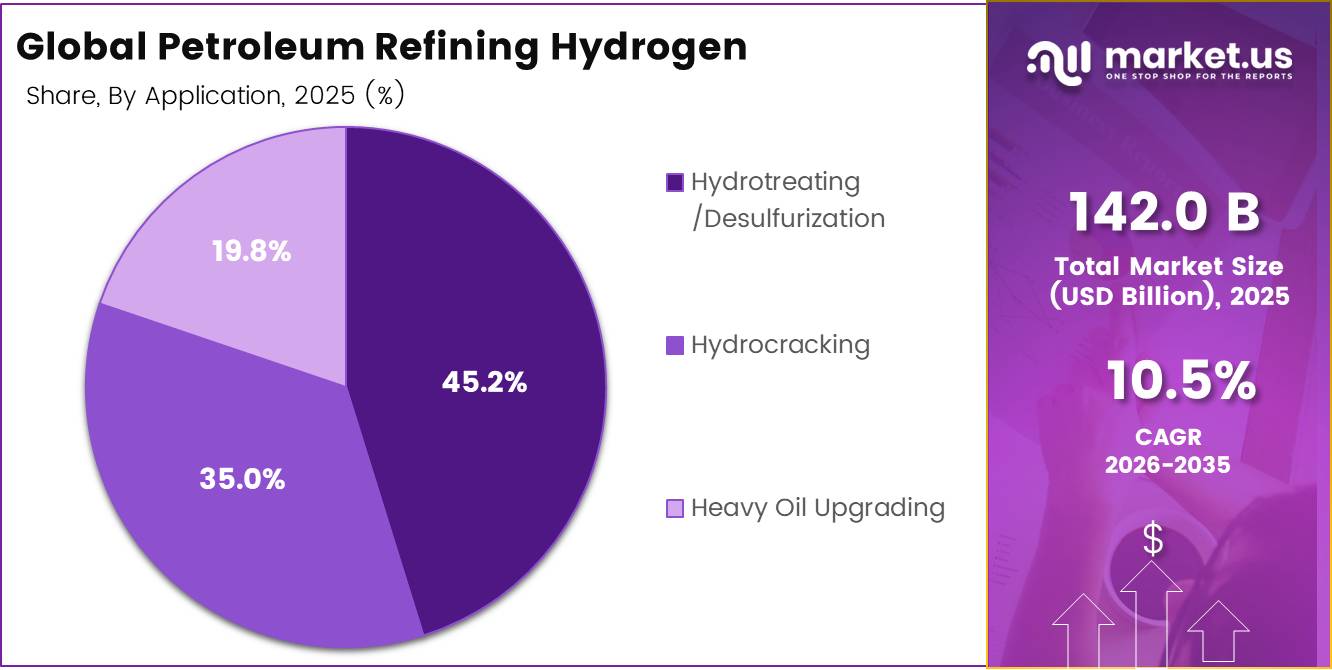
- Based on the Application, Hydrotreating /Desulfurization led the market, comprising 45.2% of the total market.
- Among the Production Technology, the Steam Methane Reforming (SMR) held a major share in the Petroleum Refining Hydrogen market, 68.3% of the market share.
- In 2025, the Asia Pacific was the most dominant region in the Petroleum Refining Hydrogen market, accounting for 41.4% of the total global consumption.
Type Analysis
Grey represents dominant Segment in the Market.
Grey hydrogen held the leading market position, capturing 72.2% of petroleum refining hydrogen demand. Its strength comes from established steam methane reforming units and the continuous hydrogen requirements of conventional refineries.
- As of January 1, 2026, the U.S. Energy Information Administration recorded 17,002,116 barrels per calendar day of catalytic hydrotreating and desulphurisation capacity. Catalytic hydrocracking capacity reached 2,342,770 barrels per calendar day, illustrating the large operating base of hydrogen-intensive refinery processes.
Green hydrogen is the growing segment as refiners seek lower-emission alternatives for fuel treatment and conversion. The European Commission launched its 2025 Hydrogen Auction with a €1.3 billion budget. Funding included €600 million for renewable hydrogen production, €400 million for renewable or electrolytic low-carbon hydrogen, and €300 million for supplies serving aviation and maritime users. The auction received 58 bids, showing rising project activity around electrolyser-based hydrogen production.
Supply & Distribution System Analysis
Captive a significant Supply & Distribution System.
Captive supply held the leading position, capturing 57.6% of the petroleum refining hydrogen market. Refineries favour onsite production because hydrogen must be supplied continuously to hydrotreating, hydrocracking and sulphur-removal units.
- U.S. Energy Information Administration data show that refinery-operated hydrogen capacity in the West Coast refining district reached 1,063 million cubic feet per day in 2026, while East Coast facilities maintained 109 million cubic feet per day. These figures cover hydrogen plants located on refinery grounds and operated directly by refinery companies, highlighting the scale of captive infrastructure.
Merchant supply is the growing segment as refiners seek flexible volumes without constructing additional onsite plants. The U.S. Department of Energy reports that approximately 1,600 miles of hydrogen pipelines operate across the country and are owned by merchant hydrogen producers. Liquid hydrogen can also support locations without pipeline access, although it must be cooled below −253°C, and liquefaction consumes more than 30% of its energy content.
Application Analysis
Hydrotreating/Desulfurization Are the Most Widely Used Aplication.
Hydrotreating/Desulfurization held the leading position, capturing 45.2% of the petroleum refining hydrogen market. Refineries rely on this process to lower sulphur levels in diesel, gasoline and aviation fuels while protecting downstream equipment.
- As of January 1, 2026, U.S. distillate hydrotreating capacity stood at 6,268,465 barrels per stream day. Within this total, diesel-fuel treatment represented 4,430,224 barrels per stream day, while kerosene and jet-fuel treatment reached 1,635,341 barrels per stream day, demonstrating the process’s broad operating scale.
Hydrocracking is the growing segment as refiners seek higher yields of cleaner middle distillates from heavier feedstocks. U.S. distillate hydrocracking capacity increased from 750,000 barrels per stream day in 2025 to 787,170 barrels per stream day in 2026. Residual-feed hydrocracking capacity also rose from 84,500 to 87,000 barrels per stream day, supporting additional hydrogen demand.
Production Technology Analysis
Steam Methane Reforming (SMR) Held a Major Share of the Petroleum Refining Hydrogen Market.
Steam methane reforming held the leading position, capturing 68.3% of the petroleum refining hydrogen market. Its established equipment base, continuous production capability and access to natural-gas infrastructure make it suitable for large refinery operations.
- The U.S. Department of Energy states that the country produces around 10 million metric tons of hydrogen annually, with approximately 95% made through natural-gas reforming. SMR typically operates at 700°C to 1,000°C and pressures of 3 to 25 bar, supporting high-volume hydrogen output for fuel upgrading and impurity removal.
Water electrolysis is the growing segment as refineries explore hydrogen made using renewable electricity. In March 2025, the European Commission reported that its renewable hydrogen auction attracted 61 bids from 11 countries. The proposed projects represented around 6.3 GW of electrolyser capacity and could produce more than 7.3 million tonnes of renewable hydrogen over ten years, indicating a stronger future supply pipeline for electrolysis-based production.
Key Market Segments
By Type
- Grey
- Green
- Blue
- Other
By Supply & Distribution System
- Captive
- Merchant
By Application
- Hydrotreating /Desulfurization
- Hydrocracking
- Heavy Oil Upgrading
By Production Technology
- Steam Methane Reforming (SMR)
- Water Electrolysis
- Partial Oxidation (POX)
- Coal / Biomass Gasification
Driver Analysis
Ultra‑low sulfur & cleaner fuel regulations in transport fuels
From 2020 onward, fuel quality mandates such as the IMO 0.5% sulfur cap and Euro VI / Tier 3 standards have structurally raised hydrogen intensity in hydrotreating units, with many refineries now processing heavier, higher‑sulfur crudes that require larger hydrogen consumption per barrel for deep desulfurization.
In 2026, refinery hydrogen demand remains tightly coupled to regulations limiting sulfur in gasoline, diesel and marine fuels; hydrogen is used to crack long‑chain hydrocarbons and remove sulfur compounds, and stricter caps drive higher severity operations and throughput in hydrodesulfurization units. As more markets converge toward ultra‑low sulfur (≤10–15 ppm) road fuels and tighten aromatics/olefin controls, refiners must increase hydrogen use per unit of product, effectively raising hydrogen demand faster than refined product volumes.
This leads to incremental capex for larger SMR units, hydrogen recovery and purification systems, and in some cases procurement of merchant hydrogen, shifting unit economics toward higher variable hydrogen cost components (often 45–75% of hydrogen production cost is fuel for conventional SMR).
Over 2026–2030, emerging markets in APAC and Latin America continue to adopt cleaner fuel standards, turning regulatory timelines into a staggered but cumulative driver that can realistically add low‑single‑digit percentage points to hydrogen demand growth above base product demand growth, thereby supporting a ~+2.3% uplift in market CAGR through tighter fuel specs, longer‑term marine fuel decarbonization discussions, and potential future mandates on sulfur, aromatics and renewable blending.
Drivers Impact Analysis
| Driver | (~) % Impact on CAGR Forecast | Geographic Relevance | Impact Timeline |
|---|---|---|---|
| Ultra-low sulfur & cleaner fuel regulations in transport fuels | +2.3% | North America core, EU, APAC corridors, Middle East export hubs | Medium term (2–4 years) |
| Refinery modernization, heavy/sour crude and hydrocracking intensity | +1.9% | APAC (China, India, Japan), Middle East, Latin America, Rest-of-Asia Pacific | Medium term (2–4 years) |
| Integration of blue/green hydrogen into refining value chains | +1.7% | EU, North America, India, GCC, select APAC | Long term (≥ 4 years) |
| Expansion of SAF, renewable diesel and biofuel co-processing | +1.4% | North America, EU, APAC aviation hubs, Middle East export refiners | Medium–Long term (2–≥4 years) |
| National hydrogen missions and consumption obligations on refiners | +1.6% | India, EU, selected Middle East and APAC markets | Medium–Long term (2–≥4 years) |
| Cost and infrastructure advances in hydrogen generation (SMR, CCS, electrolysis) | +1.2% | Global (refining clusters in NA, EU, APAC, MENA) | Long term (≥ 4 years) |
Restraint Analysis
Hydrogen cost ceiling in refining economics
A core restraint is the tight cost‑acceptability window for hydrogen in refining, where most process applications can only absorb hydrogen costs below roughly 2 USD/kg before margins erode, as highlighted by global hydrogen reviews that identify refining and ammonia as sectors with some of the lowest acceptable hydrogen price bands.
In practice, refiners operate under product netbacks often in the range of 8–15 USD/bbl for middle distillates, with hydrogen representing a non‑trivial share of variable cost; when hydrogen cost rises from about 1.3–1.6 USD/kg for efficient gray SMR to 2.3–2.8 USD/kg for blended or low‑carbon hydrogen, per‑barrel processing cost for high‑severity hydrodesulfurization can increase by 0.5–1.0 USD/bbl, materially compressing margins in highly competitive fuel markets.
Strategically, this shows up in delayed hydrogen network upgrades, slower adoption of higher hydrogen‑intensity product slates, and rigid procurement strategies focused on legacy SMR units rather than diversified sourcing, collectively knocking an estimated 2.4 percentage points off the otherwise policy‑pulled CAGR as refiners choose capital preservation over aggressive hydrogen expansion when hydrogen prices flirt with or exceed sectoral acceptability thresholds.
Restraint Impact Analysis
| Restraint | (~) % Impact on CAGR | Geographic Relevance | Impact Timeline |
|---|---|---|---|
| Hydrogen cost ceiling in refining economics | -2.4% | Global refining clusters (NA, EU, APAC, MENA) | Medium term (2–4 years) |
| High green/blue hydrogen LCOH vs gray SMR | -2.1% | EU, India, APAC, selected NA hubs | Medium–Long term (2–≥4 years) |
| Slow CCS, pipeline and electrolyser build-out | -1.8% | NA, EU, APAC corridors, GCC | Long term (≥ 4 years) |
| Policy and certification uncertainty for clean hydrogen | -1.6% | EU core, India, APAC corridors | Medium term (2–4 years) |
| Technical limits on hydrogen fuel use in refinery assets | -1.3% | Global, stronger in emerging markets | Long term (≥ 4 years) |
| Capital scarcity and competing decarbonization priorities | -1.5% | Emerging APAC, Latin America, MENA | Medium–Long term (2–≥4 years) |
Opportunity Analysis
Surplus blue/green hydrogen export from refineries
This is an untapped opportunity because most refineries today size low‑carbon hydrogen units purely for on‑site process demand, whereas transitioning to intentional surplus production could turn refineries into regional hydrogen exporters and lift hydrogen revenue per site by 15–30% above current desulfurization‑only models.
Blue hydrogen processes based on residue or natural gas gasification already enable monetization of low‑value streams such as vacuum residue, asphaltenes and heavy oils, but current projects typically aim at internal fuel or process substitution; scaling these to produce an extra 50–150 kt/year of low‑carbon hydrogen per large refinery and selling it into mobility, industrial gas or power markets at 2.0–2.5 USD/kg could add 100–375 million USD in annual topline per site, assuming blended netbacks of 1,000–2,500 USD/t.
With global low‑emissions hydrogen demand in refineries and industrial facilities expected to exceed 2 million t/year by 2030, yet only a fraction contracted today, refineries in NA, EU, GCC and APAC hubs can position themselves as anchor suppliers, capturing market share that would otherwise go to standalone hydrogen producers.
Execution requires re‑rating hydrogen from a utility cost center to a profit center, adding compression/liquefaction assets, export terminals or pipeline interconnections, and structuring long‑term offtake with external buyers; if 10–15% of large refineries globally adopt surplus export models, total refinery‑linked hydrogen volumes could rise by an extra 10–20%, translating into roughly +2.4 percentage points of CAGR upside versus a scenario where refineries only produce hydrogen for internal process needs.
Opportunity Impact Analysis
| Opportunity | (~) % Potential CAGR | Geographic Relevance | Execution Window |
|---|---|---|---|
| Surplus blue/green hydrogen export from refineries | +2.4% | North America core, EU, GCC, APAC hubs | Medium term (2–4 years) |
| Low-carbon hydrogen derivatives (ammonia, methanol) from refinery hubs | +2.2% | EU, GCC, North America, APAC coastal | Medium–Long term (2–≥4 years) |
| Co-processing-as-a-service for biocrudes and renewable feeds | +1.9% | EU, North America, APAC aviation hubs | Short–Medium term (≤2–4 years) |
| Renewable hydrogen coupling for premium low-CI fuels | +1.8% | EU core, North America, East Asia | Medium–Long term (2–≥4 years) |
| Refinery-anchored hydrogen hub and pipeline platforms | +1.7% | U.S., EU industrial clusters, India, GCC | Long term (≥ 4 years) |
| Structured “Hydrogen-as-a-Service” for smaller refineries | +1.5% | Emerging APAC, Latin America, MENA | Medium term (2–4 years) |
Challenges Analysis
Hydrogen system reliability risk
In hydrogen‑intensive complexes, a 2–6 hour outage in a main SMR unit or pipeline segment can compel operators to cut unit rates by 10–30%, divert streams to lower‑value products, or downgrade fuel specs, with the resulting margin penalty on a 200–300 kb/d refinery easily reaching 1–3 million USD for a single incident once off‑spec product reprocessing, extra hydrogen make‑up and lost premium barrels are accounted for.
This reliability challenge is magnified as refineries integrate low‑emissions hydrogen from electrolysers, which must cope with renewable intermittency and grid events; unplanned variability of ±10–20% in renewable output can create pressure and purity swings in mixed hydrogen headers unless buffered by linepack, storage and robust control systems.
As refineries gradually improve reliability through digital twins, buffer storage and redundancy investments over 2–4 years, the drag on achievable CAGR can narrow, but today recurring reliability incidents and heightened operational risk knock an estimated 1.3 percentage points off unconstrained growth, effectively converting some potential volumes into cautious operational posture rather than aggressive hydrogen‑intensive operating strategies.
Challenges Impact Analysis
| Challenge | (~) % CAGR Friction | Geographic Relevance | Mitigation Horizon |
|---|---|---|---|
| Hydrogen system reliability risk | -1.3% | Global hydrogen-intensive refineries | Medium term (2–4 years) |
| Complex low-carbon integration engineering | -1.2% | NA, EU, APAC industrial hubs | Long term (≥ 4 years) |
| Supply chain and logistics vulnerability | -1.1% | Middle East export hubs, EU, Asia importers | Medium–Long term (2–≥4 years) |
| Storage, compression and safety constraints | -1.0% | NA core, EU regulatory hubs, APAC corridors | Long term (≥ 4 years) |
| Talent and capability gap in hydrogen systems | -0.9% | Global, acute in emerging markets | Long term (≥ 4 years) |
| Policy, demand signaling and customer commitment uncertainty | -0.8% | EU, Northeast Asia, emerging APAC | Medium term (2–4 years) |
Geopolitical Impact Analysis
Energy Import Diversification and Strategic Stockpiling Reshaping Refinery Hydrogen Operations
Geopolitical instability is changing where European refineries obtain crude oil and how they manage feedstock risk. During the first nine months of 2025, the EU’s average monthly petroleum-oil imports declined by 6.6% in volume and 18.3% in value compared with 2024.
- In the third quarter, Norway supplied 14.6% of imported crude, followed by the United States at 14.5% and Kazakhstan at 12.2%. This wider supplier base reduces dependence on one trade route, but different crude grades can alter sulphur content, processing intensity and hydrogen consumption in refinery hydrotreating and hydrocracking units.
Natural-gas security is equally important because many refineries still produce hydrogen through steam methane reforming. In 2025, EU LNG imports increased by 25.9% in volume, while their value rose by 36.1%, showing that supply diversification can carry a higher cost.
Oil and petroleum products represented 67% of EU energy imports in 2024, natural gas accounted for 24%, and overall energy import dependency stood at 57%. EU rules also require emergency oil stocks equal to at least 90 days of net imports or 61 days of consumption. These buffers help refineries maintain operations during disruptions, while encouraging investment in hydrogen storage, flexible feedstock systems and electrolysis-based supply.
Regional Analysis
Asia Pacific Held the Largest Share of the Global Petroleum Refining Hydrogen Market.
Asia Pacific held the leading position, capturing 41.4% of the petroleum refining hydrogen market. Its dominance is supported by large refinery networks, rising crude-processing activity and continued production of cleaner transport fuels.
- China’s National Bureau of Statistics reported that refineries processed 737.59 million tonnes of crude oil during 2025, an increase of 4.1% from the previous year. December processing alone reached 62.46 million tonnes, rising 5.0% year on year. This operating scale keeps hydrogen demand strong across desulfurization, hydrocracking and heavy-feed upgrading units.
Middle East and Africa is the growing regional market as governments expand and modernize domestic refining capacity. U.S. EIA data show that Iraq’s operating refinery capacity reached approximately 1.3 million barrels per day after adding 380,000 barrels per day since early 2023. Further momentum is expected from the planned 300,000-barrel-per-day Fao refinery. These additions create fresh demand for hydrogen-based fuel treatment and conversion systems.
Key Regions and Countries Covered
- North America
- The US
- Canada
- Europe
- Germany
- France
- The UK
- Spain
- Italy
- Russia & CIS
- Rest of Europe
- APAC
- China
- Japan
- South Korea
- India
- ASEAN
- Rest of APAC
- Latin America
- Brazil
- Mexico
- Rest of Latin America
- Middle East & Africa
- GCC
- South Africa
- Rest of MEA
Key Players Analysis
Petroleum refining hydrogen producers focus on strengthening process efficiency, supply reliability, and technology integration to remain competitive. A key priority is continuous improvement in hydrogen-generation systems, including higher-efficiency steam methane reforming, carbon capture integration, and advanced electrolysis solutions that reduce emissions while maintaining stable output for refinery operations.
Closer integration with natural gas suppliers, renewable power developers, and refinery operators helps secure feedstock availability and improve cost control during periods of energy-price volatility. Strategic capacity expansion near major refining clusters supports faster delivery and reduces transportation dependence. In addition, producers emphasize plant automation, energy recovery, operational safety, and purity control to ensure consistent hydrogen quality at scale.
Long-term supply contracts, pipeline connections, and joint development agreements with refiners further strengthen customer relationships, improve demand visibility, and support stronger positioning in high-value fuel upgrading and low-carbon refining applications..
The Major Players In The Industry
- BP
- ExxonMobil
- Chevron Corporation
- Indian Oil Corporation
- Messer Group
- Nel Hydrogen
- PetroChina
- Reliance Industries
- Saudi Aramco
- Shell Global
- Linde
- Air Liquide
- Air Products and Chemicals, Inc.
- Others
Key Development
- In November, 2025, Shell signed two renewable-power agreements for its 100 MW REFHYNE 2 electrolyser at Rheinland. Scheduled for 2027, the unit is expected to produce up to 16,000 tonnes of low-carbon hydrogen annually for refinery and chemical operations.
- In May, 2025, Saudi Aramco completed the acquisition of a 50% interest in Blue Hydrogen Industrial Gases Company, strengthening its lower-carbon hydrogen portfolio and industrial supply capabilities for regional industrial demand.
Report Scope
| Report Features | Description |
|---|---|
| Market Value (2025) | USD 142.0 Bn |
| Forecast Revenue (2035) | USD 384.8 Bn |
| CAGR (2026-2035) | 10.5% |
| Base Year for Estimation | 2025 |
| Historic Period | 2020-2024 |
| Forecast Period | 2026-2035 |
| Report Coverage | Revenue Forecast, Market Dynamics, Competitive Landscape, Recent Developments |
| Segments Covered | By Type (Grey, Green, Blue and Other), By Supply & Distribution System (Captive and Merchant), By Application (Hydrotreating /Desulfurization, Hydrocracking and Heavy Oil Upgrading), By Production Technology (Steam Methane Reforming (SMR), Water Electrolysis, Partial Oxidation (POX) and Coal / Biomass Gasification) |
| Regional Analysis | North America – The US & Canada; Europe – Germany, France, The UK, Spain, Italy, Russia & CIS, Rest of Europe; APAC– China, Japan, South Korea, India, ASEAN & Rest of APAC; Latin America– Brazil, Mexico & Rest of Latin America; Middle East & Africa– GCC, South Africa, & Rest of MEA |
| Competitive Landscape | BP, ExxonMobil, Chevron Corporation, Indian Oil Corporation, Messer Group, Nel Hydrogen, PetroChina, Reliance Industries, Saudi Aramco, Shell Global, Linde, Air Liquide, Air Products and Chemicals, Inc. and Others. |
| Customization Scope | Customization for segments, region/country-level will be provided. Moreover, additional customization can be done based on the requirements. |
| Purchase Options | We have three licenses to opt for: Single User License, Multi-User License (Up to 5 Users), Corporate Use License (Unlimited Users and Printable PDF) |





































