


Report Overview
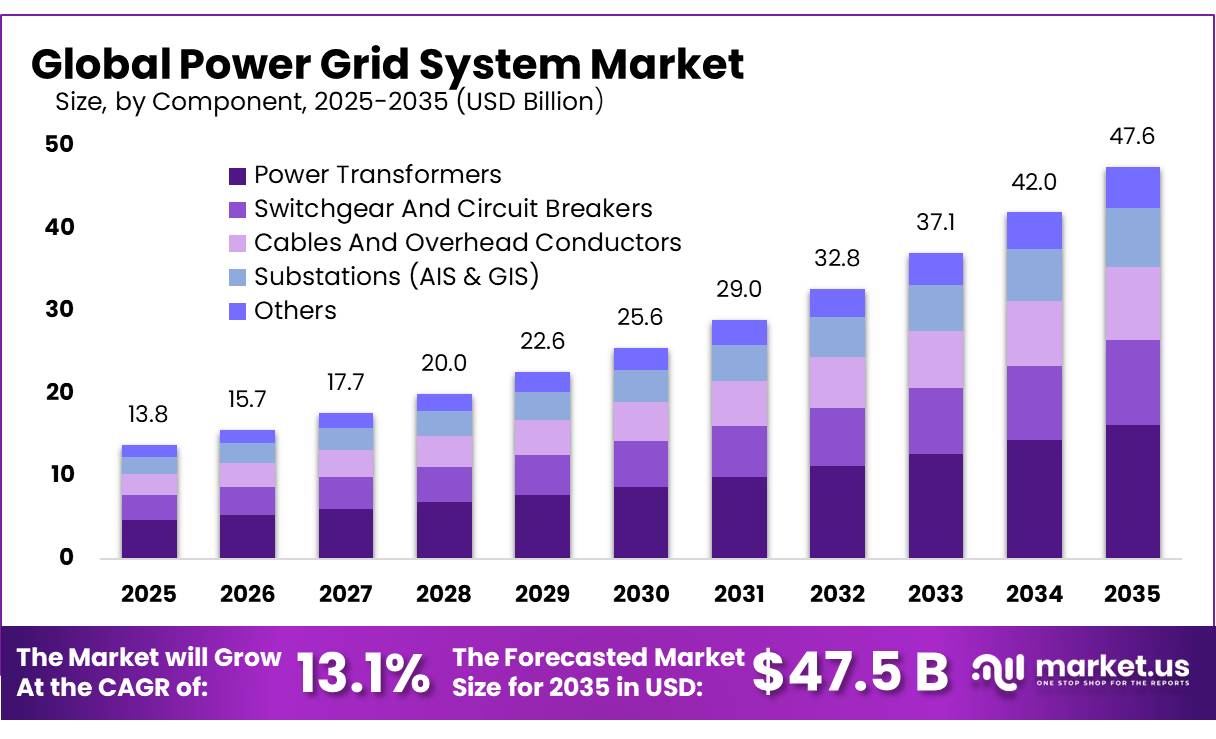
The Global Power Grid System Market size is expected to be worth around USD 47.5 Billion by 2035, from USD 13.8 Billion in 2025, growing at a CAGR of 13.1% during the forecast period from 2026 to 2035. In 2025, Asia-Pacific held a dominant market position, capturing more than a 35.11% share, holding USD 4.8 Billion revenue.
The industrial scenario is being shaped by rising electricity consumption, renewable energy integration and the need to replace ageing grid infrastructure. Solar and wind power have increased the need for flexible transmission and distribution networks because their electricity output changes with weather conditions.
- The IEA estimates that more than 2,500 GW of renewable energy, storage and large-load projects are waiting for grid connections worldwide. It also states that annual global grid investment, currently around USD 400 billion, needs to increase by approximately 50% by 2030 to support expected electricity demand. These conditions are encouraging utilities to invest in stronger transmission corridors, advanced transformers, digital substations and improved grid monitoring systems.
A major driving factor is the growing use of electricity across manufacturing, transport, buildings and digital infrastructure. Data centres, electric vehicle charging networks and industrial electrification are creating new demand centres that require dependable power supply and additional network capacity.
The IEA estimates that electricity grid capacity must increase by at least 30% by 2035, requiring the addition or replacement of approximately 25 million kilometres of power lines. At the same time, ageing infrastructure is increasing the need for equipment replacement, system upgrades and improved protection against extreme weather events. In the United States, the Energy Information Administration reported that transmission investment reached USD 27.7 billion in 2023, while distribution investment reached USD 50.9 billion, reflecting continued spending on grid expansion and equipment upgrades.
Government initiatives and energy policies are also supporting industry development. The European Commission’s Grids Action Plan identifies an investment requirement of approximately EUR 584 billion by 2030 for electricity networks. It also reports that around 40% of European distribution grids are more than 40 years old, highlighting the need for modernisation.
In the United States, the Department of Energy’s Grid Modernization Initiative supports research and development focused on grid reliability, resilience, cybersecurity, flexibility and renewable energy integration. These programmes encourage utilities and equipment manufacturers to develop more efficient grid technologies and strengthen electricity infrastructure.
The IEA estimates that technologies such as dynamic line rating, network topology optimisation and advanced power-flow control could allow up to 330 GW of additional generation, storage and demand to connect to existing networks without major reinforcement. Overall, rising electricity demand, renewable energy deployment, infrastructure replacement and government-backed modernisation programmes are expected to create sustained opportunities for power grid system manufacturers, engineering companies and technology providers.
Key Takeaways
- Power Grid System Market size is expected to be worth around USD 47.5 Billion by 2035, from USD 13.8 Billion in 2025, growing at a CAGR of 13.1%.
- Power Transformers held a dominant market position, capturing more than a 34.21% share.
- Transmission Grid held a dominant market position, capturing more than a 61.22% share.
- Low Voltage held a dominant market position, capturing more than a 40.21% share.
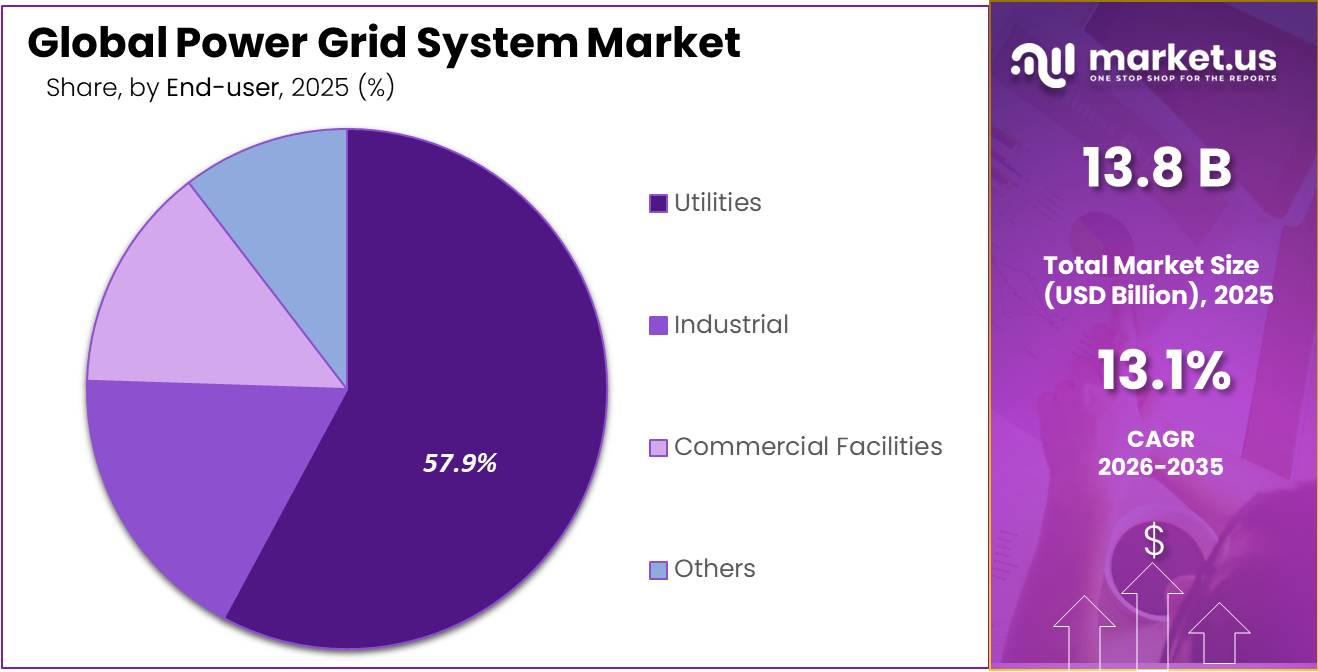
- Utilities held a dominant market position, capturing more than a 56.78% share.
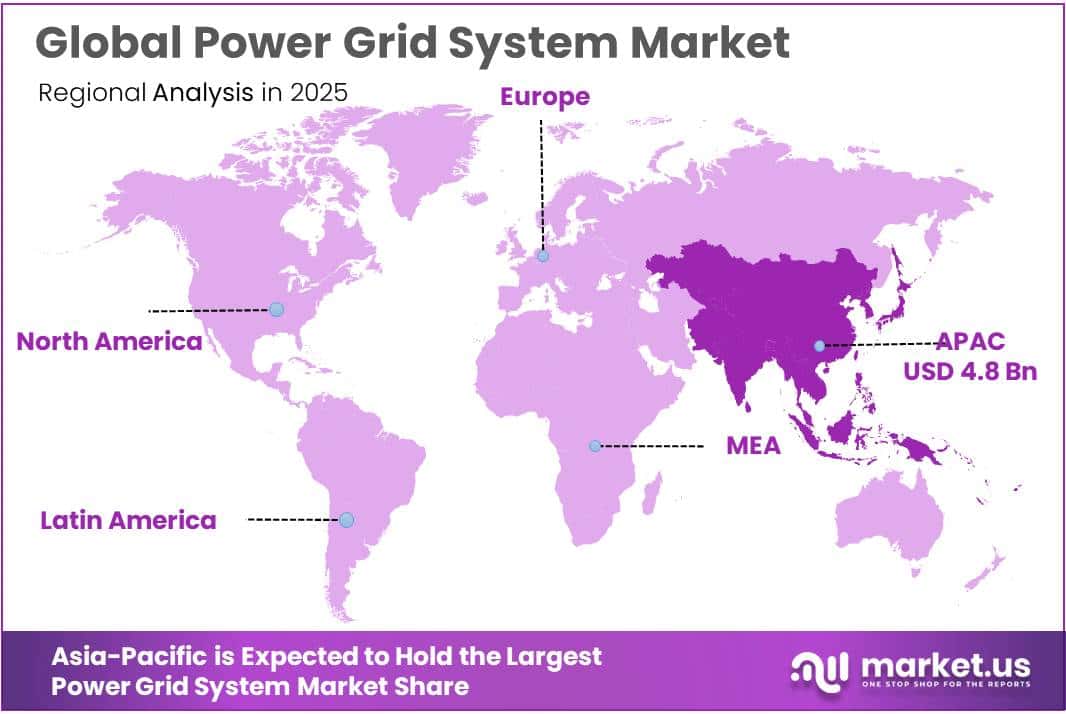
- Asia-Pacific dominated the Power Grid System Market in 2025, accounting for 35.11% of the global market, with a market value of USD 4.8 billion.
By Component Analysis
Power Transformers lead the component segment through their essential role in voltage conversion, grid stability and long-distance electricity transmission.
In 2025, “Power Transformers” held a dominant market position, capturing more than a 34.21% share. Their leading position is supported by their importance in stepping voltage up for efficient power transmission and stepping it down for safe distribution to homes, businesses and industrial facilities. Power transformers are also essential for connecting renewable energy projects, substations and expanding transmission networks.
The U.S. Department of Energy identifies transformers as critical grid equipment and reports that the country has more than 80,000 different distribution transformer varieties, reflecting the wide range of utility requirements. The Department also notes that transformer delivery lead times increased from 3–6 months in 2019 to 12–30 months in 2023, highlighting strong demand and supply-chain pressure. These conditions support continued investment in transformer manufacturing, replacement and grid expansion.
Switchgear and circuit breakers are important components of substations because they help control electrical circuits, disconnect faulty sections and protect equipment from damage during abnormal operating conditions. Their demand is supported by the expansion of transmission and distribution networks, replacement of ageing equipment and the growing need for reliable electricity supply. In 2026, the U.S. Department of Energy reported a grid modernisation project involving 84 new electric reclosers across 13 substations and 28 electric distribution circuits.
Although reclosers are not the same as circuit breakers, they perform a related switching and protection function and demonstrate ongoing investment in grid protection equipment. The Federal Energy Regulatory Commission also explains that circuit breakers are used to separate sections of the electricity network when faults are detected. These requirements are expected to support demand for modern switchgear, high-voltage circuit breakers and digitally controlled protection systems as utilities strengthen grid reliability and expand network capacity.
By Grid Type Analysis
Transmission Grid leads the segment because it carries electricity over long distances and connects major power generation facilities with regional distribution networks.
In 2025, “Transmission Grid” held a dominant market position, capturing more than a 61.22% share. Its leading position is supported by the growing need to transport electricity from large power plants, renewable energy projects and remote generation sites to cities and industrial centres. Transmission grids use high-voltage lines and substations to move electricity efficiently while limiting energy losses over long distances.
In 2025, the U.S. Energy Information Administration reported that the United States had approximately 700,000 miles of high-voltage transmission lines, demonstrating the scale of infrastructure required to support electricity supply. The U.S. Department of Energy has also highlighted the need to expand and modernise transmission networks to connect new generation capacity and improve grid reliability. These requirements are encouraging investment in high-voltage lines, substations, transformers and advanced grid-control technologies.
Distribution Grid demand is supported by the expansion of residential areas, commercial facilities, manufacturing units and electric vehicle charging infrastructure. Unlike transmission networks, distribution grids operate closer to end users and rely on local power lines, distribution transformers, substations and protection equipment to maintain a stable electricity supply. According to the U.S. Department of Energy, the country’s electricity network includes approximately 6.3 million miles of distribution lines, showing the extensive infrastructure required for local electricity delivery.
In 2025, American Electric Power reported approximately 252,000 miles of distribution lines across its service network, serving around 5.6 million customers. Investment is also supporting network upgrades. The U.S. Energy Information Administration reported that utilities spent USD 50.9 billion on distribution infrastructure in 2023, an increase of USD 6.5 billion from 2022. This investment covered overhead and underground lines, transformers and substation equipment. Growing electricity consumption, rooftop solar connections, battery storage and electric vehicle charging are increasing the need for stronger and smarter distribution networks.
By Voltage Type Analysis
Low Voltage leads the segment through its wide use in final electricity distribution to residential, commercial and industrial consumers.
In 2025, “Low Voltage” held a dominant market position, capturing more than a 40.21% share. Its position is supported by the extensive use of low-voltage networks to deliver electricity from distribution transformers to homes, offices, retail buildings and smaller industrial facilities. These networks commonly supply equipment, lighting, appliances and other end-use electrical loads.
The U.S. Department of Energy identifies distribution transformers as essential equipment for reducing grid voltage to levels suitable for consumers. A 2026 report from the U.S. Congressional Research Service estimates that approximately 60 million to 80 million distribution transformers are in service across the United States. This large installed base highlights the importance of low-voltage distribution infrastructure and the ongoing need for transformer replacement, network maintenance and capacity upgrades.
Medium Voltage plays an important role in electricity distribution because it carries power from substations to local distribution transformers and large commercial or industrial users. It is commonly used in networks operating at 4.16 kV, 6.9 kV, 13.2 kV, 25 kV and 34.5 kV. In 2025, demand for medium-voltage equipment was supported by the need to connect new electricity loads, upgrade ageing feeders and improve network capacity.
The U.S. Department of Energy identifies distribution feeders operating at around 15 kV or above as important for accommodating growing electricity demand, including electric vehicle charging. Its grid integration assessment also reports that a 2018 survey of 167 utilities found 35% of respondents had distribution feeders operating below 10 kV, indicating the need for network upgrades in some service areas.
By End User Analysis
Utilities dominate the end-user segment due to their continuous investment in electricity generation, transmission, distribution and grid modernisation.
In 2025, “Utilities” held a dominant market position, capturing more than a 56.78% share. Their leading position is supported by the responsibility of electric utilities to maintain reliable electricity supply across residential, commercial and industrial networks. Utilities regularly invest in power transformers, substations, transmission lines, switchgear, circuit breakers and grid monitoring systems to manage rising electricity demand and replace ageing infrastructure.
According to the U.S. Energy Information Administration (EIA), total U.S. electricity consumption reached approximately 4.20 trillion kWh in 2025, its highest recorded level. Residential consumers accounted for 1.51 trillion kWh, commercial consumers used 1.49 trillion kWh, and industrial consumers accounted for 1.04 trillion kWh. This growing consumption increases the need for utilities to strengthen grid capacity, improve operational reliability and expand electricity infrastructure.
Industrial demand for power grid systems is supported by manufacturing facilities, chemical plants, steel producers, mining operations, data centres and other energy-intensive businesses. These facilities require stable electricity supply to operate motors, production machinery, automated systems, compressors and processing equipment.
In 2025, the U.S. industrial sector purchased approximately 1.05 trillion kWh of electricity, compared with 1.03 trillion kWh in 2024, representing an increase of 1.5%, according to the EIA. Industrial electricity sales generated approximately USD 89.4 billion in revenue during 2025. This level of electricity use highlights the importance of dependable grid connections, dedicated substations, medium-voltage distribution systems and high-capacity transformers for industrial operations.
Key Market Segments
By Component
- Power Transformers
- Switchgear And Circuit Breakers
- Cables And Overhead Conductors
- Substations (AIS & GIS)
- Others
By Grid Type
- Transmission Grid
- Distribution Grid
- Sub-Transmission Grid
By Voltage Type
- Low Voltage
- Medium Voltage
- High Voltage
By End User
- Utilities
- Industrial
- Commercial Facilities
- Others
Driver Analysis
Electrification-Led Load Growth — +0.7 Percentage Points
Rising electricity consumption expands the physical requirement for substations, transformers, feeders and protection systems, particularly where industrial activity, cooling, transport and building electrification increase local peak demand. IEA’s Electricity 2026 projects average global electricity-demand growth of 3.6% annually during 2026–2030, following 3% growth in 2025; it identifies industry, electric vehicles, air conditioning and data centers as major contributors and estimates that meeting demand requires annual grid investment to rise roughly 50% from approximately USD 400 billion by 2030.
The investment requirement is not committed expenditure, and energy growth does not translate one-for-one into network capacity because load location, coincidence and utilization determine reinforcement needs. In a constructed distribution zone with a 500 MW peak, 4% annual peak growth increases demand to approximately 608 MW after five years, adding about 108 MW; if planners limit transformer loading to 80% of nameplate capacity, the simplified incremental requirement is approximately 135 MVA at unity power factor, before redundancy and engineering adjustments.
At an assumed USD 150,000 per MVA for a defined package of substation equipment and integration—not a universal transformer price—that represents roughly USD 20 million of addressable procurement. The +0.7-point sensitivity assumes 30% of terminal market revenue is exposed to non-data-center load expansion and experiences approximately 11.3% cumulative outperformance, adding 3.4% terminal revenue. Suppliers benefit through multi-year utility frameworks and integrated substation packages rather than isolated component sales; data-center load is allocated separately to avoid counting the same demand twice.
Drivers Impact Analysis
| Driver | (~) % Impact on CAGR | Geographic Relevance | Impact Timeline |
|---|---|---|---|
| Electrification-led load growth | +0.7 pp | China, India, ASEAN, US, EU | Medium term (2–4 years) |
| Renewable connection buildout | +0.7 pp | China, EU, US, India, Brazil | Long term (≥ 4 years) |
| Data-center connection demand | +0.6 pp | US, China, EU, Japan | Medium term (2–4 years) |
| Ageing-asset replacement | +0.6 pp | EU, UK, US, Japan | Long term (≥ 4 years) |
| Transmission planning reform | +0.5 pp | US, EU | Long term (≥ 4 years) |
| Resilience and digital upgrades | +0.4 pp | US, EU, Australia, Japan | Medium term (2–4 years) |
Restraint Analysis
Transformer and Cable Shortages — −0.7 Percentage Points
Limited production capacity for critical grid components directly caps deliverable project volumes, preventing demand growth from converting into equipment deliveries within the forecast period. IEA’s February 2025 industry survey found procurement lead times of two to three years for cables, up to four years for large power transformers and more than five years for specialized direct-current cables; average cable and large-transformer lead times had almost doubled since 2021. These are surveyed transmission-market conditions, not universal lead times for every distribution transformer or switchgear order.
In a constructed project requiring a large transformer delivered thirty months after financial approval, a forty-eight-month supply window creates an eighteen-month mismatch unless the buyer reserves capacity earlier; supplier revenue may be deferred even where the customer remains committed. For a USD 100 million substation portfolio containing USD 30 million of transformer procurement, a modeled 20% reservation payment ties up USD 6 million; eighteen months of financing at 8% annually adds approximately USD 720,000 under a simple-interest assumption, before storage, escalation or project restructuring.
The −0.7-point sensitivity assumes 25% of terminal counterfactual revenue is bottleneck-sensitive and experiences a 12.8% realization shortfall, equivalent to approximately 3.2% market-wide terminal erosion. Strategic consequences include early procurement, capacity-reservation agreements and reduced willingness to pursue uncertain projects; however, backlog growth is not recognized sales, and delayed deliveries outside 2031 remain a forecast-period restraint even if the underlying orders are ultimately fulfilled.
Restraint Impact Analysis
| Restraint | (~) % Impact on CAGR Forecast | Geographic Relevance | Impact Timeline |
|---|---|---|---|
| Transformer and cable shortages | −0.7 pp | US, EU, UK, India | Medium term (2–4 years) |
| Permitting and corridor delays | −0.6 pp | US, EU, UK, Australia | Long term (≥ 4 years) |
| Equipment-cost budget erosion | −0.5 pp | US, EU, India, ASEAN | Medium term (2–4 years) |
| Utility financing deficits | −0.4 pp | Sub-Saharan Africa, South Asia | Long term (≥ 4 years) |
| Cost-allocation approval barriers | −0.3 pp | US multi-state; EU cross-border | Medium term (2–4 years) |
| Connection-dependent order deferrals | −0.3 pp | US, EU, UK, Australia | Medium term (2–4 years) |
Opportunity Analysis
Advanced-Conductor Retrofit Packages — +0.5 Percentage Points
The opportunity is to convert under-assessed existing corridors into engineered retrofit programs combining advanced conductors, fittings, line assessments and protection coordination, rather than merely participate in ordinary replacement demand. DOE’s Advanced Conductor Scan summary reports that advanced-conductor reconductoring can approximately double line capacity at about one-third the cost of constructing new lines; its assessment of 44 utilities identified 118,821 miles of existing transmission lines that could benefit, although that mileage is a screened technical opportunity—not a funded procurement pipeline or universal engineering result.
In a constructed corridor carrying 500 MW, a technically validated doubling would provide 500 MW of additional line capability, but only if substations, stability limits and downstream constraints allow that capability to be used. At an assumed USD 100 million project cost and 55% eligible equipment and integration content, supplier-addressable revenue is USD 55 million. If a supplier wins three such packages annually, revenue reaches USD 165 million; at an assumed 15% contribution margin, contribution is USD 24.75 million before central overhead and financing.
The +0.5-point sensitivity requires approximately 2.4% incremental terminal market revenue from accelerated projects, higher-value retrofit content and previously unexecuted upgrades, net of conventional conductor purchases displaced. Strategic value lies in corridor screening and turnkey engineering, not conductor sales alone; reconductoring that simply replaces a larger future project may reduce total system expenditure, so supplier upside must be demonstrated through additional executed scope and mix rather than inferred from customer savings.
Opportunity Impact Analysis
| Opportunity | (~) % Potential CAGR Upside | Geographic Relevance | Execution Window |
|---|---|---|---|
| Advanced-conductor retrofit packages | +0.5 pp | US, Germany, Belgium, India, Brazil | Medium term (2–4 years) |
| Verified-capacity service contracts | +0.5 pp | US, UK, EU, Australia | Short term (≤ 2 years) |
| Flexible-connection control platforms | +0.4 pp | UK, EU, US, Australia | Medium term (2–4 years) |
| Distribution flexibility orchestration | +0.4 pp | US, Germany, UK, Japan, Australia | Medium term (2–4 years) |
| Asset-specific AI applications | +0.3 pp | US, EU, Japan, South Korea | Medium term (2–4 years) |
| Capability-led acquisition platforms | +0.3 pp | US, Germany, Benelux, Singapore | Short term (≤ 2 years) |
Challenges Analysis
Legacy-System Data Interoperability — −0.4 Percentage Points
The operating vulnerability is the difficulty of making asset registers, geographic information systems, SCADA, outage-management platforms and newer distribution applications describe the same network consistently, rather than a lack of demand for digital equipment. In IEA’s 2026 survey of network operators, 60% identified data availability and quality as a major barrier to AI adoption, while the agency highlighted interoperable data models and improved visibility as foundations for wider digital deployment; these survey results are not measurements of failed grid projects.
In a constructed integration program covering 100,000 asset records, a 5% reconciliation rate creates 5,000 exceptions; at two engineering-hours per exception and USD 90 per hour, remediation costs USD 900,000. If corrections delay deployment across twenty substations by three months, a supplier recognizing an assumed USD 250,000 per substation at acceptance may defer USD 5 million of revenue, although payment and accounting treatment depend on contract terms. On a USD 20 million fixed-price integration contract with USD 16 million of planned delivery cost, absorbing the USD 900,000 rework reduces gross margin from 20% to 15.5%, before additional support expense.
The −0.4-point sensitivity assumes 20% of terminal opportunity-enabled revenue is interoperability-sensitive and suffers a 9.5% realization shortfall, producing approximately 1.9% aggregate terminal friction. Mitigation requires asset-data ownership, common identifiers, interface testing and phased cutovers; remediation spending can itself generate supplier revenue, so the deduction counts only net delayed or unrealized sales after that offset.
Challenges Impact Analysis
| Challenge | (~) % CAGR Friction | Geographic Relevance | Mitigation Horizon |
|---|---|---|---|
| Legacy-System Data Interoperability | −0.4 pp | US, EU, Japan, India | Medium term (2–4 years) |
| Inverter-Based Stability Validation | −0.4 pp | US, EU, Australia, China | Long term (≥ 4 years) |
| Power-Digital Workforce Development | −0.3 pp | US, EU, Japan, India | Long term (≥ 4 years) |
| Operational Cybersecurity Lifecycle Management | −0.3 pp | US, EU, UK, Japan | Long term (≥ 4 years) |
| Outage and Commissioning Coordination | −0.3 pp | US, EU, India, China | Medium term (2–4 years) |
| AI Model Performance Governance | −0.2 pp | US, EU, Japan, South Korea | Medium term (2–4 years) |
Geopolitical Impact Analysis
Geopolitical Impact of Ongoing Wars on the Power Grid System Market
The ongoing Russia-Ukraine war and the 2026 Middle East conflict are increasing pressure on global power grid systems by damaging energy infrastructure, disrupting fuel supplies and raising equipment and operating costs. In Ukraine, repeated attacks on power plants and substations have reduced electricity generation and weakened transmission reliability. According to the International Energy Agency (IEA), Ukraine’s available generation capacity fell to approximately 11.1 GW against peak winter demand of 18 GW in early 2026.
The Middle East conflict has also disrupted energy transportation through the Strait of Hormuz, affecting nearly 20% of global liquefied natural gas supply that passed through the route in 2025. These disruptions have increased electricity generation costs and encouraged countries to strengthen energy security through grid upgrades, storage systems and alternative power sources. For the power grid system market, the situation is creating demand for transformers, switchgear, circuit breakers, backup systems and resilient transmission infrastructure.
However, higher material prices, supply-chain delays and geopolitical uncertainty may slow project execution. The IEA’s 2026 policy tracker also highlights emergency energy measures adopted by governments to manage supply disruptions. Consequently, investment in grid resilience, decentralised power systems and cross-border electricity connections is becoming increasingly important.
Regional Insights
Asia-Pacific: Dominating Region
Asia-Pacific dominated the Power Grid System Market in 2025, accounting for 35.11% of the global market, with a market value of USD 4.8 billion. The region’s leading position is supported by rising electricity consumption, expanding industrial infrastructure, renewable energy integration and large-scale investments in transmission and distribution networks. China, Japan, South Korea and Southeast Asian economies are investing in high-voltage transmission lines, power transformers, substations and smart grid technologies to improve electricity supply and network reliability.
According to the International Energy Agency (IEA), electricity demand in Asia-Pacific increased by 4.1% in 2025, accounting for approximately two-thirds of the global increase. The IEA also expects regional electricity demand to grow by an average of 4.7% annually between 2026 and 2030. These developments are supporting demand for advanced grid equipment, digital monitoring systems and grid expansion projects.
Asia-Pacific is also positioned for strong growth over the coming years due to increasing electricity requirements and renewable energy capacity additions. China is expected to remain a major contributor, accounting for nearly 70% of the region’s additional electricity demand between 2026 and 2030, while Southeast Asia is expected to contribute approximately 11%. Renewable energy integration is creating further requirements for flexible transmission networks, advanced substations, energy storage connections and grid balancing technologies.
Key Regions and Countries Insights
- North America
- US
- Canada
- Europe
- Germany
- France
- The UK
- Spain
- Italy
- Rest of Europe
- Asia Pacific
- China
- Japan
- South Korea
- India
- Australia
- Rest of APAC
- Latin America
- Brazil
- Mexico
- Rest of Latin America
- Middle East & Africa
- GCC
- South Africa
- Rest of MEA
Key Players Analysis
Siemens AG: Siemens AG is a major technology and engineering company with a strong presence in power transmission, distribution automation, smart grids and substation solutions. Its Smart Infrastructure business supports utilities through grid control, digitalisation and electrical distribution technologies. In fiscal year 2025, Siemens reported total revenue of EUR 78.9 billion, compared with EUR 75.9 billion in 2024.
ABB Ltd.: ABB Ltd. is a global electrification and automation company that supplies medium- and low-voltage equipment, switchgear, circuit breakers, grid connection technologies and digital power management solutions. These products help utilities improve electricity distribution and network reliability. In 2025, ABB recorded revenue of USD 33.22 billion, orders of USD 36.77 billion and operational EBITA of USD 6.31 billion. The company invested USD 1.32 billion in research and development and employed approximately 111,900 people worldwide, supporting continued development of advanced grid technologies.
General Electric Company (GE Vernova): GE Vernova, the energy business formed from General Electric’s separation, is an important supplier of power grid technologies through its Electrification business, which includes grid solutions, transformers, substations and power conversion systems. In 2025, GE Vernova generated total revenue of USD 38 billion and recorded orders of USD 59 billion, with a backlog of approximately USD 150 billion. Its Electrification segment generated USD 9.64 billion in revenue, while its remaining performance obligations reached USD 34.67 billion.
Top Key Players Outlook
- Siemens AG
- ABB Ltd.
- General Electric Company
- Schneider Electric SE
- Hitachi Ltd.
- Mitsubishi Electric Corporation
- Eaton Corporation PLC
- Cisco Systems, Inc.
- Honeywell International Inc.
- Toshiba Corporation
- Hyundai Electric & Energy Systems Co., Ltd.
- Crompton Greaves Limited
- Fuji Electric Co., Ltd.
- Prysmian Group
- Other Key Players
Recent Developments
- October 2026: Schneider Electric signed a definitive agreement to acquire PTC Inc. for approximately USD 22.6 billion in equity value, representing an offer of USD 205 per share. The transaction is intended to strengthen its industrial software, engineering and artificial intelligence capabilities. The agreement also includes expected annual cost synergies of approximately EUR 250 million by the third year and potential revenue synergies of around EUR 800 million.
- April 2026: Hitachi Energy and Adani Energy Solutions commissioned the Kudus-Aarey HVDC city-centre connection in Mumbai. The system can deliver up to 1,000 MW of electricity and increased the city’s external power supply capacity by 50%, supporting electricity requirements for more than 20 million people. June 2026: Hitachi Energy India announced an investment of approximately INR 2,000 crore to establish a large power transformer manufacturing facility in Karjan, Vadodara.
Report Scope
| Report Features | Description |
|---|---|
| Market Value (2025) | USD 13.84 Bn |
| Forecast Revenue (2035) | USD 47.55 Bn |
| CAGR (2026-2035) | 13.1% |
| Base Year for Estimation | 2025 |
| Historic Period | 2020-2024 |
| Forecast Period | 2026-2035 |
| Report Coverage | Revenue Forecast, Market Dynamics, Competitive Landscape, Recent Developments |
| Segments Covered | By Component (Power Transformers, Switchgear And Circuit Breakers, Cables And Overhead Conductors, Substations (AIS & GIS), Others), By Grid Type (Transmission Grid, Distribution Grid, Sub-Transmission Grid), By Voltage Type (Low Voltage, Medium Voltage, High Voltage), By End User (Utilities, Industrial, Commercial Facilities, Others) |
| Regional Analysis | North America – US, Canada; Europe – Germany, France, The UK, Spain, Italy, Rest of Europe; Asia Pacific – China, Japan, South Korea, India, Australia, Singapore, Rest of APAC; Latin America – Brazil, Mexico, Rest of Latin America; Middle East & Africa – GCC, South Africa, Rest of MEA |
| Competitive Landscape | Siemens AG, ABB Ltd., General Electric Company, Schneider Electric SE, Hitachi Ltd., Mitsubishi Electric Corporation, Eaton Corporation PLC, Cisco Systems, Inc., Honeywell International Inc., Toshiba Corporation, Hyundai Electric & Energy Systems Co., Ltd., Crompton Greaves Limited, Fuji Electric Co., Ltd., Prysmian Group, Other Key Players |
| Customization Scope | Customization for segments, region/country-level will be provided. Moreover, additional customization can be done based on the requirements. |
| Purchase Options | We have three licenses to opt for: Single User License, Multi-User License (Up to 5 Users), Corporate Use License (Unlimited User and Printable PDF) |








