
Quick Navigation
Report Overview
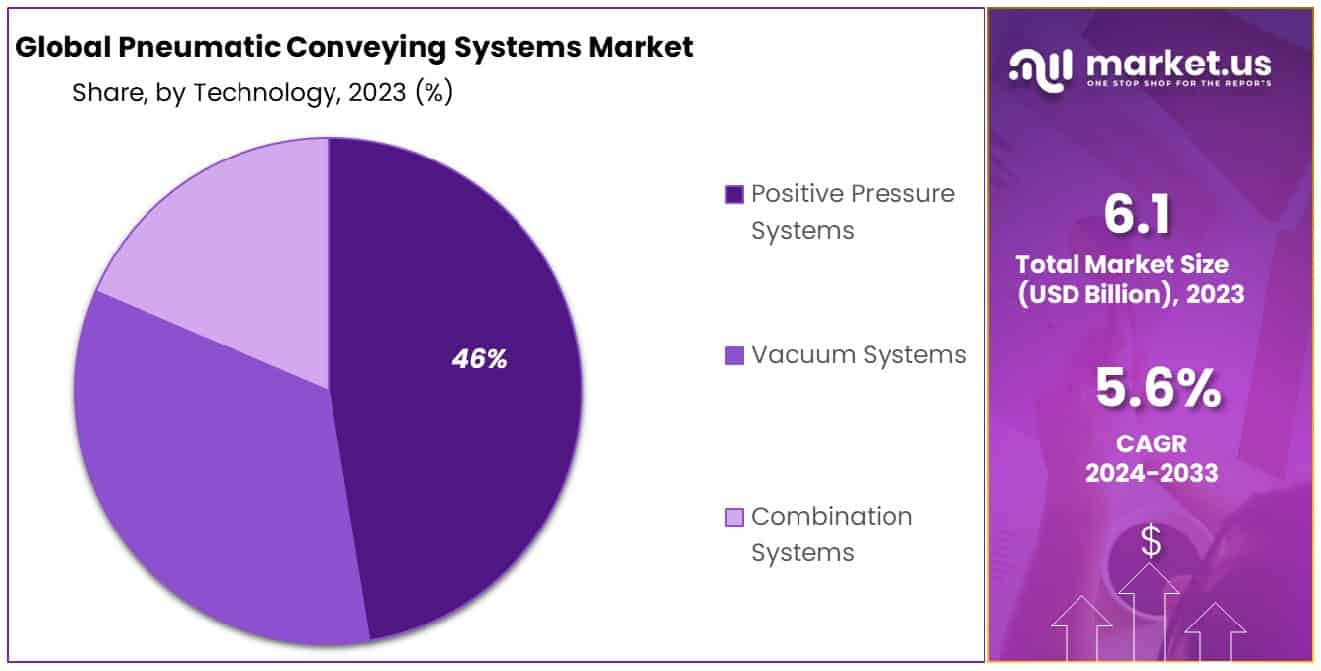
The Global Pneumatic Conveying Systems Market size is expected to be worth around USD 10.5 Billion by 2033, from USD 6.1 Billion in 2023, growing at a CAGR of 5.60% during the forecast period from 2024 to 2033.
The Pneumatic Conveying Systems Market encompasses advanced technology systems designed for the efficient transport of materials in powder or granular form through pipelines using air or gas flow. These systems are pivotal in diverse industries, including pharmaceuticals, food, chemicals, and manufacturing, due to their capabilities to enhance operational efficiency, safety, and hygiene. As the demand for automation and precision in material handling grows, this market is witnessing significant expansion.

The Pneumatic Conveying Systems Market is poised for significant growth, catalyzed by a confluence of industrial efficiency demands and environmental stewardship. This market, integral to the transport of bulk materials in industries such as pharmaceuticals, food, chemicals, and manufacturing, is witnessing a paradigm shift towards automation and precision in material handling processes.
The shift is underscored by the U.S. Environmental Protection Agency’s (EPA) data, which highlights that nearly 94 million tons of municipal solid waste (MSW) were recycled and composted in 2018, achieving a recycling rate of 32.1%. This underscores a growing emphasis on sustainable practices within industrial operations, a trend that pneumatic conveying systems are well-positioned to support by minimizing waste and enhancing efficiency in material transport.
Moreover, the U.S. rubber and plastics end-use market, a significant consumer of pneumatic conveying systems, has shown promising growth projections with output increases estimated at 3.6% in 2022, 3% in 2023, and 2.2% in 2024. This growth trajectory signals robust demand for advanced conveying solutions that can address the nuanced needs of these industries, from operational efficiency to compliance with environmental regulations.
As organizations strive to align their operations with sustainability goals while maintaining a competitive edge, the adoption of pneumatic conveying systems emerges as a strategic imperative. This market’s evolution is closely linked to technological advancements, regulatory frameworks, and the broader industrial emphasis on sustainability.
Key Takeaways
- Market Size: Pneumatic Conveying Systems Market size is expected to be worth around USD 10.5 Billion by 2033, from USD 6.1 Billion in 2023, growing at a CAGR of 5.60% during the forecast period from 2024 to 2033.
- By Operating Principle Analysis: Dilute phase conveying dominates the market with a commanding 62% share.
- By Technology Analysis: Positive pressure systems lead in technology, capturing a significant 46% share.
- By End-Use Industry Analysis: The food industry emerges as a major end-user, holding a notable 31% market share.
- Regional Analysis: Asia-Pacific leads the Pneumatic Conveying Systems Market, commanding a substantial share of 34.2% in the industry.
Driving Factors
Growing Demand for Advanced and Energy-Efficient Pneumatic Conveying Systems
The Pneumatic Conveying Systems Market is experiencing robust growth, driven by the escalating demand for advanced and energy-efficient solutions. This surge is largely attributed to industries seeking to reduce operational costs and environmental impact. Energy-efficient systems optimize air consumption and minimize waste, leading to significant cost savings and sustainability benefits.
Moreover, advancements in technology have enhanced system reliability and performance, making these solutions increasingly attractive. The integration of smart controls and IoT connectivity further elevates their appeal by offering unprecedented levels of efficiency and monitoring. This trend reflects a broader industry shift towards sustainable and cost-effective material handling solutions, signaling a promising growth trajectory for the market.
Increasing Demand from the Food and Beverage Industry
The food and beverage sector’s burgeoning demand for pneumatic conveying systems plays a pivotal role in the market’s expansion. This demand is fueled by the need for stringent hygiene standards, efficient handling of diverse materials, and the reduction of cross-contamination risks. Pneumatic systems, with their enclosed nature, offer an ideal solution by ensuring product purity and safety.
According to the USDA Economic Research Service, prices for processed fruits and vegetables grew by 8.0% from 2022 to 2023, reflecting an increase in production and processing costs that pneumatic conveying systems can help mitigate through improved operational efficiency.
Furthermore, the versatility of these systems to handle various particle sizes and types, from grains to powders, aligns with the diverse requirements of the food and beverage industry. As this sector continues to grow, driven by consumer preferences for processed and packaged foods, the demand for pneumatic conveying systems is set to rise, underscoring their critical role in maintaining operational efficiency and compliance with food safety regulations.
Restraining Factors
High Initial Investments
The requirement for significant initial investments in pneumatic conveying systems, especially for large-scale production facilities, acts as a major restraining factor for market growth. This high upfront cost can deter small to medium enterprises (SMEs) from adopting these systems, limiting the market’s expansion to larger, more financially robust entities.
Competition from Alternative Conveying Systems
The presence of alternative conveying systems in the market, such as ball transfer, magnetic, and chain conveyors, poses a challenge to the growth of the pneumatic conveying systems market. These alternatives, often perceived as more cost-effective or suitable for specific applications, can divert potential customers away from pneumatic solutions, impacting market penetration.
By Operating Principle Analysis
The Dilute Phase Conveying segment led with a 62% market share, showcasing its widespread industry preference.
In 2023, Dilute Phase Conveying held a dominant market position in the By Operating Principle segment of the Pneumatic Conveying Systems Market, capturing more than a 62% share. This prominence is attributed to its widespread adoption across various industries for its efficiency in handling a wide range of materials, cost-effectiveness, and ease of installation and maintenance, making it a preferred choice for many businesses seeking reliable and economical conveying solutions.
Dense Phase Conveying, while occupying a smaller market share compared to Dilute Phase Conveying, is recognized for its ability to transport materials gently and efficiently, particularly suitable for abrasive or fragile materials. Its specialized application in handling high-density materials and its lower air consumption rates position it as a valuable option for specific industrial requirements, thereby supporting its steady growth in the Pneumatic Conveying Systems Market.
By Technology Analysis
In 2023, Positive Pressure Systems led the market, securing over 46% share with dominant performance.
Positive Pressure Systems held a dominant market position in the By Operating Principle segment of the Pneumatic Conveying Systems Market, capturing more than a 46% share. Their widespread utilization is attributed to their effectiveness in transporting materials over long distances with minimal product degradation, making them ideal for various industrial applications, including heavy-duty material handling.
Vacuum Systems, known for their efficiency in short to medium transport distances, offer a high degree of safety and hygiene, crucial for industries like pharmaceuticals and food. Their market presence is marked by their capability to handle delicate materials with precision, underscoring their importance in specific sector applications.
Combination Systems provide the flexibility of both positive pressure and vacuum systems, catering to complex material handling needs. Their adaptability to diverse operational requirements allows for customized solutions, making them a valuable choice for industries seeking versatile pneumatic conveying options. Their contribution to the market reflects the growing demand for multifunctional conveying solutions.
By End-Use Industry Analysis
In 2023, the Food Industry led, securing over 31% market share.
The Food Industry held a dominant market position in the By End-Use Industry segment of the Pneumatic Conveying Systems Market, capturing more than a 31% share. This sector’s leadership is driven by stringent hygiene standards and the need for efficient, contamination-free material handling solutions in processing and packaging operations, highlighting pneumatic systems’ critical role in ensuring product safety and operational efficiency.
The Pharmaceuticals sector, with its uncompromising requirements for cleanliness and precision in material handling, significantly relies on pneumatic conveying systems. Their ability to maintain product integrity and prevent contamination underlines the critical nature of these systems in drug manufacturing processes, supporting this industry’s robust demand.
The Automotive industry utilizes pneumatic conveying systems for the efficient handling of raw materials and components. Their role in streamlining production lines and reducing manual labor contributes to this sector’s operational efficiency and cost-effectiveness, underpinning the automotive industry’s investment in pneumatic technology.
In Mining equipment, pneumatic conveying systems are indispensable for the transport of raw extracted materials over long distances. Their durability and ability to handle abrasive materials make them a key component in minimizing operational downtime and enhancing productivity, marking their importance in the sector.
The Ceramic industry benefits from pneumatic conveying systems in handling fine powders and raw materials crucial for manufacturing processes. Their efficiency and the reduced risk of material loss or contamination are vital for maintaining product quality, driving the adoption of these systems in the industry.
Other end-user industries, including chemicals, plastics, and construction, leverage pneumatic conveying systems for their versatility in handling diverse materials. Their adaptability and the benefits of improved safety and efficiency facilitate broader market penetration, reflecting the extensive applicability of pneumatic conveying technologies across various sectors.
Key Market Segments
By Operating Principle
- Dilute Phase Conveying
- Dense Phase Conveying
By Technology
- Positive Pressure Systems
- Vacuum Systems
- Combination Systems
By End-Use Industry
- Food Industry
- Pharmaceuticals
- Automotive
- Mining
- Ceramic
- Other End-Use Industries
Growth Opportunities
Expansion of Recycling and Waste Treatment Industries
The recycling and waste treatment industries are experiencing substantial growth due to increasing global emphasis on sustainability and waste reduction. Pneumatic conveying systems play a crucial role in these industries by providing efficient, automated material handling solutions that are capable of dealing with various types of waste management materials.
Their ability to minimize human contact with potentially hazardous materials, coupled with their efficiency in transporting waste for recycling or disposal, positions these systems as essential components of modern waste management infrastructure. The expansion of these industries not only highlights the growing market demand for pneumatic conveying systems but also underscores the role of these systems in promoting environmental sustainability.
Growing Demand for Pneumatic Conveying Systems in the Oil and Gas Industry
The oil and gas industry’s need for highly reliable and efficient material handling solutions has led to an increased demand for pneumatic conveying systems. In this sector, the systems are primarily utilized for the safe and effective transportation of raw materials and byproducts, including powders and granules that are common in drilling and production processes.
The intrinsic safety features of pneumatic systems, which reduce the risk of explosions in potentially volatile environments, make them particularly suitable for the oil and gas industry. Furthermore, the ability of these systems to operate over long distances and in harsh conditions aligns with the operational requirements of the sector.
Global production of liquid fuels is expected to increase by 0.6 million b/d in 2024, slowing from the increase of almost 1.8 million b/d in 2023, indicating a continued, albeit moderated, demand for efficient and safe conveying systems in the oil and gas industry, thereby promising significant market opportunities.
Latest Trends
Growing Demand for Material Handling Equipment
The surge in demand for material handling equipment is a testament to the industrial sector’s ongoing pursuit of operational efficiency and productivity. Pneumatic conveying systems, known for their ability to transport a wide variety of materials safely and efficiently, are at the forefront of this demand.
Industries are increasingly leaning towards these systems to minimize manual handling, reduce material wastage, and enhance workplace safety. This trend is indicative of a broader move towards automation and the optimization of manufacturing and processing workflows, underpinning the pneumatic conveying systems market’s growth trajectory.
Increasing Investments in the Chemical and Pharmaceutical Industries
2023 has seen a marked increase in investments in the chemical and pharmaceutical industries, sectors that require stringent control over material handling processes to ensure safety, purity, and compliance with regulatory standards. Pneumatic conveying systems, with their enclosed design, provide an ideal solution for transporting sensitive materials without exposure to external contaminants. This capability is especially crucial in the pharmaceutical industry, where product integrity is paramount.
Moreover, the chemical sector’s need for handling corrosive, hazardous, or volatile materials safely aligns perfectly with the advantages offered by pneumatic systems. These investments not only highlight the critical role of pneumatic conveying in these industries but also underscore the market’s potential for further expansion as these sectors continue to grow.
Regional Analysis
Asia-Pacific dominates the Pneumatic Conveying Systems Market, holding a substantial share of 34.2%
The Pneumatic Conveying Systems Market exhibits distinctive dynamics across various regions, reflecting the diverse industrial landscapes and economic activities prevalent in each.
North America, with its mature industries and emphasis on automation, has been a strong market, leveraging advancements in technology to enhance operational efficiencies.
Europe follows closely, where stringent environmental and safety regulations drive the adoption of pneumatic conveying systems, particularly in the chemical and pharmaceutical sectors. Dominating the global scene,
Asia-Pacific commands a significant market share of 34.2%, propelled by rapid industrialization and expanding manufacturing sectors in countries like China and India. This region’s growth is further bolstered by increasing investments in infrastructure and a surge in demand for material-handling solutions.
The Middle East & Africa and Latin America, though smaller in comparison, are witnessing gradual growth, fueled by developing industries and increasing awareness of the benefits of pneumatic conveying systems. The market’s expansion in these regions is indicative of a broader global trend towards more efficient, safe, and environmentally friendly material handling solutions.

Key Regions and Countries
- North America
- The US
- Canada
- Mexico
- Western Europe
- Germany
- France
- The UK
- Spain
- Italy
- Portugal
- Ireland
- Austria
- Switzerland
- Benelux
- Nordic
- Rest of Western Europe
- Eastern Europe
- Russia
- Poland
- The Czech Republic
- Greece
- Rest of Eastern Europe
- APAC
- China
- Japan
- South Korea
- India
- Australia & New Zealand
- Indonesia
- Malaysia
- Philippines
- Singapore
- Thailand
- Vietnam
- Rest of APAC
- Latin America
- Brazil
- Colombia
- Chile
- Argentina
- Costa Rica
- Rest of Latin America
- Middle East & Africa
- Algeria
- Egypt
- Israel
- Kuwait
- Nigeria
- Saudi Arabia
- South Africa
- Turkey
- United Arab Emirates
- Rest of MEA
Key Players Analysis
In 2023, the global Pneumatic Conveying Systems Market is characterized by the presence of several key players, each contributing to the industry’s competitive dynamics and technological advancements.
Atlas Copco AB stands out for its comprehensive range of pneumatic conveying solutions, catering to a broad spectrum of industries with its innovative and energy-efficient systems. Cyclonaire Corporation has carved a niche for itself by offering custom-engineered pneumatic conveying solutions that address specific industry challenges, emphasizing versatility and adaptability.
Coperion GmbH, renowned for its precision and quality, continues to drive the market with its high-performance conveying systems, particularly favored in the plastics and chemical sectors. Dongyang P & F and Flexicon Corporation are pivotal in advancing material handling solutions, with Flexicon focusing on bulk handling equipment that ensures operational safety and efficiency.
Dynamic Air Inc., Gericke AG, and VAC-U-MAX are recognized for their robust and reliable systems, catering to the nuanced needs of the food, pharmaceutical, and industrial markets. Their commitment to quality and innovation has been instrumental in addressing complex material handling requirements.
Nol-Tec Systems Inc. and Schenck Process Holding GmbH, with their global presence, have been influential in shaping the pneumatic conveying systems landscape, offering a blend of technology and customization that meets global standards.
Other Key Players in the market contribute to its diversity and resilience, bringing specialized solutions that cater to niche markets and unique applications. The collective efforts of these companies underscore the market’s growth trajectory, driven by technological innovation, emphasis on sustainability, and the increasing demand for efficient material handling solutions across industries.
Market Key Players
- Atlas Copco AB
- Cyclonaire Corporation
- Coperion GmbH
- Dongyang P & F
- Flexicon Corporation
- Dynamic Air Inc.
- Gericke AG
- VAC-U-MAX
- Nol-Tec Systems Inc.
- Schenck Process Holding GmbH
- Other Key Players
Recent Development
- In May 2023, Inter FoodTech & Pac MechEx, a key event for the food and beverage industry, is set to showcase innovative RTE and RTC food processing technologies, promising enhanced networking and business growth opportunities.
- In March 2023, Volkmann USA introduced the VS pneumatic vacuum conveying system, designed to reduce waste by reclaiming unused ingredients, enhancing financial savings, and improving plant sanitation for various manufacturing sectors.
Report Scope
| Report Features | Description |
|---|---|
| Market Value (2023) | USD 6.1 Billion |
| Forecast Revenue (2033) | USD 10.5 Billion |
| CAGR (2024-2033) | 5.60% |
| Base Year for Estimation | 2023 |
| Historic Period | 2018-2023 |
| Forecast Period | 2024-2033 |
| Report Coverage | Revenue Forecast, Market Dynamics, Competitive Landscape, Recent Developments |
| Segments Covered | By Operating Principle(Dilute Phase Conveying, Dense Phase Conveying), By Technology(Positive Pressure Systems, Vacuum Systems, Combination Systems), By End-Use Industry(Food Industry, Pharmaceuticals, Automotive, Mining , Ceramic, Other End-Use Industries) |
| Regional Analysis | North America – The US, Canada, & Mexico; Western Europe – Germany, France, The UK, Spain, Italy, Portugal, Ireland, Austria, Switzerland, Benelux, Nordic, & Rest of Western Europe; Eastern Europe – Russia, Poland, The Czech Republic, Greece, & Rest of Eastern Europe; APAC – China, Japan, South Korea, India, Australia & New Zealand, Indonesia, Malaysia, Philippines, Singapore, Thailand, Vietnam, & Rest of APAC; Latin America – Brazil, Colombia, Chile, Argentina, Costa Rica, & Rest of Latin America; Middle East & Africa – Algeria, Egypt, Israel, Kuwait, Nigeria, Saudi Arabia, South Africa, Turkey, United Arab Emirates, & Rest of MEA |
| Competitive Landscape | Atlas Copco AB, Cyclonaire Corporation, Coperion GmbH, Dongyang P & F, Flexicon Corporation, Dynamic Air Inc., Gericke AG, VAC-U-MAX, Nol-Tec Systems Inc., Schenck Process Holding GmbH, Other Key Players |
| Customization Scope | Customization for segments, region/country-level will be provided. Moreover, additional customization can be done based on the requirements. |
| Purchase Options | We have three licenses to opt for: Single User License, Multi-User License (Up to 5 Users), Corporate Use License (Unlimited User and Printable PDF) |
Frequently Asked Questions (FAQ)
The Global Pneumatic Conveying Systems Market size is expected to be worth around USD 10.5 Billion by 2033, from USD 6.1 Billion in 2023, growing at a CAGR of 5.60% during the forecast period from 2024 to 2033.
Atlas Copco AB, Cyclonaire Corporation, Coperion GmbH, Dongyang P & F, Flexicon Corporation, Dynamic Air Inc., Gericke AG, VAC-U-MAX, Nol-Tec Systems Inc., Schenck Process Holding GmbH, Other Key Players
List the segments encompassed in this report on the Pneumatic Conveying Systems Market Market.US has segmented the Pneumatic Conveying Systems Market by geographic (North America, Europe, APAC, South America, and Middle East and Africa, (Dilute Phase Conveying, Dense Phase Conveying), By Technology(Positive Pressure Systems, Vacuum Systems, Combination Systems), By End-Use Industry(Food Industry, Pharmaceuticals, Automotive, Mining , Ceramic, Other End-Use Industries)
APAC accounted for the highest revenue share of 34.2%. Therefore, the Pneumatic Conveying Systems industry in APAC is expected to garner significant business opportunities over the forecast period.
Key factors that are driving the pneumatic conveying systems market growth include a Growing Demand for Advanced and Energy-Efficient Pneumatic Conveying Systems, Increasing Demand from the Food and Beverage Industry.


