
Quick Navigation
Report Overview
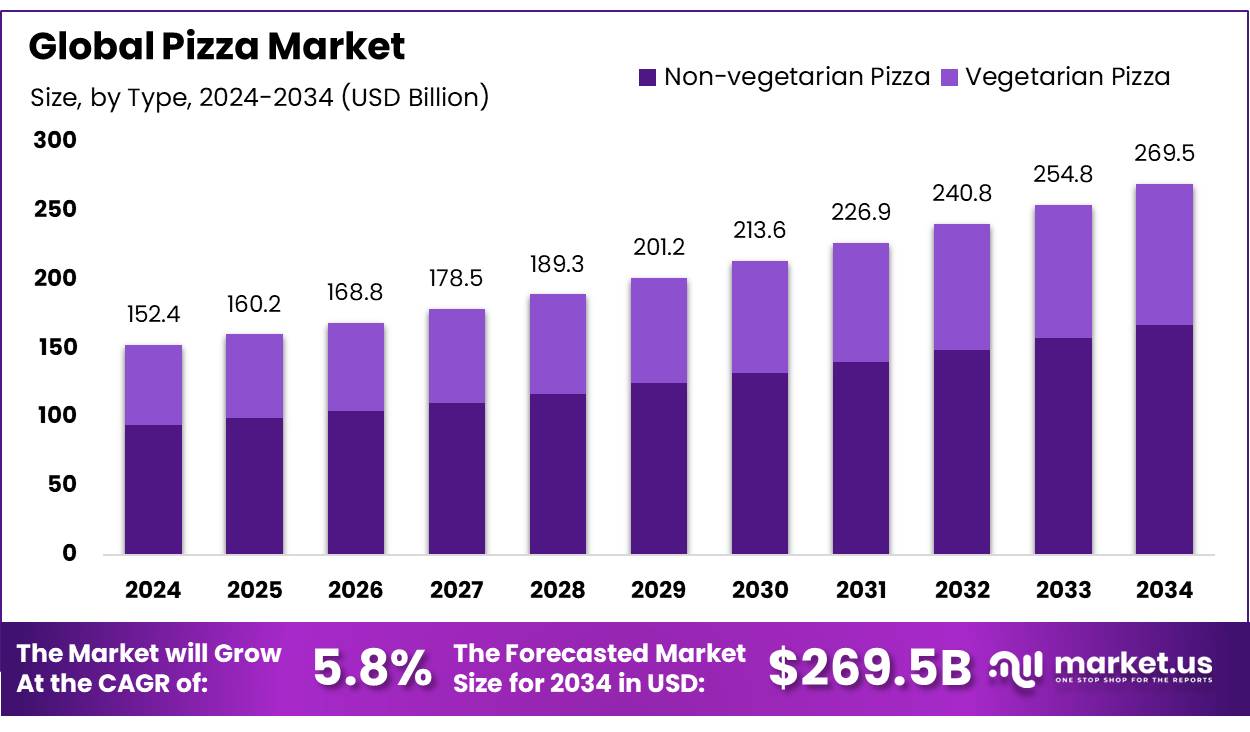
The Global Pizza Market size is expected to be worth around USD 269.5 Billion by 2034, from USD 152.4 Billion in 2024, growing at a CAGR of 5.8% during the forecast period from 2025 to 2034.
The pizza market is a dynamic and ever-evolving industry that has captured individuals’ significant attention and taste buds worldwide. Pizza, with its origins tracing back to ancient civilizations, has undergone a remarkable transformation over the years to become one of the world’s most beloved and versatile foods.
In recent decades, the pizza market has experienced significant growth, driven by factors such as globalization, changing consumer preferences, and the rise of the fast-food industry. The global pizza market is on an upward growth trajectory, driven by strong demand, particularly in North America, and innovative market strategies that cater to changing consumer tastes and preferences.
Key Takeaways
- The global pizza market will be valued at USD 152.4 billion in 2024.
- The global pizza market is projected to reach USD 269.5 billion by 2033.
- Among types, non-vegetarian pizza accounted for the largest market share of 62.0%.
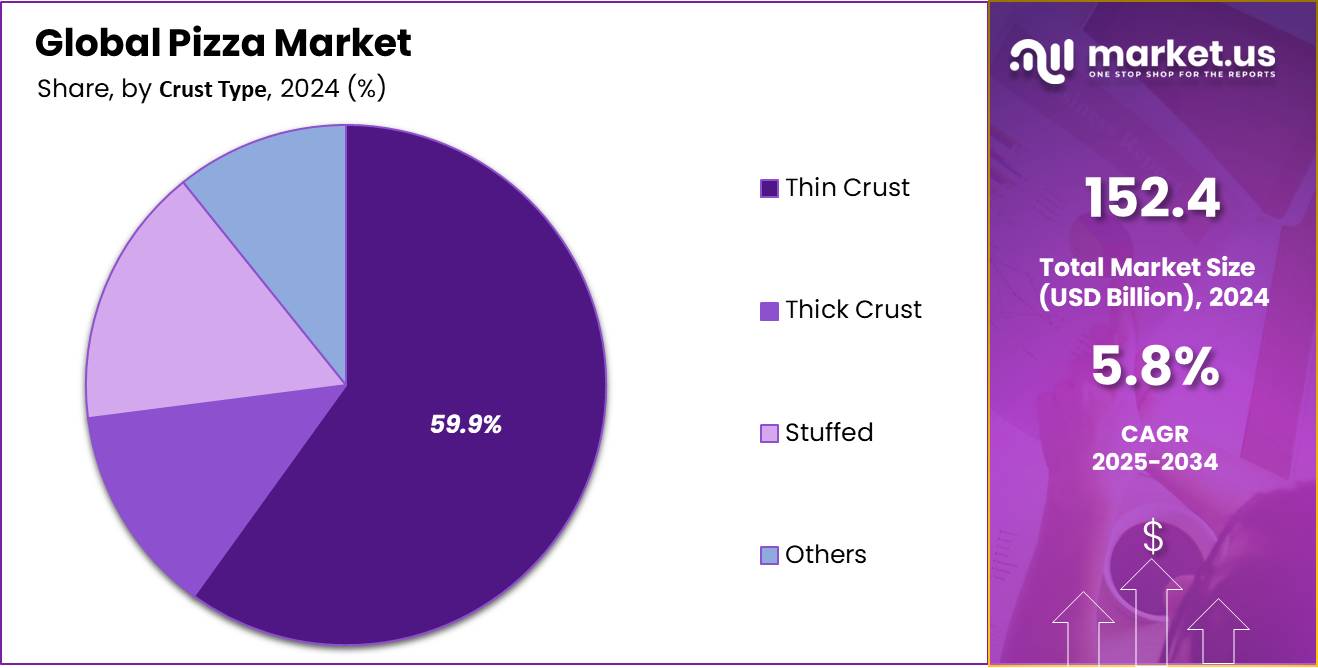
- Among crust types, thin crust type Pizza accounted for the majority of the market share with 59.9%.
- Based on toppings, meat-based toppings are expected to account for the largest market share in 2024 with 59.4%.
- Among pizza sizes, the large-sized pizza is more popular among consumers, and thus, it holds a 56.0% revenue share.
- Based on the distribution channel, the Quick Service Restaurants (QSR) segment is anticipated to account market share of 67.7%.
- Consumers between 25 and 44 years dominated the market by consumer type segment with a market share of 45.6%.
- There are more than 245,000 pizza restaurants worldwide. This extensive global presence reflects the popularity and widespread acceptance of pizza as a favored fast-food choice, contributing to the overall growth of the global pizza market.
- On average, Americans consume about 46 slices of pizza annually, which adds up to about 23 pounds of pizza eaten annually. Estimates put the number of pizza slices sold each second at 350, which comes out to about 21,000 per minute.
Type Analysis
Non-Vegetarian Pizza Accounted for The Largest Market Share Owing to Their Higher Popularity
The global pizza market is segmented based on type into non-vegetarian pizza and vegetarian pizza. Among both, non-vegetarian pizza holds the majority of the revenue share of 62.0% in 2024. This can be attributed to several factors popular preference for meat toppings.
In several regions, especially in Western countries, there is a strong preference for meat toppings on pizzas. Favorites such as pepperoni, sausage, ham, and bacon are staple choices for a large segment of pizza consumers. This popularity drives higher sales of non-vegetarian pizzas. Consumers often perceive meat toppings as adding more value to a pizza than vegetarian options. This perception can lead to a willingness to pay a higher price for non-vegetarian pizzas, thereby contributing more to the revenue.
Global Pizza Market, By Type, 2020-2024 (USD Mn)
| Type | 2020 | 2021 | 2022 | 2023 | 2024 |
|---|---|---|---|---|---|
| Non-Veg | 80,195.2 | 83,165.3 | 86,457.8 | 90,130.7 | 94,371.0 |
| Veg | 48,276.6 | 50,296.7 | 52,586.2 | 55,134.4 | 58,051.0 |
Crust Type Analysis
Owing to Their Crisp Texture, Thin Crust Pizzas Are Preferred Over Other Crust Types
The market is segregated into thin crust, thick crust, stuffed, and others based on a crust type. Among these the thin crust type pizza is more popular and thus accounted for the majority of market share of 59.9% in 2024. Thin-crust pizza is favored for its crisp texture, which several individuals find appealing. The thinner base also makes the flavors of the toppings and sauce more pronounced, making the overall taste experience more about the toppings than the dough.
Thin crust pizza is often perceived as a healthier choice compared to thicker crusts such as deep-dish or pan pizza. As global food trends lean towards lighter, more artisanal, and authentic dining experiences, thin-crust pizza aligns well with these preferences. It is often seen in upscale restaurants and artisanal pizzerias, which have gained popularity worldwide.
Global Pizza Market, By Crust Type, 2020-2024 (USD Mn)
| Crust Type | 2020 | 2021 | 2022 | 2023 | 2024 |
|---|---|---|---|---|---|
| Thin Crust | 76,718.8 | 79,786.3 | 83,196.0 | 86,992.8 | 91,358.0 |
| Thick Crust | 17,119.4 | 17,689.7 | 18,324.2 | 19,034.6 | 19,859.6 |
| Stuffed | 20,671.3 | 21,523.8 | 22,490.6 | 23,566.8 | 24,799.2 |
| Others | 13,962.4 | 14,462.3 | 15,033.2 | 15,670.8 | 16,405.1 |
Toppings Analysis
The Demand for Meat Based Toppings is Boosting Owing to the Availability of Variety of Options
The market is further divided into meat, vegetables, cheese, and others based on toppings. Among these, meat toppings accounted for the largest market share in 2024, with 59.4%. Meat toppings such as pepperoni, sausage, ham, bacon, and chicken are widely favored among pizza consumers.
These toppings have become almost synonymous with pizza in several cultures, especially in Western countries where the demand for meat-topped pizzas is particularly high. Strong marketing and promotional strategies by pizza chains often highlight meat-topped pizzas. These marketing efforts can influence consumer choices, making meat toppings more popular.
Global Pizza Market, By Toppings, 2020-2024 (USD Mn)
| Toppings | 2020 | 2021 | 2022 | 2023 | 2024 |
|---|---|---|---|---|---|
| Meat | 75,963.5 | 78,991.4 | 82,373.4 | 86,156.0 | 90,511.0 |
| Vegetables | 28,631.9 | 29,857.7 | 31,245.6 | 32,789.8 | 34,556.0 |
| Cheese | 19,179.5 | 19,796.9 | 20,484.8 | 21,255.8 | 22,152.9 |
| Others | 4,697.0 | 4,816.0 | 4,940.1 | 5,063.4 | 5,202.0 |
Size Analysis
Larger Pizzas Can Accommodate More or A Variety of Toppings, Catering to Diverse Taste References Within a Group; hence, They Are Anticipated to Hold the Majority of Revenue Share.
Based on size global pizza market is segmented into regular, large, and extra-large. Among these, large-size pizza is more popular and holds the majority of the market share at 56.0%. The popularity and market dominance of large-sized pizzas over regular and extra-large sizes can be attributed to several factors. Large pizzas often provide a better value for money.
They typically have a lower cost per square inch compared to smaller sizes, making them more economical, especially for groups or families. This perception of getting more for less can drive consumer preference toward larger pizza sizes.
Global Pizza Market, By Size, 2020-2024 (USD Mn)
| Size | 2020 | 2021 | 2022 | 2023 | 2024 |
|---|---|---|---|---|---|
| Regular | 36,404.3 | 37,747.7 | 39,279.5 | 40,988.8 | 42,954.7 |
| Large | 71,615.5 | 74,418.8 | 77,581.6 | 81,187.4 | 85,379.7 |
| Extra-large | 20,452.1 | 21,295.5 | 22,183.0 | 23,088.9 | 24,087.4 |
Distribution Channel Analysis
Quick Service Restaurants (QSRs) Account for The Majority Of The Revenue Share In The Pizza Market Primarily Due To Their Fast Service, Convenience, Affordability, And Widespread Accessibility.
The market is segregated into Quick Service Restaurants (QSR), Full-Service Restaurants (FSR), and others based on distribution channels. Among these, Quick Service Restaurants (QSR) accounted for the majority of revenue share of 67.7%. The dominance of QSRs indicates that consumers highly value convenience and speed in their dining choices. QSRs typically offer fast service, takeout, and delivery options, which align well with the fast-paced lifestyle of many customers.
Moreover, QSRs generally have a pricing advantage over FSRs. They often offer more budget-friendly options, which can be crucial in attracting a larger customer base, especially in cost-sensitive markets. In addition, QSRs are known for their adaptability in terms of menu offerings and embracing technology for order taking and delivery. This agility may contribute to their larger market share as they can quickly respond to changing consumer preferences.
Global Pizza Market, By Distribution Channel, 2020-2024 (USD Mn)
| Distribution Channel | 2020 | 2021 | 2022 | 2023 | 2024 |
|---|---|---|---|---|---|
| Quick service Restaurants (QSR) | 85,364.4 | 89,049.6 | 93,188.9 | 97,815.6 | 103,122.4 |
| Full-service Restaurants (FSR) | 36,100.6 | 37,179.7 | 38,386.2 | 39,742.9 | 41,329.0 |
| Others | 7,006.9 | 7,232.7 | 7,468.9 | 7,706.7 | 7,970.5 |
Consumer Type Analysis
Owing To The Combination Of Disposable Income, Digital Engagement, and Diverse Taste Preferences Of, Consumers Between 25 And 44 Years Are More DominantBased on consumer type, the market is divided into consumers under 25 years, between 25 and 44 years, and above 45 years. Among these, consumers between 25 and 44 years old are major end users in the pizza market, with a revenue share of 45.6% in 2024. Individuals in this age group generally have more disposable income compared to those under 25, who might still be in education or early in their career paths.
They are more established in their careers and have more financial freedom to spend on eating out or ordering in, including buying pizzas. This age group often leads a fast-paced and busy lifestyle, balancing work and family commitments. Pizza, being a convenient and quick meal option, fits well into their lifestyle. The combination of disposable income, convenience, family dynamics, digital engagement, diverse taste preferences, social habits, and health-conscious trends makes consumers between 25 and 44 years old a key demographic in the pizza market.
Global Pizza Market, By Consumer Type, 2020-2024 (USD Mn)
| Consumer Type | 2020 | 2021 | 2022 | 2023 | 2024 |
|---|---|---|---|---|---|
| Consumers Under 25 Years | 24,542.1 | 25,745.2 | 27,101.7 | 28,609.4 | 30,328.0 |
| Consumers Between 25 and 44 Years | 59,803.0 | 61,994.7 | 64,273.4 | 66,654.4 | 69,485.6 |
| Consumers Above 45 Years | 44,126.7 | 45,722.2 | 47,668.9 | 50,001.3 | 52,608.3 |
Key Market Segments
By Type
- Non-vegetarian Pizza
- Vegetarian Pizza
By Crust Type
- Thin Crust
- Thick Crust
- Stuffed
- Other Crust Types
By Toppings
- Meat
- Vegetables
- Cheese
- Other Toppings
By Size
- Regular
- Large
- Extra-large
By Distribution Channel
- Quick Service Restaurants (QSR)
- Full-Service Restaurants (FSR)
- Other Distribution Channels
By Consumer Type
- Consumers Under 25 Years
- Consumers Between 25 and 44 Years
- Consumers Above 45 Years
Drivers
Rising Digitalization and Online Delivery Services Driving the Global Pizza Market Growth
Digitalization has seen large invest in user-friendly websites and mobile applications. These platforms offer customers a seamless ordering experience. They can easily browse menus, select toppings, and place orders from the comfort of their homes or on the go. The convenience of being able to order pizza with just a few clicks or taps has significantly boosted sales for pizza businesses. Third-party food delivery platforms have emerged as major players in the pizza industry.
These apps act as intermediaries, connecting consumers with various restaurants, including pizza places. For pizzerias, partnering with these platforms extends their reach to a broader customer base, tapping into the growing trend of ordering food online. The COVID-19 pandemic accelerated the adoption of contactless ordering and payment methods. Customers increasingly prefer touchless transactions. Pizzerias responded by offering options for online payment and contactless delivery.
This ensured safety during the pandemic and aligned with changing consumer preferences for minimal physical contact. Pizzerias thrive on positive reviews and high ratings, which can significantly impact their reputation and trustworthiness. These platforms serve as a valuable source of feedback for both customers and businesses.
Expansion of Franchises Worldwide Driving the Global Pizza Market Growth
Franchise expansion generates employment opportunities within local communities. Each new franchise location typically hires staff for various roles, from cooks to delivery drivers. This job creation contributes to economic growth and stimulates local economies. As more franchises open, more job opportunities are created, which, in turn, bolsters the market’s growth.
Franchising gives aspiring entrepreneurs and investors a turnkey business opportunity under an established brand. This lowers the barriers to entry into the restaurant industry and encourages individuals to invest in pizza franchises. As more entrepreneurs join the network, franchise locations increase, thereby driving market growth.
- In the United States alone, there are approximately 77,000 pizza restaurants. The significant number of pizza establishments in the U.S. underscores the strong demand for pizza, which plays a pivotal role in the growth of the global pizza industry.
- The number of independent pizzerias increased from 41,573 to 41,879. The growth of independent pizzerias showcases the entrepreneurial opportunities within the pizza market, contributing to its expansion as local entrepreneurs embrace the pizza business.
Restraints
Fluctuations in Ingredients Costs Restrain the Market Growth
Cheese, particularly mozzarella, is a fundamental ingredient in pizza. It’s often the costliest ingredient, and its prices can be subject to fluctuations due to factors like changes in dairy production, global demand, and natural disasters affecting dairy farms. When cheese prices rise, it directly impacts the cost of making pizzas, squeezing profit margins for pizzerias.
This, in turn, can lead to the need for price adjustments, potentially driving away cost-sensitive customers. The price of wheat and other grains used in pizza dough can also vary due to factors such as weather conditions, crop yields, and global commodity markets. Pizzerias depend on a steady and affordable supply of flour and other dough ingredients. When these costs increase, they add to the overall production expenses.
Tomatoes, in the form of sauces and toppings, are essential for making pizza. Weather-related crop failures, transportation costs, and import tariffs can influence the cost of tomatoes and tomato-based products. Any increase in these costs can lead to higher expenses for pizzerias. Beyond the core ingredients, pizzerias rely on various toppings and ingredients like meats, vegetables, and herbs.
The availability and prices of these toppings can be affected by factors such as seasonal variations, supply chain disruptions, and agricultural factors. Fluctuations in the cost of toppings can force pizzerias to adjust their menu offerings and pricing. Rising ingredient costs affect the cost of goods sold and drive up operational expenses. Pizzerias must invest in inventory management systems, negotiate with suppliers, or adapt their menu offerings to mitigate the impact of fluctuating ingredient prices.
Opportunity
Increasing Demand for Convenience Foods Expected to Create Lucrative Growth Opportunities in the Pizza Market
Increased work demands, longer commutes, and a desire for convenience characterize the modern lifestyle. As a result, people are seeking food options that require minimal time and effort to prepare. Ready-to-eat meals, pre-cut vegetables, and microwaveable dishes cater to this need, making them highly appealing to busy individuals and families. The ongoing trend of urbanization has led to smaller living spaces and an emphasis on convenience. Urban dwellers, especially in high-cost cities, often have compact kitchens or no cooking facilities at all. This makes convenience foods, such as frozen pizzas, pre-packaged salads, and takeout meals, essential for their daily sustenance.
In a fast-paced world, time efficiency is crucial. Consumers are looking for ways to streamline their daily routines, which extends to meal preparation. Convenience foods, such as pre-marinated meats, pre-chopped vegetables, and one-pot meal kits, help individuals save time while enjoying home-cooked flavors. Whether due to work commitments or a preference for a mobile lifestyle, many people consume meals on the go.
Portable convenience foods, such as wraps, energy bars, and protein shakes, have become staples for those who eat while commuting, traveling, or simply juggling a busy day. The advent of food delivery services and apps has revolutionized the way people access ready-made meals. Consumers can now order restaurant-quality food from the comfort of their homes, from pizzas and burgers to gourmet cuisine. This convenience-driven market caters to those who desire high-quality meals without the effort of dining out.
Trends
Preference for Gluten-Free Pizza is on Rise
As health awareness grows, more consumers seek alternatives to traditional wheat-based products. Gluten-free pizza caters to individuals who want to reduce their gluten intake or have specific dietary restrictions. Celiac disease is an autoimmune disorder triggered by the consumption of gluten. With increased awareness of this condition, there is a greater need for gluten-free food options, including pizza, to accommodate individuals with celiac disease.
The food industry has responded to this demand by offering a wider variety of gluten-free products, including pizza crusts made from alternative flours such as rice, almonds, tapioca, or cauliflower. This expansion has allowed consumers more choices in both restaurants and grocery stores. With the rise of vegetarian, vegan, and other specialty diets, offering gluten-free options aligns with the broader trend of providing diverse menu choices to accommodate different dietary needs and preferences.
Geopolitical Impact Analysis
Geopolitical Tensions Significantly Disrupted the Growth of the Pizza Market Owing to Fluctuations in Currency and Supply Chain Activities
Geopolitical tensions can disrupt the supply chain of essential ingredients used in pizza-making, such as wheat (for dough), tomatoes (for sauce), and cheese. Conflicts or trade disputes in key producing regions can affect the availability and cost of these ingredients, impacting pizza prices globally.
Geopolitical events often lead to significant currency fluctuations. For instance, if the currency of a major pizza ingredient exporting country weakens, it may lower the cost of importing those ingredients, benefiting pizza markets in other countries. Conversely, a stronger currency can make imports more expensive, affecting prices. Geopolitical tensions can influence consumer behavior. For example, individuals might opt for more affordable dining options in times of uncertainty or economic hardship, potentially boosting the pizza market.
Alternatively, consumer boycotts against products from specific countries for geopolitical reasons can negatively impact the market. Geopolitical events can lead to new regulations impacting the food industry. For instance, stricter food safety laws in response to international health concerns can increase production costs for pizza manufacturers.
Geopolitical tensions can affect labor markets, influencing wages and labor availability in the food sector, including pizza production and distribution. A complex web of geopolitical factors influences the global pizza market, ranging from supply chain dynamics and trade policies to consumer behavior and cultural exchanges. These factors can either pose challenges or create opportunities for the pizza industry in different parts of the world.
Regional Analysis
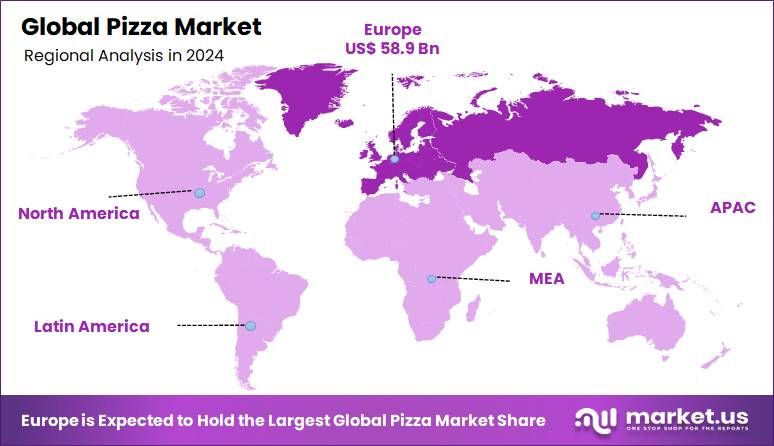
Europe is Estimated to be the Most Lucrative Market in the Global Pizza Market.
Europe holds the largest market share, with 39.1% in pizza in 2024. Pizza, originating in Italy, has a strong cultural presence in Europe. This cultural affinity contributes to a high demand for pizza across European countries. The rich tradition of pizza-making and consumption in countries such as Italy and others in the region supports a well-established market. Europe offers various pizza varieties, from traditional Italian pizzas to localized versions in different countries. This diversity appeals to a broad spectrum of tastes and preferences, enhancing the market’s attractiveness.
Europe benefits from well-established supply chains for key pizza ingredients, such as cheese, tomatoes, and wheat. Proximity to these raw materials reduces costs and ensures freshness, contributing to higher-quality products. Several European countries have relatively high disposable incomes, translating to a greater willingness to spend on dining out and premium pizza products. This economic factor is crucial in making Europe a lucrative market.
After Europe, Pizza is incredibly popular in North America as well. It’s a staple in the American diet, with a significant portion of the population consuming pizza regularly. This high consumption rate directly translates into a robust market for pizza. The region has a dense network of pizza restaurants and fast-food chains, ranging from large, well-known brands to local pizzerias. This extensive network makes pizza easily accessible to a large number of consumers. The region boasts a highly efficient supply chain for food products, ensuring the steady availability of ingredients and materials required for pizza making. This supports the growth and profitability of the pizza market.
Global Pizza Market, By Region, 2020-2024 (USD Mn)
| Regional Analysis | 2020 | 2021 | 2022 | 2023 | 2024 |
|---|---|---|---|---|---|
| North America | 47,193.7 | 48,945.6 | 50,897.4 | 53,064.2 | 55,551.3 |
| Europe | 51,951.9 | 53,380.6 | 54,997.6 | 56,813.0 | 58,933.9 |
| Asia Pacific | 13,206.5 | 14,147.4 | 15,197.4 | 16,369.4 | 17,705.4 |
| Middle East & Africa | 3,981.4 | 4,164.2 | 4,367.1 | 4,591.7 | 4,847.6 |
| Latin America | 12,138.3 | 12,824.2 | 13,584.5 | 14,426.8 | 15,383.6 |
Key Regions and Countries
- North America
- The US
- Canada
- Europe
-
- Germany
- France
- The UK
- Spain
- Italy
- Russia & CIS
- Rest of Europe
-
- APAC
- China
- Japan
- South Korea
- India
- ASEAN
- Rest of APAC
- Latin America
- Brazil
- Mexico
- Rest of Latin America
- Middle East & Africa
- GCC
- South Africa
- Rest of MEA
Key Players Analysis
Strong Focus On Product Portfolio Expansion Through Various Strategies. Maintain the Dominance of Industry Leaders
Companies in the pizza market are employing various strategies and techniques to dominate the industry. These strategies are diverse and often tailored to each business’s unique strengths and opportunities.
Pizzerias are focusing on Search Engine Optimization (SEO) to improve their visibility in Google searches. This strategy is crucial because it ensures that a pizzeria appears at the right place and time when customers are actively looking to order food online.
Market Key Players
- Yum! Brands Inc.
- Domino’s Pizza, Inc.
- Papa John’s International, Inc.
- Little Caesar Enterprises, Inc.
- Papa Murphy’s International
- California Pizza Kitchen
- Hungry Howie’s Pizza & Subs, Inc.
- MOD Super-Fast Pizza Holdings, LLC
- Mellow Mushroom
- Marco’s Pizza
- Sbarro, LLC
- Other Key Players
Recent Development
- In June 2024, Papa John’s International acquired Drake Food Service International’s restaurants in the United Kingdom. The acquisition provides Papa John’s International with 91 corporate-owned restaurant locations across London and other parts of the UK.
- In June 2024, Pizza Hut announced its newest culinary creation: The Pickle Pizza. Building on the recent resurgence of pickles, Pizza Hut has taken this trend to new heights with its twist on the pickle phenomenon by adding sour, tangy food as a pizza topping.
- In April 2024, Papa John’s announced an expanded partnership with PJP Investments Group to open 650 new restaurants in India by 2033, starting with a restaurant in Bangalore in 2024.
- In January 2022, Pizza Hut, known for pioneering iconic pizzas like the Original Stuffed Crust and Original Pan pizza, brought the heat to the masses with one of its biggest bets of the year: Spicy Lover’s Pizza. The new Spicy Lover’s Pizza joins Meat Lover’s, Pepperoni Lover’s, and Veggie Lover’s to round out the fan-favorite Lover’s line of specialty recipes.
- In December 2022, Domino’s Pizza, Inc. started its operations in Latvia and Uruguay.
Report Scope
| Report Features | Description |
|---|---|
| Market Value (2024) | USD 152.4 Bn |
| Forecast Revenue (2034) | USD 269.5 Bn |
| CAGR (2024-2034) | 5.8% |
| Base Year for Estimation | 2024 |
| Historic Period | 2020-2023 |
| Forecast Period | 2025-2034 |
| Report Coverage | Revenue Forecast, Market Dynamics, Competitive Landscape, Recent Developments |
| Segments Covered | Type (Non-vegetarian Pizza and Vegetarian Pizza), By Crust Type (Thin Crust, Thick Crust, Stuffed, and Other Crust Types), By Toppings (Meat, Vegetables, Cheese, and Other Toppings) By Size (Regular, Large, and Extra-large) By Distribution Channel (Quick Service Restaurants (QSR), Full-service Restaurants (FSR), and Other Distribution Channels), By Consumer Type (Consumers Under 25 Years, Consumers Between 25 and 44 Years, and Consumers Above 45 Years) |
| Regional Analysis | North America – The US & Canada; Europe – Germany, France, The UK, Spain, Italy, Russia & CIS, Rest of Europe; APAC– China, Japan, South Korea, India, ASEAN & Rest of APAC; Latin America– Brazil, Mexico & Rest of Latin America; Middle East & Africa– GCC, South Africa, & Rest of MEA |
| Competitive Landscape | Yum! Brands Inc., Domino’s Pizza, Inc., Papa John’s International, Inc., Little Caesar Enterprises, Inc., Papa Murphy’s International, California Pizza Kitchen, Hungry Howie’s Pizza & Subs, Inc., MOD Super-Fast Pizza Holdings, LLC, Mellow Mushroom, Marco’s Pizza, Sbarro, LLC, Other Key Players |
| Customization Scope | Customization for segments, region/country-level will be provided. Moreover, additional customization can be done based on the requirements. |
| Purchase Options | We have three licenses to opt for: Single User License, Multi-User License (Up to 5 Users), Corporate Use License (Unlimited User and Printable PDF) |


