


Report Overview
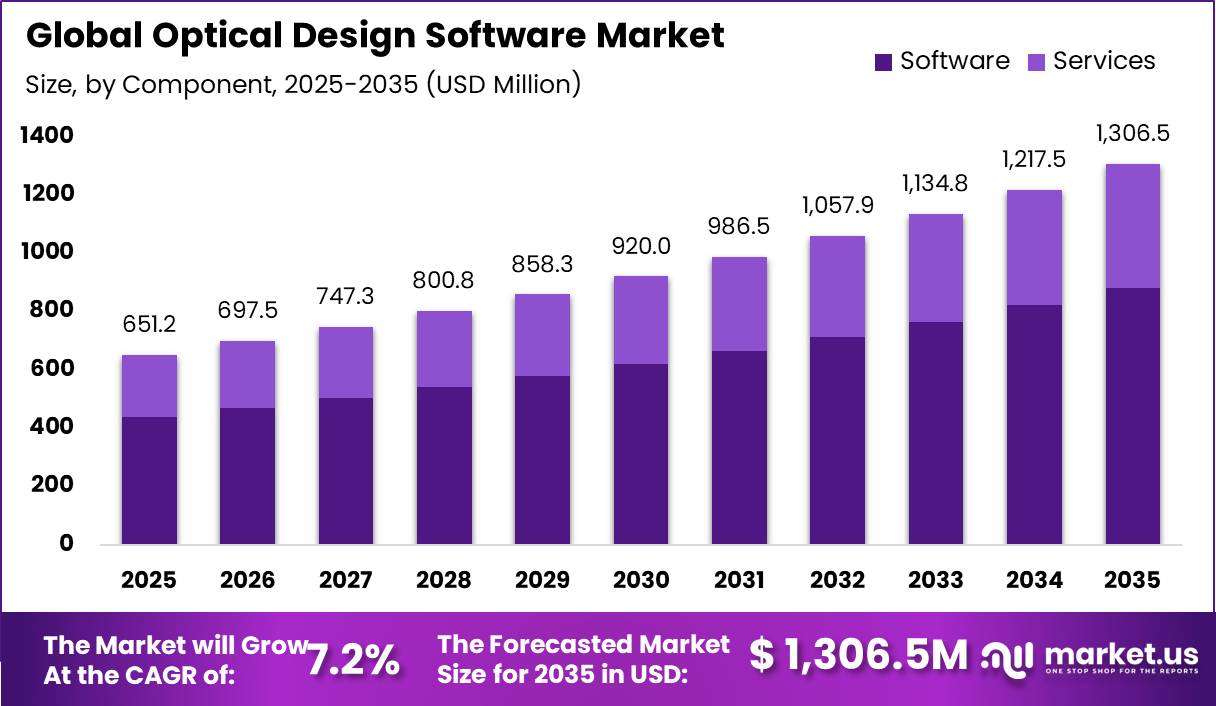
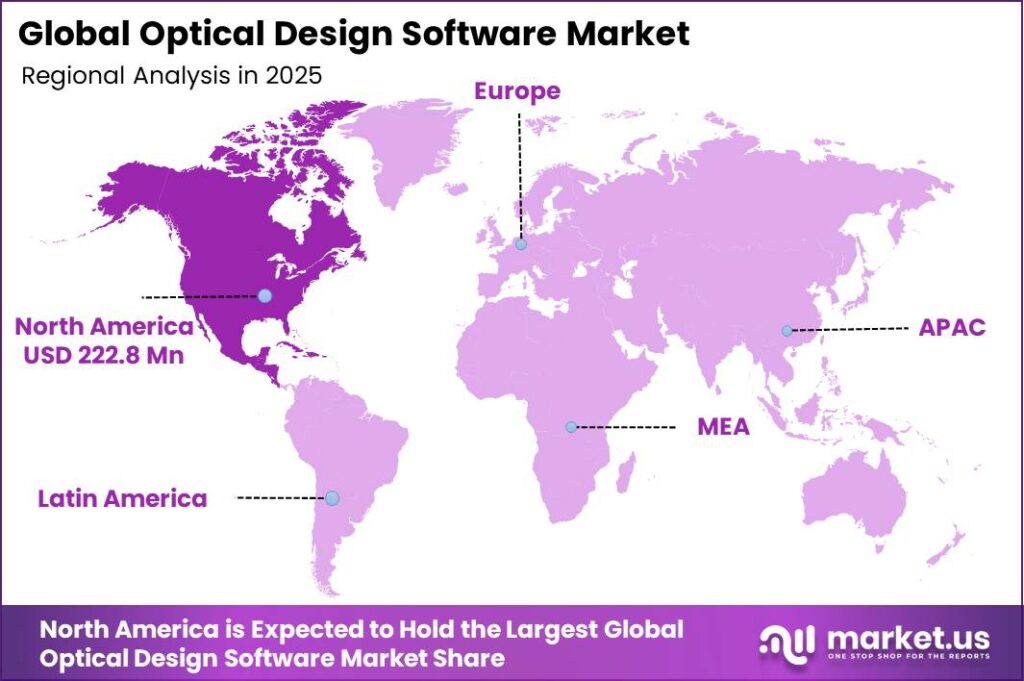
In 2025, the Global Optical Design Software Market was valued at USD 651.2 million. The market is projected to grow at a CAGR of 7.2% from 2026 to 2035, reaching approximately USD 1,306.5 million by 2035. North America dominated the global market in 2025, accounting for more than 34.21% of the total market share.
This market growth is being driven by the rapid expansion of AI data centres and semiconductor manufacturing. According to the International Energy Agency (IEA), global data centre electricity consumption reached 415 TWh in 2024 and is expected to increase to 945 TWh by 2030, growing by around 15% annually. This rapid expansion is increasing demand for silicon photonics, optical interconnects, and photonic chips, all of which rely on advanced optical design and simulation software during development.
The Semiconductor Industry Association (SIA) reports that the U.S. CHIPS and Science Act has supported more than USD 640 billion in semiconductor supply chain investments, while Micron has announced up to USD 200 billion in U.S. manufacturing expansion, as confirmed by NIST. These investments are creating long-term demand for optical design software used in chip packaging, waveguide design, and laser integration.
The IEEE Photonics Society also reported a record 17,000 participants from 83 countries at its 2025 flagship conference, highlighting rising global research activity in photonics. Furthermore, WIPO’s World Intellectual Property Indicators 2025 reported 3.7 million patent applications filed worldwide in 2024, up 4.9% from 2023, reflecting growing innovation in photonics, optoelectronics, and optical systems.
Key Takeaways
- In 2025, the Global Optical Design Software Market was valued at USD 651.2 million and is projected to reach USD 1,306.5 million by 2035, expanding at a CAGR of 7.2% during the forecast period from 2026 to 2035.
- By component, the software segment led the market with a 67.45% share in 2025, driven by increasing demand for advanced optical simulation and design solutions.
- By application, the imaging systems design segment held the largest market share of 28.67% in 2025, owing to its extensive use in camera systems, medical imaging, and industrial optics.
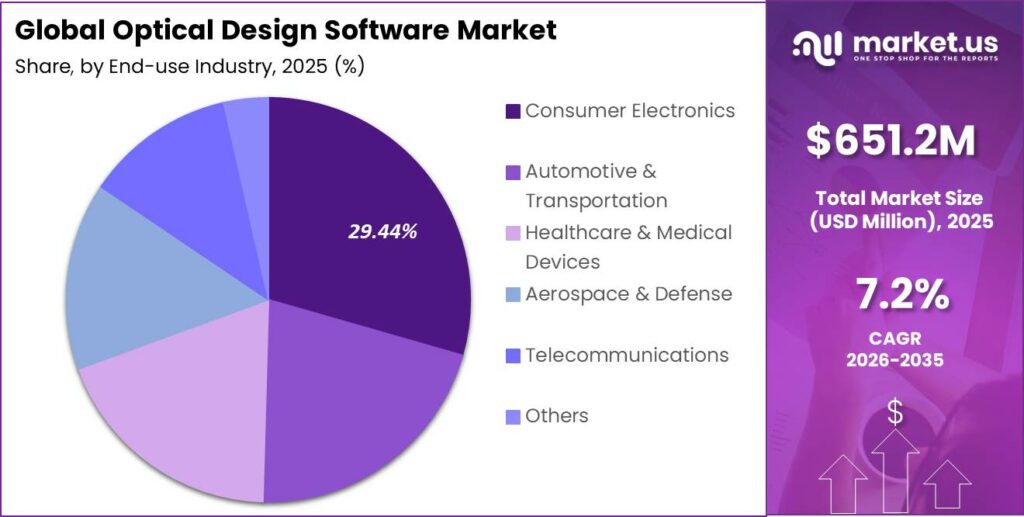
- By end-use industry, the consumer electronics segment accounted for the largest market share of 29.44% in 2025, supported by growing demand for smartphones, AR/VR devices, wearable electronics, and advanced optical sensors.
- North America dominated the global market in 2025, accounting for more than 34.21% of the total market revenue, supported by the strong presence of photonics, semiconductor, aerospace, and defense industries.
By Component
The Software segment dominated the Optical Design Software Market, accounting for 67.45% of the market share in 2025. This leadership is driven by the rapid shift from hardware-based, on-premises tools to cloud-based, subscription software. According to Eurostat’s Digital Economy and Society Statistics 2025, 52.74% of EU enterprises used paid cloud computing services in 2025, up 7.4 percentage points from 2023, highlighting the growing adoption of cloud software across industries.
The OECD Digital Economy Outlook also reported that the ICT sector grew 7.6% in 2023 across 27 OECD countries, significantly faster than the overall economy, supporting continued demand for advanced software solutions. Cloud-based optical design software enables engineering teams to perform complex ray-tracing and photonic simulations on shared computing infrastructure without investing in expensive local hardware.
This capability is becoming increasingly important as optical systems become more sophisticated for photonic integrated circuits (PICs), AR/VR devices, and autonomous vehicle sensors. In addition, the European Commission’s Digital Decade initiative targets 75% of European businesses adopting cloud or edge technologies by 2030, reinforcing the long-term growth outlook for software-based optical design platforms.
By Application
The Imaging systems design segment accounted for the largest 28.67% share of the market in 2025. Its leadership is supported by strong demand from medical imaging, industrial machine vision, and consumer camera systems, all of which rely on optical simulation software to design and optimize lenses, sensors, and imaging components.
According to the World Health Organization (WHO), the global population aged 80 years and older is projected to increase from 2020 to 2050, reaching 426 million people. This aging population is increasing the need for MRI, CT, ultrasound, and X-ray systems, supporting higher adoption of optical design software during product development.
The fiber optic and photonic devices segment is expected to register the fastest CAGR during the forecast period. Growth is supported by rapid telecom infrastructure expansion. According to India’s Ministry of Communications (Press Information Bureau), 694,711 km of optical fiber cable had been deployed under BharatNet, while 5.08 lakh 5G Base Transceiver Stations (BTSs) were installed across India as of October 2025.
By End Use Industry
Consumer Electronics accounted for 29.44% of the optical design software market, making it the largest end-use segment in 2025. Its leadership is supported by the massive production of smartphones, wearables, and other optical devices. According to International Data Corporation, global smartphone shipments reached 1.26 billion units in 2025, increasing 1.9% year-over-year.
Modern smartphones rely on multi-lens cameras, optical sensors, and LiDAR modules, all of which require advanced optical design and simulation during product development. The segment is also benefiting from rapid growth in smart glasses and connected devices. IDC forecasts 13.6 million smart glasses shipments in 2026, with an expected 18.9% CAGR through 2030, driving demand for waveguide and lens simulation.
In addition, the GSMA Mobile Economy 2026 report states that mobile technologies contributed USD 7.6 trillion to the global economy in 2025, equal to 6.4% of global GDP. The ITU also reports that 5G subscriptions reached about 3 billion mobile broadband connections in 2025, accelerating the development of more advanced smartphones and consumer devices.
Key Market Segments
By Component
- Software
- Cloud Base
- On-premise
- Services
By Application
- Imaging Systems Design
- Illumination Design
- Laser Systems & Beam Propagation
- Fiber Optic & Photonic Devices
- Optomechanical Design
- Display Systems
By End Use Industry
- Consumer Electronics
- Automotive & Transportation
- Healthcare & Medical Devices
- Aerospace & Defense
- Telecommunications
- Others
Market Dynamics
Drivers
| Driver | (~) % Impact on CAGR | Geographic Relevance | Impact Timeline |
|---|---|---|---|
| Photonics-intensive end markets expansion | +2.3% | North America, Europe, East Asia | Short term (≤ 2 years) |
| Shift to integrated optics and AR/VR | +1.6% | Global | Medium term (2 to 4 years) |
| Cloud-based optical simulation workflows | +1.1% | North America, Europe | Medium term (2 to 4 years) |
| Automotive lighting and sensing innovation | +0.9% | Europe, North America, China | Short term (≤ 2 years) |
| Telecom and datacom optical network upgrades | +0.8% | Global | Long term (≥ 4 years) |
Rapid expansion of photonics-intensive verticals such as advanced consumer imaging, automotive sensing, and optical communications is structurally increasing design complexity and the volume of projects that require professional optical design software licenses, with unit volumes of camera modules and lidar sensors in automotive and mobile exceeding 2 to 3 billion units annually as of 2024 to 2026 based on manufacturer shipment disclosures and industry association data.
This growth translates into a higher proportion of engineering teams needing parametric and non-sequential ray-tracing, polarization analysis, and stray-light optimization, driving incremental seat additions and higher-tier subscription uptake that realistically contribute around +2.3% to the baseline optical design software CAGR of 7.20% by raising average license density per R&D dollar spent.
Strategically, this alters business models from primarily perpetual desktop licensing toward mixed enterprise SaaS and usage-linked models where vendors bundle optimization modules, tolerance analysis, and scripting interfaces, capturing more value per design cycle and allowing gross margins in the mid-strong 60 to 70% range through software-led workflows rather than bespoke consulting.
The cumulative impact is faster upgrade cycles, often every 1 to 2 years for major releases, shorter design cycles on the order of 20 to 30% time reduction per project, and higher resilience of maintenance revenues, which anchors the market’s ability to sustain a mid-single- to high-single-digit growth trajectory without relying on speculative future demand.
Restraints
| Restraint | (~) % Impact on CAGR | Geographic Relevance | Impact Timeline |
|---|---|---|---|
| High license and training cost burden | -2.0% | Global | Short term (≤ 2 years) |
| Consolidated vendor landscape and switching barriers | -1.3% | North America, Europe | Medium term (2 to 4 years) |
| Capital expenditure caution in hardware sectors | -1.1% | Global | Short term (≤ 2 years) |
| Export controls on advanced photonics design | -0.8% | US, China, selected Asian markets | Medium term (2 to 4 years) |
| Limited SME adoption outside core optics | -0.7% | Global | Long term (≥ 4 years) |
License fees for professional optical design suites, combined with associated training and certification costs, form a material cash outlay that immediately restrains new seat additions among smaller optics houses and cross-disciplinary engineering teams, with typical annual subscription ranges in the mid- to high-strong four-figure band per seat plus 40 to 80 hours of specialist training per user valued at several tens of dollars per hour.
This cost structure generates a quantifiable bottleneck: for a mid-size OEM optics team of 10 to 20 designers, total yearly software and enablement spend can represent 5 to 10% of the optics R&D budget, forcing deferrals of incremental modules such as advanced optimization, tolerance analysis, or non-sequential add-ons, and effectively shaving around -2.0% off the achievable CAGR versus the 7.20% baseline.
Strategically, high upfront and ongoing costs compress operating margins, particularly in regions where hardware ASPs are under competitive pressure, delaying CapEx decisions on broader deployment (for example, postponing moves from 5 to 10 seats to 20+ seats by 12 to 24 months) and encouraging partial reliance on in-house tools or legacy versions instead of upgrades.
Challenges
| Challenge | (~) % CAGR | Geographic Relevance | Mitigation Horizon |
|---|---|---|---|
| Specialized optics talent gap | -1.8% | Global | Long term (≥ 4 years) |
| Integration with broader CAE stacks | -1.4% | North America, Europe | Medium term (2 to 4 years) |
| Legacy on-premise deployment complexity | -1.2% | Global | Medium term (2 to 4 years) |
| Validation against manufacturing tolerances | -1.0% | Global | Long term (≥ 4 years) |
| Data security and IP protection concerns | -0.9% | Global | Medium term (2 to 4 years) |
The market faces a structural shortage of engineers with deep optical physics, numerical optimization, and software scripting skills, creating friction that limits how quickly organizations can scale usage of advanced design tools even when licenses are available, with professional societies and university program data indicating only several thousand new specialized optical engineers graduating globally per year versus industry needs in the mid-strong tens of thousands.
This talent gap manifests as longer onboarding times, often 6 to 12 months to reach full productivity on complex non-sequential and tolerance analysis workflows, and underutilization of higher-value modules, effectively reducing the market’s maximum realizable growth by about -1.8% below the unconstrained potential implied by the baseline CAGR of 7.20%.
From a corporate strategy standpoint, companies must invest in internal academies, partnerships with universities, and automation features (such as AI-assisted lens design or auto-optimization, which can cut trial iterations by 30 to 50%) to offset limited expert capacity, reallocating 5 to 10% of their R&D or engineering budgets to talent development and process tooling.
Opportunities
| Opportunity | (~) % CAGR | Geographic Relevance | Execution Window |
|---|---|---|---|
| AI-driven generative optical design platforms | +2.1% | Global | Medium term (2 to 4 years) |
| SaaS monetization and usage-based pricing | +1.7% | North America, Europe | Short term (≤ 2 years) |
| Expansion into adjacent photonics verticals | +1.4% | Global | Long term (≥ 4 years) |
| Integrated cloud collaboration and PLM linkage | +1.2% | Global | Medium term (2 to 4 years) |
| Education and low-cost entry tiers | +1.0% | Global | Short term (≤ 2 years) |
AI-driven generative and prompt-based optical design tools represent a future, largely untapped opportunity that can sit on top of existing physics-based solvers to expand addressable usage beyond specialist optical engineers, with emerging platforms showcasing the ability to evaluate millions of lens or optical train permutations in hours rather than days and reduce design iteration counts by 50 to 70% for complex assemblies.
Because most current optical design software deployments still rely heavily on manual parameter sweeps and expert-driven optimization, the shift to AI-assisted workflows could add around +2.1% upside to the baseline CAGR of 7.20% by increasing the number of viable use cases per engineering team and raising willingness to pay for higher-tier modules that incorporate machine learning and GPU acceleration.
This upside is explicitly future-oriented: it depends on vendors building new monetization layers such as premium AI optimization packages, per-simulation usage pricing, or performance-based design services that can expand margins by an estimated 5 to 10 percentage points while cutting average cost per validated design by 20 to 40% for customers.
Strategically, such platforms can unlock sizable untapped potential among electronics, medical devices, and industrial imaging players that currently lack deep optical expertise but have large hardware portfolios, turning what is now a niche specialist toolset into a broader design ecosystem and thereby lifting overall market growth above the baseline if executed over the next 2 to 4 years.
Geopolitical Impact Analysis
The Optical Design Software Market is being reshaped by rising U.S.-China technology tensions and China’s tighter control over critical raw materials. In May 2025, the U.S. Department of Commerce’s Bureau of Industry and Security (BIS) required export licenses for electronic design automation (EDA) software and related technologies (ECCNs 3D991 and 3E991) supplied to China by companies such as Cadence, Synopsys, and Siemens EDA.
These restrictions limited software updates, new deployments, and technical support for Chinese semiconductor and photonics companies, forcing many users to continue with older software versions or adopt domestic alternatives. At the same time, U.S.-China trade declined by more than 25% during 2025 after tariffs on Chinese imports reached as high as 145%, while UNCTAD reported record-high trade policy uncertainty.
China also tightened export controls on rare earth materials through MOFCOM Announcements No. 18 and No. 61 of 2025, introducing licensing requirements for exports of 12 of the 17 rare earth elements, including dysprosium, terbium, and ytterbium. These materials are essential for manufacturing lasers, photonic detectors, and optical coatings used in optical systems designed with simulation software. Products containing as little as 0.1% Chinese-origin rare earth content now require individual export licenses, with approval taking up to 45 working days.
Regional Analysis
North America accounted for the largest share of 34.21% in the Optical Design Software Market, supported by strong investments in defense technologies and semiconductor manufacturing. According to SIPRI, U.S. military spending reached USD 954 billion in 2025, the highest globally and 11% higher than in 2016. A significant share supports electro-optical systems, infrared sensors, laser guidance, and space-based imaging..
The Semiconductor Industry Association (SIA) reports that the U.S. CHIPS Act has catalyzed more than USD 640 billion in semiconductor supply chain investments. New chip fabrication facilities require optical design tools to develop waveguides, optical interconnects, silicon photonics, and laser-integrated components. Canada’s expanding photonics research ecosystem further supports regional market growth.
Asia-Pacific is expected to record the fastest CAGR during the forecast period, driven by expanding semiconductor, telecommunications, and consumer electronics manufacturing. According to the Press Information Bureau (Ministry of Electronics & IT), the India Semiconductor Mission (ISM) had approved 10 projects worth ₹1.60 lakh crore (about USD 19 billion) across six states by December 2025.
The launch of India Semiconductor Mission 2.0 under the 2026 to 2027 Union Budget is expected to further strengthen chip design, fabrication, and packaging capabilities. In addition, the International Telecommunication Union (ITU) reports that 5G networks covered 55% of the global population in 2025, with Asia-Pacific leading new deployments, creating strong demand for optical transceiver and fiber-optic component design software.
Key Regions and Countries
- North America
- The US
- Canada
- Europe
- Germany
- France
- The UK
- Spain
- Italy
- Russia & CIS
- Rest of Europe
- APAC
- China
- Japan
- South Korea
- India
- ASEAN
- Rest of APAC
- Latin America
- Brazil
- Mexico
- Rest of Latin America
- Middle East & Africa
- GCC
- South Africa
- Rest of MEA
Key Players Analysis
The Optical Design Software Market is led by Synopsys, Inc., following its USD 35 billion acquisition of Ansys, completed on July 17, 2025. The deal, the largest in engineering design software, combined electronic design automation (EDA), multiphysics simulation, and optical design software under one platform. In FY2025, Synopsys reported record revenue of USD 7.054 billion, with Ansys contributing USD 756.6 million after the acquisition.
The company also invested USD 2.479 billion in R&D, representing nearly 35% of total revenue, to expand AI-powered simulation and photonics capabilities. Through Ansys, Synopsys now owns leading optical tools including OpticStudio (Zemax), Lumerical FDTD, and Speos, strengthening its position across optical component, photonic, and system-level design.
Keysight Technologies is another major Tier-1 player after acquiring the Synopsys Optical Solutions Group (CODE V, LightTools, LucidShape, and RSoft). The company reported FY2025 revenue of USD 5.35 billion, supported by strong growth in its software and services business.
The Tier-2 market consists of specialized software vendors focused on specific optical and photonic applications. COMSOL Inc. generates an estimated USD 85 to 112 million in annual revenue and employs approximately 489 to 564 people, serving research, medical optics, and photonics through its Wave Optics Module.
Other key companies include LightTrans International (VirtualLab Fusion), Breault Research Organization (ASAP), Lambda Research Corporation (TracePro), and Optiwave Systems (OptiSystem and OptiSPICE). These vendors are well established in areas such as stray light analysis, fiber-optic communication, photonic integrated circuits, and medical imaging.
The Major Players in the Industry
- Synopsys, Inc.
- Zemax LLC (Ansys)
- Lambda Research Corporation
- LightTrans International
- Breault Research Organization (BRO)
- Optiwave Systems Inc.
- Ansys, Inc.
- Photon Engineering LLC
- COMSOL Inc.
- Other Key Players
Key Development
- In May 2026, Keysight Technologies launched CODE V 2026, introducing the AI Start Expert, a generative AI capability that automatically creates and ranks ready-to-optimize lens designs based on user-defined optical specifications such as focal length, field of view, and aperture.
- In June 2026, EssilorLuxottica and Applied Materials, Inc. announced a long-term joint development agreement to develop next-generation intelligent optical systems for augmented reality (AR) and AI-powered smart eyewear.
- In July 2025, Synopsys, Inc. completed its USD 35 billion acquisition of Ansys, marking the largest merger in the history of engineering design software. The combined company integrated Synopsys’ electronic design automation (EDA) and semiconductor IP portfolio with Ansys’ optical and multiphysics simulation solutions, including Zemax OpticStudio, Ansys Lumerical FDTD, and Ansys Speos.
- In January 2025, Wave Photonics announced the commercial availability of its SiNQ silicon nitride process, supported by a 1,056-component Process Design Kit (PDK) covering 33 wavelengths from 493 nm to 1,550 nm. Developed with CORNERSTONE at the University of Southampton, the platform represents the largest photonic integrated circuit (PIC) design kit released for quantum photonics applications.
Report Scope
| Report Features | Description |
|---|---|
| Market Value (2025) | USD 651.2 Mn |
| Forecast Revenue (2035) | USD 1306.5 Mn |
| CAGR (2026 to 2035) | 7.2% |
| Base Year for Estimation | 2025 |
| Historic Period | 2020 to 2024 |
| Forecast Period | 2026 to 2035 |
| Report Coverage | Revenue Forecast, Market Dynamics, Competitive Landscape, Recent Developments |
| Segments Covered | By Component [Software (Cloud-based and On-premise) Services] By Application (Imaging Systems Design, Illumination Design, Laser Systems & Beam Propagation, Fiber Optic & Photonic Devices, Optomechanical Design and Display Systems) By End Use Industry (Consumer Electronics, Automotive & Transportation, Healthcare & Medical Devices, Aerospace & Defense, Telecommunications and Others) |
| Regional Analysis | North America – The US & Canada; Europe – Germany, France, The UK, Spain, Italy, Russia & CIS, Rest of Europe; APAC- China, Japan, South Korea, India, ASEAN & Rest of APAC; Latin America- Brazil, Mexico & Rest of Latin America; Middle East & Africa- GCC, South Africa, & Rest of MEA |
| Competitive Landscape | Synopsys, Inc., Zemax LLC (Ansys), Lambda Research Corporation, LightTrans International, Breault Research Organization (BRO), Optiwave Systems Inc., Ansys, Inc., Photon Engineering LLC, COMSOL Inc., and Other Key Players |
| Customization Scope | Customization for segments and region/country-level will be provided. Moreover, customization can be tailored to the requirements. |
| Purchase Options | We have three licenses to opt for: Single User License, Multi-User License (Up to 5 Users), Corporate Use License (Unlimited Users and Printable PDF) |





























