


Report Overview
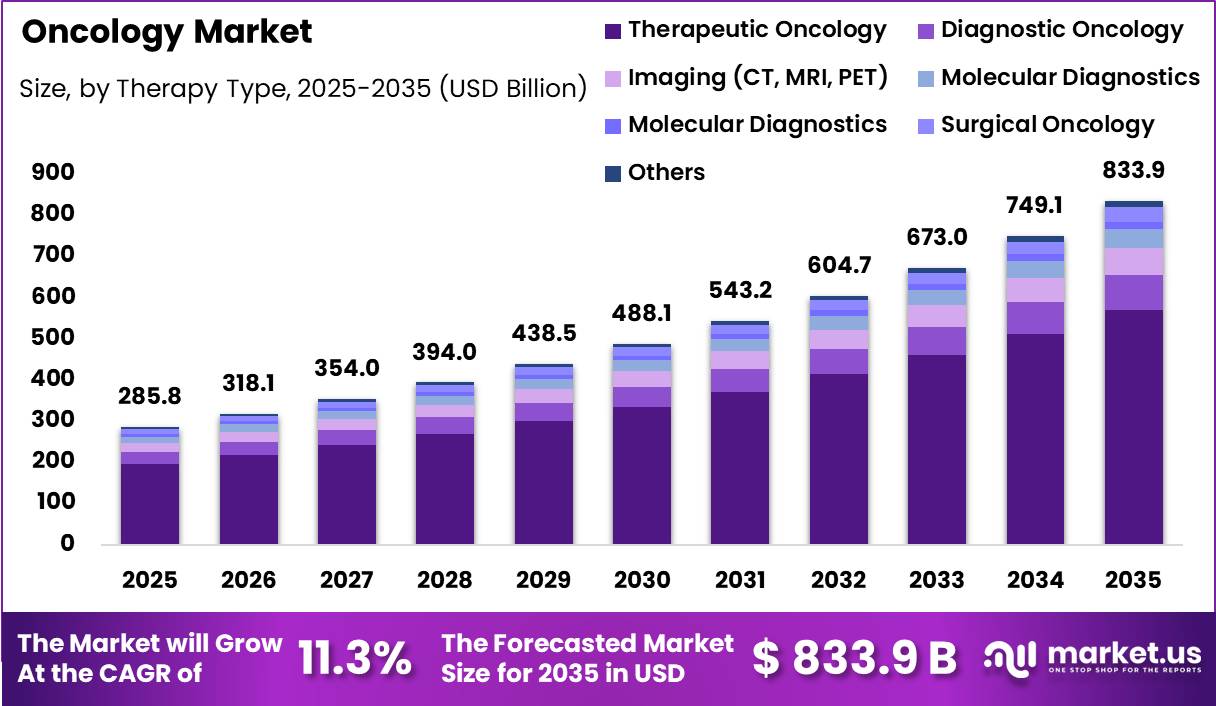
The Global Oncology Market size is expected to be worth around USD 833.9 Billion by 2035 from USD 285.8 Billion in 2025, growing at a CAGR of 11.3% during the forecast period from 2025 to 2035. In 2025, North America led the market, achieving over 52.5% share with a revenue of US$ 150.04 Billion.
In oncology, the field comprises not only complex diagnostic tests like liquid biopsies and molecular diagnostics but also innovative therapies like targeted therapy, immunotherapy, and chemotherapy. The accelerated growth indicates a significant paradigm shift in healthcare towards precision medicine based on biomarkers.
One of the key factors responsible for the fast-paced expansion of the market is the increase in the global incidence of cancer. According to the World Health Organization, the next few decades will witness an unprecedented rise in the number of cancer cases on an annual basis, fuelling the need for medical treatments.
At the clinical level, newer methods of treatment are witnessing greater adoption, and targeted therapy is currently leading the race with immuno-oncology following behind. But strong market constraints put an abrupt halt to all of this progress.
The exorbitant price tag associated with high-end therapies costing millions of dollars makes huge economic demands on the public health system. In addition, the lengthy regulatory process carried out by authorities such as the FDA, in addition to a high rate of clinical trials failures, leads to a very long wait time until the launch of new drugs. There is also the challenge of logistical arrangements, including cold chains for highly sensitive biological products.
Market demand is driven by integrated healthcare organizations. Cancer treatments are largely coordinated at hospitals, making up the lion’s share of end-use demand segments. The majority of modalities used are therapeutic oncology, whereas lung cancer is the most prevalent type among cancer patients. For the future, emerging markets in regions such as APAC and Latin America are large potential demand segments with a poorly developed healthcare infrastructure system.
Key Takeaways
- Market Size: The Global Oncology Market size is expected to be worth around USD 833.9 Billion by 2035 from USD 285.8 Billion in 2025.
- Market Share: The market is growing at a CAGR of 11.3% during the forecast period from 2025 to 2035.
- Therapy Analysis: Targeted Therapy emerges as the key commercial driver, commanding a market share of 32.4%.
- Cancer Type Analysis: The commercial environment is dominated by the need to manage Lung Cancer, which is the primary disease-specific market focus with a market share of 22.6%.
- Modality Analysis: In this regard, expenditure is highly skewed in favour of therapy, where Therapeutic Oncology dominates all business models at 68.4%.
- End User Analysis: There is an extremely high concentration in the global market for oncology, which has a dominant regional presence of 52.5% in North America.
- Regional Analysis: In 2025, North America led the market, achieving over 52.5% share with a revenue of US$ 150.04 Billion.
Therapy Analysis
The Dominant Clinical Powerhouse Driving Global Oncology Spend
The advanced targeted therapy class has the most significant market share among all therapeutic classes at an impressive 32.4%, which is attributable to widespread clinical application of small molecule inhibitors and monoclonal antibodies, as well as the blockbuster success of several drugs that have generated revenues exceeding USD 20 billion worldwide.
Precision medicine adoption guarantees that genomics-based therapies garner the largest portion of health facility acquisition budgets. The major limitations hindering further growth include the swift emergence of cellular resistance against treatment and the high expense of biomarker diagnostics.
Immunotherapy has become the most rapidly growing therapeutic segment, having achieved a 20.1% baseline market share. Rapid growth in this category is catalysed by unprecedented demand for checkpoint inhibitors in various cancers, bolstered by an extensive clinical pipeline boasting more than 3,500 ongoing clinical trials around the world.
Multi-billion-dollar investment pipelines ensure that this category experiences sustained compound annual growth acceleration. However, despite its rapidity, market penetration is hindered by patient exclusion risks associated with immune-mediated adverse effects and rigorous national health insurance regulations that exclude first-line payments.
Novel cell and gene developments constitute the critical upcoming therapeutic segment, with a fundamental 2.1% market share. This budding category is supported by vigorous venture capital activity, exemplified by a 22% annual rise in next-generation oncology technology funding.
Viability is increasing through scalable manufacturing systems to cater to individualized CAR-T and TCR therapy manufacturing processes, enabling this niche category to witness exponential market share growth through broad solid tumour indications. However, rapid growth hinges on resolving severe logistics challenges, namely vein-to-vein cryopreservation volatility and decentralized manufacturing capabilities.
Cancer Type Analysis
Lung Cancer Remains the Dominant Segment in Oncology
lung cancer represents the dominant segment with overall 22.6% market share in the oncology market due to surging global incidence rates and the widespread clinical adoption of high-cost targeted therapies and immunotherapy combinations. This market leadership is reinforced by routine biomarker testing protocols, which actively direct the largest portion of institutional pharmacy budgets toward advanced non-small cell lung cancer (NSCLC) drug regimens.
However, the long-term growth of this segment faces critical headwinds from frequent late-stage patient diagnoses and high clinical attrition rates encountered during the development of next-generation resistance mutation inhibitors.
Second among the largest segments for therapy is breast cancer, which has a strong 17.9% market share. Growth in this segment is due to its high level of maturity and segmentation, covering HER2-positive, hormone receptor-positive, and triple-negative breast cancers, as well as rapid adoption of new ADC drugs. Colon and rectal cancer, on the other hand, continues to enjoy a strong hold on 12.8% of the market share. The growth in this segment is attributed to increasing routine screenings worldwide and the use of anti-VEGF and anti-EGFR biologics in first-line therapies.
Liver (6.4%), gastric (5.3%), and oesophageal (3.1%) cancers constitute specialized, high-unmet-need therapeutic markets. While historically constrained by limited treatment pathways, these segments are experiencing rapid clinical evolution due to the recent approval of first-line immunotherapy combinations. Growth acceleration in these indications relies heavily on improving early diagnostic tools and overcoming geographic variations in disease prevalence, which heavily impact clinical trial recruitment and localized commercial access.
Modality Analysis
The onsite segment held the majority of the share in this market.
This therapeutic sector dominates with a 68.4% market share due to the repeated dosing schedules required for systemic drugs encompassing complex biologics, advanced targeted treatments, and conventional chemotherapy options.
Because oncology care typically necessitates prolonged, multi-line therapies, these regimens consistently account for the vast majority of financial expenditures incurred across hospitals and specialized patient clinics. However, further market consolidation is primary restricted by the high toxicity profiles of current drugs and escalating financial barriers related to patient access to these costly medications.
Oncologic diagnostics and diagnostic imaging using CT, MRI, and PET play a critical role in forming the company’s operations, capturing 10.2% and 7.8% of the market share correspondingly. The consistent cash flow from these sectors stems from the necessity to have an early detection and monitoring process.
Development in these sectors will be fostered by the adoption of AI in image reading technology and the growing number of cancer screenings around the globe. Nevertheless, high costs associated with purchasing equipment and lack of specialists pose serious threats to market dynamics.
Molecular diagnostics (5.4%), surgery oncology (4.1%), and liquid biopsy (2.3%) represent the bleeding-edge technologies of precision medicine and localized treatment. The swift business growth of molecular diagnostics and liquid biopsy testing technologies is highly correlated with the emergence of personalized medication, given the use of these methods by doctors to conduct biomarker profiling and monitor minimal residual disease (MRD).
Although surgery oncology is a classic cure for localized cancer, its smaller percentage is attributed to the fact that it is a once-in-a-lifetime therapy and not a regularly recurring cost. The main obstacles in the way of these technologies include developing clinical guidelines and insurance coverage.
End User Analysis
Institutional anchors facilitating universal cancer care deployment
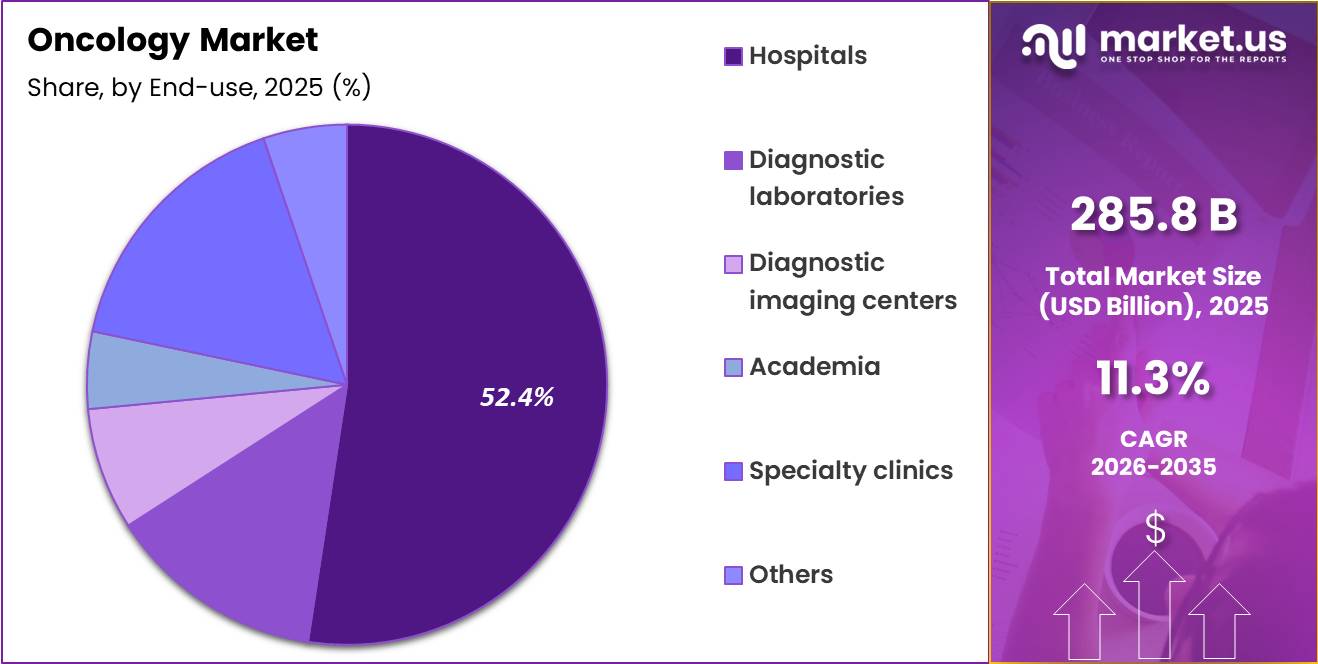
The hospitals are the largest end-use group in the worldwide oncology industry and lead this market by capturing a huge 52.4% share of this market. The dominance is a due to centralized advanced infrastructures in terms of capital intensive radiation oncology machinery, specialized surgery rooms, and complete inpatient infusions centres.
Hospitals continue to serve as the main venue for multiple discipline cancer specialists, and more than half of all patient treatment occurs at such places across the world. The segment is hindered by rising operational expenses, bottlenecked healthcare facilities, and the trend of opting for out-patient services to reduce hospital costs.
However, specialty clinics are fast emerging as one of the most quickly growing segments in the industry and claim a sizable 16.5% market share. The high growth segment is the result of increased number of private clinics and independent oncologists who offer convenient out-patient chemotherapy and immunotherapy treatments.
Advances in oral medicines and infusion pumps make it possible for such clinics to offer a much more personalized treatment with reduced waiting times than big hospital networks. Nonetheless, the success of the segment relies greatly on favourable reimbursement policies and availability of biological drugs by small networks.
Diagnostic laboratories and imaging centres are anticipated to be the important upcoming areas that are likely to see a significant increase in growth, accounting for 21.1% in combined market share (13.5% of laboratories and 7.6% of imaging). This important diagnostic vertical will witness robust growth owing to the increasing global drive towards cancer screenings and the growing use of next-generation sequencing, tumour biomarker tests, and liquid biopsies.
The continual incorporation of AI in diagnostic techniques like CT, MRI, and PET scans also boosts efficiency in diagnostic results, making these facilities essential. Expansion into this upcoming area can be hindered mainly by the expensive nature of diagnostic equipment used and the worldwide shortage of pathologists and radiologists who are skilled enough to read molecular information.
Key Market Segments
By Therapy Type
- Chemotherapy
- Targeted Therapy
- Immunotherapy
- Hormonal Therapy
- Radiation Therapy
- Cell & Gene Therapy
- Combination Therapy
- Others
By Cancer Type
- Prostate cancer
- Lung cancer
- Colon and rectal cancer
- Gastric cancer
- Esophageal cancer
- Liver cancer
- Breast cancer
- Others
By Modality
- Therapeutic Oncology
- Diagnostic Oncology
- Imaging (CT, MRI, PET)
- Molecular Diagnostics
- Liquid Biopsy
- Surgical Oncology
- Others
By End Use
- Hospitals
- Diagnostic laboratories
- Diagnostic imaging centres
- Academia
- Specialty clinics
- Others
Drivers
Biomarker-led earlier intervention and monitoring adoption
A third driver is the widening use of biomarker-guided treatment selection and recurrence monitoring. In 2025, NCCN updates for colon and rectal cancer incorporated ctDNA as a prognostic high-risk factor for recurrence in the adjuvant setting, and Merkel cell carcinoma guidance included ctDNA surveillance language with testing often obtained every three months in practice contexts cited by the guideline discussion. Even where broad guideline endorsement remains uneven across all tumor types, the commercial direction is clear: oncology is shifting from histology-led treatment allocation toward serial molecular management.
This changes business models at multiple levels. Biomarker intensity expands the effective market for targeted drugs by improving patient identification, reduces wasted promotional spend by concentrating prescribing in molecularly eligible subgroups, and creates repeat-test revenue loops that support earlier therapy switching or MRD-triggered intervention. It also supports premium pricing because stronger selection can improve real-world response rates and payer justification.
The result is not only better conversion of diagnosed patients into treated patients, but also a reconfiguration of the care pathway toward higher-frequency testing, shorter decision cycles, and more durable use of precision assets. On that basis, biomarker-led pathway redesign contributes an estimated +1.2 percentage points to near-term oncology CAGR, with the sharpest uptake in the U.S., EU, Japan, South Korea, and top-tier Chinese institutions.
| Driver | (~) % Impact on CAGR Forecast | Geographic Relevance | Impact Timeline |
|---|---|---|---|
| Rising cancer case load and treatment pool expansion | +1.6% | North America core, EU5, China, Japan, urban India | Medium term (2-4 years) |
| Faster premiumization through ADCs, bispecifics and radioligand therapies | +2.1% | U.S. core, Western Europe, Japan, China tier-1 centers | Medium term (2-4 years) |
| Biomarker-led earlier intervention and monitoring adoption | +1.2% | U.S. core, EU, Japan, South Korea, China leading hospitals | Short term (≤ 2 years) |
| Regulatory throughput and label expansion intensity | +1.4% | U.S. core, EU, UK, Japan, selected APAC spill-over | Short term (≤ 2 years) |
| Reimbursement redesign, IRA pressure and biosimilar rebalancing | +0.9% | U.S. core, EU reimbursement markets, LATAM spill-over | Medium term (2-4 years) |
| Manufacturing scale-up for complex oncology modalities | +1.0% | U.S., EU, Japan, China, Singapore biomanufacturing hubs | Long term (≥ 4 years) |
Challenges
Fragile oncology sterile injectables manufacturing and supply
The oncology market remains exposed to a structurally thin sterile-injectables base in which a limited number of qualified sites, aging aseptic lines, and quality-event sensitivity create recurring supply turbulence for chemotherapy backbones and supportive drugs, with FDA continuing to identify manufacturing and quality problems, supply interruptions, discontinuations, and demand spikes as core shortage drivers while broader reporting still characterizes oncology shortages as among the worst in decades.
In 2026 terms, this translates into modeled disruption penalties of roughly 6-10 weeks for line remediation, 12-18% emergency procurement cost inflation, 3-5 percentage-point swings in hospital safety-stock coverage, and 2-4% regimen rescheduling or substitution rates in affected channels, enough to shave about 1.4% points from the market’s theoretical growth trajectory by delaying treatment starts, shifting mix toward nonoptimal alternatives, and raising provider inventory costs rather than eliminating demand outright.
The strategic response is not simple capacity addition but multi-year network redesign: dual-source qualification, higher domestic fill-finish redundancy, QA digitization, longer API visibility windows across APAC corridors, and contract structures that reward resilience instead of lowest unit cost, because normalization depends on manufacturing validation cycles and regulatory reinspection timelines that cannot compress to a single budgeting season.
| Challenge | (~) % CAGR Friction Drag | Geographic Relevance | Mitigation Horizon |
|---|---|---|---|
| Fragile oncology sterile injectables manufacturing base | -1.4% | North America; EU hospital networks; APAC API corridors | Medium term (2-4 years) |
| Chronic global oncology workforce and burnout pressure | -1.2% | North America; Western Europe; urbanizing APAC centers | Long term (≥ 4 years) |
| Fragmented biomarker and companion diagnostic access | -1.0% | US precision hubs; EU regulators; advanced APAC | Medium term (2-4 years) |
| Inefficient, biomarker-heavy oncology trial enrollment | -0.9% | US academic sites; EU cross-border; APAC growth nodes | Medium term (2-4 years) |
| High administrative and prior-authorization care friction | -0.8% | United States; reimbursement-intensive OECD markets | Short term (≤ 2 years) |
| Uneven global radiotherapy capacity and workforce gaps | -0.7% | LMICs; lower-tier APAC; Africa; Latin America | Long term (≥ 4 years) |
Restraints
Persistent Oncology Drug Shortages and Lost Treatment Demand
Oncology drug shortages remain a near-term drag because supply resilience has improved only partially: ASHP reported 253 active national drug shortages as of June 2025, while chemotherapeutic agents remained among the top shortage classes and more than 42% of active shortages had persisted since 2022 or earlier, indicating that the bottleneck is structural rather than episodic.
In oncology, the root causes are concentrated in sterile injectable manufacturing fragility, single-site production dependence, quality deviations, API concentration risk, and low-margin generic economics that discourage redundant capacity, which means a single plant shutdown, input contamination event, or freight interruption can remove meaningful treatment volume for months.
The business impact is a direct mix distortion toward substitute regimens, forced protocol amendments, treatment delays, emergency sourcing premiums, and inventory buffering, all of which compress provider margins and slow therapy initiation; in growth terms, that translates into modeled demand leakage of roughly 140 basis points from baseline CAGR in the current planning window, with the sharpest effect in the US and Europe where protocolized care pathways expose shortages quickly into utilization data.
| Restraint | (~) % Impact on CAGR Forecast | Geographic Relevance | Impact Timeline |
|---|---|---|---|
| Oncology drug shortages | -1.4% | North America core, EU, selected APAC import markets | Short term (≤ 2 years) |
| HTA and reimbursement tightening | -1.2% | EU core, UK, Canada, developed APAC | Medium term (2-4 years) |
| Trial cost and enrollment inflation | -1.6% | North America, EU, APAC trial hubs | Medium term (2-4 years) |
| ADC and HPAPI capacity bottlenecks | -1.0% | US, EU, Japan, Korea, China biologics corridors | Short term (≤ 2 years) |
| Prior authorization and payer controls | -0.9% | US core, selected private-pay markets | Short term (≤ 2 years) |
| Accelerated approval uncertainty | -0.7% | US core, follow-on global launch markets | Medium term (2-4 years) |
Opportunitys
Integrated precision screening-to-treatment oncology platforms
Another underexploited opportunity is building integrated screening-to-diagnostics-to-therapy platforms around liquid biopsy, molecular triage, digital pathology, and pathway-linked therapy initiation, especially in tumor types where late diagnosis still suppresses addressable treated prevalence; this differs from a baseline driver because the current market already sells oncology drugs, whereas the upside comes from converting previously uncaptured patients into earlier and more treatable lines of care through a platform model. WHO reported 53.5 million people alive within five years of diagnosis in 2022 and a global burden of 20 million new cases, indicating a very large longitudinal management population that remains only partly stratified by precision diagnostics.
If integrated providers can lift biomarker testing penetration by 15 to 20% points in lung, colorectal, breast, and hematologic segments across developed markets and upper-middle-income systems, first-line precision treatment eligibility could expand by 5% to 8%, avoidable diagnostic delay could fall by 10 to 20 days, and per-patient lifetime oncology revenue capture could rise 8% to 14%, supporting an estimated 2.1-point CAGR uplift above baseline through adjacent diagnostics TAM, higher regimen matching, and richer real-world data monetization rather than through current standard-of-care demand alone.
| Opportunity | (~) % Potential CAGR Upside | Geographic Relevance | Execution Window |
|---|---|---|---|
| Community oncology-at-home | +1.6% | North America core, EU, Japan, urban China | Short term (≤ 2 years) |
| Precision screening-to-treatment platforms | +2.1% | North America, EU, GCC, APAC tier-1 cities | Medium term (2-4 years) |
| Radioligand network expansion | +2.4% | US, EU5, Australia, select APAC | Medium term (2-4 years) |
| LMIC access stack models | +2.8% | India, Southeast Asia, Africa, LatAm | Medium term (2-4 years) |
| Biosimilar-funded premium switching | +1.3% | EU, China, US, LatAm | Short term (≤ 2 years) |
| Post-approval platform M&A roll-ups | +1.9% | US, EU, Korea, China biotech hubs | Long term (≥ 4 years) |
Geopolitical Impact Analysis
The growing military action in the critical transportation lanes has created considerable operational bottlenecks within the logistical chain for advanced oncological medicines. Airspace shutdowns and changes to sea shipping routes pose a grave threat to sensitive bio-pharmaceuticals. These drugs need constant refrigeration to stay viable during shipment.
The logistics issues pose an acute danger of localized stock shortages since inventory levels in institutions for complicated oncological medications tend to be minimal. The situation places significant pressure on commercial product volume velocity, affecting pharmaceutical income flow through regional centres.
Geopolitical turbulence in active research areas has caused a major breakdown in the international pipeline of oncological medication development. Traditionally, Eastern European medical clinics have been crucial and affordable locations for conducting late-phase oncological clinical tests.
The inability of these centres to conduct the necessary testing has resulted in sponsors suspending their operations and rapidly relocating their projects to Western Europe and Asia. Such operational relocation results in high administrative costs and a significant slowdown in phases II and III of drug candidate trials.
The destruction caused by war to local healthcare delivery infrastructure leads to an acute diagnostic decline effect referred to as stage migration. Since public health screening is severely disrupted during wartime, most of the patients will either ignore their symptoms or fail to get the standard medical imaging tests required. This means that a large number of patients present at hospitals with late-stage cancers rather than early-stage cancers. This situation will compel hospitals to provide aggressive treatment options for the condition, which is usually costly.
Regional Analysis
North America Held Largest Share in Global Oncology Market.
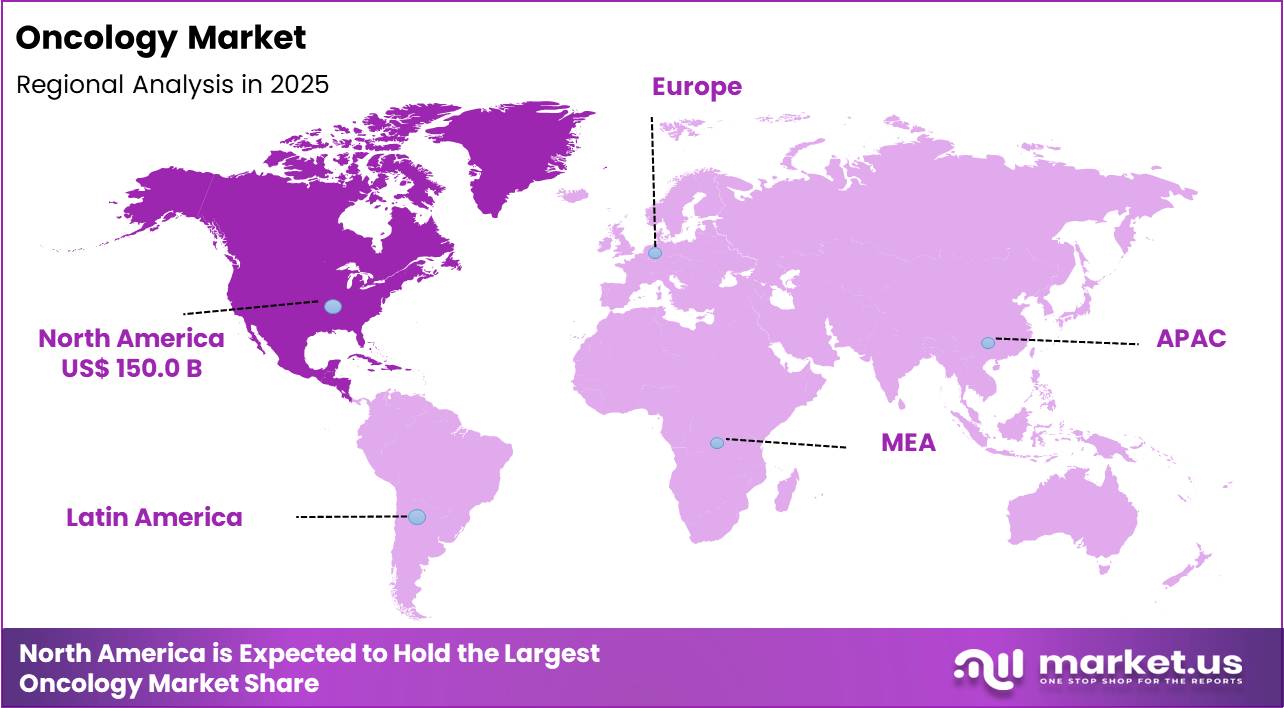
The North America segment has a dominating presence in the global oncology market, with a significant market share of 52.5% representing US$ 150.0 billion valuation. These dominant factors include high expenditure on health care per capita, fast adoption of costly precision medicine, and favourable reimbursement policies. The Europe region follows second, holding a respectable 24.3% market share. This is made possible through the existence of solid national health care systems and broad access to advanced biologics.
Asia-Pacific is considered one of the most active regions within the market, holding a respectable 17.6% market share. This region has been growing fast, owing to the high number of patients, growth in disposable incomes, and increased investments in infrastructure. On the other hand, the Latin America and the Middle East & Africa regions occupy small market shares of 3.4% and 2.2%, respectively. Although small and emerging, these niches are expected to have significant growth potential in the future.
Key Regions and Countries
- North America
- The US
- Canada
- Europe
- Germany
- France
- The UK
- Spain
- Italy
- Russia & CIS
- Rest of Europe
- APAC
- China
- Japan
- South Korea
- India
- ASEAN
- Rest of APAC
- Latin America
- Brazil
- Mexico
- Rest of Latin America
- Middle East & Africa
- GCC
- South Africa
- Rest of MEA
Key Players Analysis
The core market share is heavily consolidated among a select few global leaders, including Bristol-Myers Squibb Company, Merck & Co., and F. Hoffmann-La Roche, which dictates market direction through substantial pricing power. These giants leverage strict regulatory hurdles, advanced manufacturing constraints, and strong patent protections to defend their commercial footprint.
This oligopoly is actively sustained through strategic, value-added Mergers and Acquisitions (M&A). This is demonstrated by dominant players systematically absorbing smaller biotech companies to acquire advanced, next-generation Antibody-Drug Conjugates (ADCs) and novel cell therapies. A similar consolidated pattern is visible in the heavy medical imaging tier, where GE Healthcare Technologies retains a dominant slice of the large-scale hardware market
Conversely, the clinical diagnostics, molecular testing, and biomarker screening sectors are heavily fragmented. Rather than being controlled by a monopoly, this space is defined by an array of mid-sized laboratories and regional specialty providers.
This localized dispersion is heavily driven by distinct regional regulations, combined with continuous, fast-paced technical innovations in artificial intelligence software and liquid biopsy systems. Over the coming years, this landscape is projected to undergo steady consolidation, as smaller innovators will continue to license out their novel platforms or completely sell out to the established core oligopoly.
Top Key Players
- Bristol-Myers Squibb Company.
- Amgen Inc.
- AstraZeneca plc.
- Gilead Sciences, Inc.
- Eli Lilly and Company.
- GE Healthcare Technologies Inc.
- AbbVie Inc.
- GlaxoSmithKline plc.
- Johnson & Johnson Services, Inc.
- Merck & Co., Inc.
- Novartis AG.
- Pfizer Inc.
- Hoffmann-La Roche Ltd.
- Sanofi S.A.
- Takeda Pharmaceutical Company Limited.
Key Development
- In March 2026, As part of a solution to the company’s pressing need for expansion through pipelines, Merck & Co. has made a huge $ 6.7 billion investment via a strategic acquisition of Terns Pharmaceuticals. By making such an investment, Merck will be able to get access to TERN-701 – an oral tyrosine kinase inhibitor that treats chronic myeloid leukemia.
- In May 2026, Further extending its pipelines to the rest of the world, Bristol Myers Squibb established a huge $15.2 billion research and development partnership with China’s Hengrui Medicine. The deal covers 13 unique drug programs which would ensure the establishment of a vast multi-center footprint for the company across various next-generation respiratory, immunology, and oncology programs.
Report Scope
| Report Features | Description |
|---|---|
| Market Value (2025) | US$ 285.8 Billion |
| Forecast Revenue (2035) | US$ 833.9 Billion |
| CAGR (2026-2035) | 11.3% |
| Base Year for Estimation | 2025 |
| Historic Period | 2020-2024 |
| Forecast Period | 2026-2035 |
| Report Coverage | Revenue Forecast, Market Dynamics, Competitive Landscape, Recent Developments |
| Segments Covered | By Therapy Type (Chemotherapy, Targeted Therapy, Immunotherapy, Hormonal Therapy, Radiation Therapy, Cell & Gene Therapy, Combination Therapy, Others), By Cancer Type (Prostate cancer, Lung cancer, Colon and rectal cancer, Gastric cancer, Oesophageal cancer, Liver cancer, Breast cancer, Others), By Modality (Therapeutic Oncology, Diagnostic Oncology, Imaging (CT, MRI, PET), Molecular Diagnostics, Liquid Biopsy, Surgical Oncology, Others), By End Use (Hospitals, Diagnostic laboratories, Diagnostic imaging centres, Academia, Specialty clinics, Others) |
| Regional Analysis | North America – The US, Canada, & Mexico; Western Europe – Germany, France, The UK, Spain, Italy, Portugal, Ireland, Austria, Switzerland, Benelux, Nordic, & Rest of Western Europe; Eastern Europe – Russia, Poland, The Czech Republic, Greece, & Rest of Eastern Europe; APAC – China, Japan, South Korea, India, Australia & New Zealand, Indonesia, Malaysia, Philippines, Singapore, Thailand, Vietnam, & Rest of APAC; Latin America – Brazil, Colombia, Chile, Argentina, Costa Rica, & Rest of Latin America; Middle East & Africa – Algeria, Egypt, Israel, Kuwait, Nigeria, Saudi Arabia, South Africa, Turkey, United Arab Emirates, & Rest of MEA |
| Competitive Landscape | Bristol-Myers Squibb Company, Amgen Inc., AstraZeneca plc., Gilead Sciences, Inc., Eli Lilly and Company, GE Healthcare Technologies Inc., AbbVie Inc., GlaxoSmithKline plc., Johnson & Johnson Services, Inc., Merck & Co., Inc., Novartis AG., Pfizer Inc., F. Hoffmann-La Roche Ltd., Sanofi S.A., Takeda Pharmaceutical Company Limited. |
| Customization Scope | Customization for segments, region/country-level will be provided. Moreover, additional customization can be done based on the requirements. |
| Purchase Options | We have three licenses to opt for: Single User License, Multi-User License (Up to 5 Users), Corporate Use License (Unlimited User and Printable PDF) |





































