


Report Overview
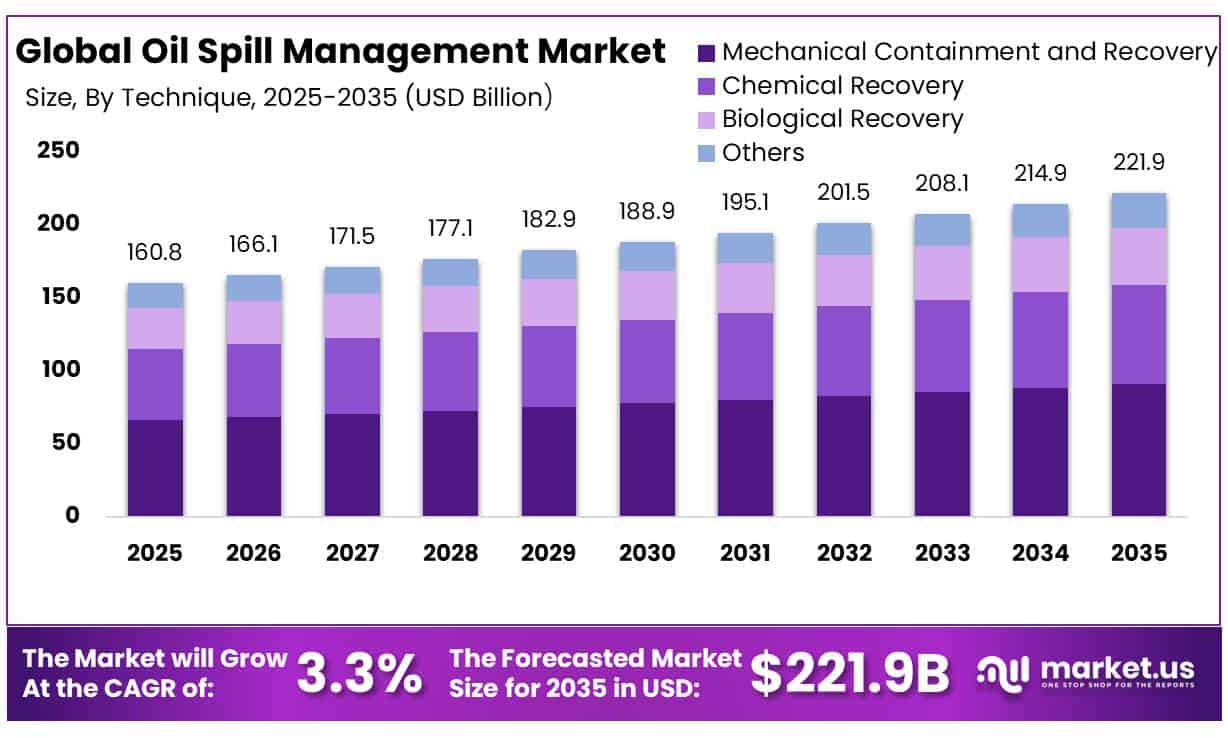
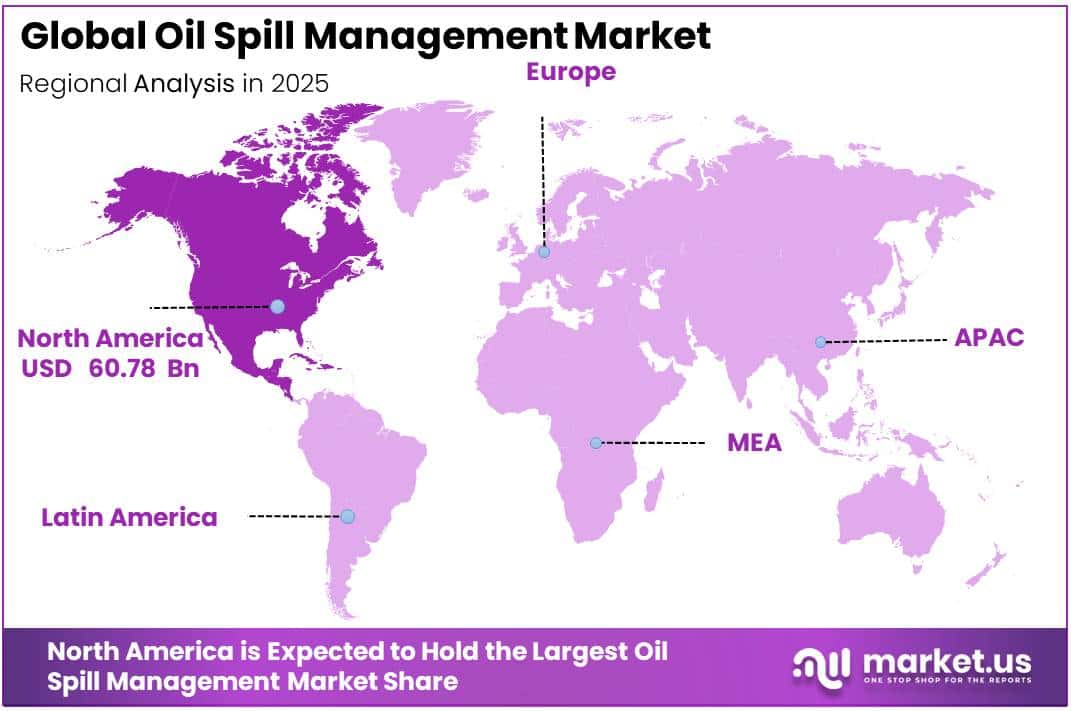
In 2025, the Oil Spill Management Market was valued at USD 160.8 Billion, and between 2026 and 2035, this market is estimated to register a CAGR of 3.3%, reaching about USD 221.9 Billion by 2035. North America held a dominant market position, capturing more than a 37.8% share, holding USD 60.78 Billion in revenue.
The oil spill management market encompasses the equipment, chemicals, and specialized services used to prevent, contain, and remediate accidental releases of crude and refined petroleum products into marine and inland environments. It includes containment booms, skimmers, sorbents, dispersants, and in-situ burning technologies deployed by government agencies, shipping operators, and offshore installations.
- According to the International Tanker Owners Pollution Federation, the total volume of oil lost to the environment from tanker spills in 2025 was approximately 4,000 tonnes, down from 10,000 tonnes in 2024, while spills exceeding 7 tonnes have declined more than 90% since the 1970s. The United States National Oceanic and Atmospheric Administration responds to over 150 oil and chemical spills annually in United States waters, underscoring sustained response demand.
Key Takeaways
- The Global Oil Spill Management Market was valued at USD 160.8 billion in 2025.
- The Global Market is projected to grow at a CAGR of 3.3% and is estimated to reach USD 221.9 billion by 2035.
- On the basis of technique, mechanical containment and recovery dominated the market, constituting 41.3% of the total market share.
- Based on the type, pre-oil spill dominated the market, with a substantial market share of around 58.3%.
- Based on the location, offshore dominated the market, accounting for 54.2% of the total market share.
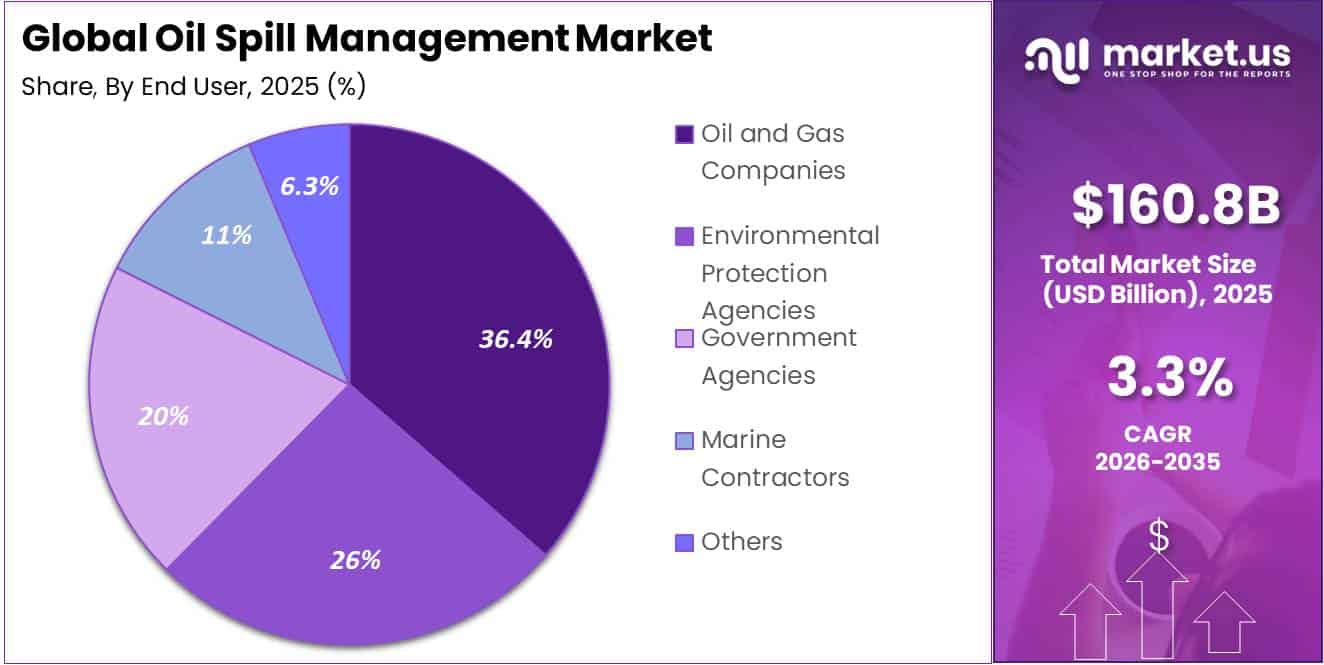
- Based on the end-user, oil and gas companies dominated the market, accounting for 36.4% of the total market share.
- In 2025, North America was the most dominant region in the Oil Spill Management Market, accounting for 37.8% of the global market.
Growth opportunities are driven by expanding satellite-based surveillance and stricter enforcement regimes. The European Maritime Safety Agency’s CleanSeaNet service supplies participating states with more than 3,000 satellite images annually to detect possible oil slicks and identify polluters. Shipping accidents account for approximately 36% of oil entering the marine environment from shipping activity, sustaining investment in advanced containment and recovery systems across coastal and offshore operations.
Government initiatives continue to shape the market’s regulatory foundation. In the United States, the Oil Pollution Act, enacted in 1990, created the Oil Spill Liability Trust Fund, which can provide up to $1 billion dollars for any single oil pollution incident, including up to 500 million dollars for natural resource damage assessments. The Fund is administered by the United States Coast Guard’s National Pollution Funds Center, established under the same Act to strengthen national spill response capability.
By Technique
Mechanical Containment and Recovery leads with 41.3% because it remains the first choice for immediate oil spill response.
In 2025, Mechanical Containment and Recovery held a dominant market position, capturing more than a 41.3% share. The segment maintained its leadership because it is widely accepted as the primary response method for controlling and removing spilled oil from water while minimizing additional environmental impact. Government agencies and maritime authorities continue to recommend the use of containment booms, skimmers, and recovery vessels as the first line of action, especially for offshore and coastal spills.
Chemical Recovery is expected to register the fastest growth during the forecast period as demand increases for rapid response solutions in large offshore spills and difficult operating conditions. In 2025 and 2026, environmental and maritime authorities continued evaluating the controlled use of approved chemical dispersants where mechanical recovery alone may not be sufficient. The method is particularly valuable during rough sea conditions or remote offshore locations where quick action is necessary to reduce the spread of oil.
By Type
Pre-Oil Spill dominates with 58.3% as prevention and preparedness remain the highest priority.
In 2025, Pre-Oil Spill held a dominant market position, capturing more than a 58.3% share. The segment remained the largest because governments, offshore operators, and shipping companies continued to prioritize preventive measures over costly cleanup operations. Regulatory authorities across major oil-producing regions strengthened inspection programs, risk assessments, equipment maintenance, and emergency preparedness requirements to reduce the likelihood of spill incidents.
Post-Oil Spill is expected to witness the fastest growth during the forecast period as governments and energy companies continue to strengthen response capabilities for accidental oil releases. In 2025 and 2026, environmental agencies and maritime authorities expanded emergency response planning, spill recovery resources, and environmental restoration programs to improve readiness after spill events. Greater attention to faster containment, shoreline cleanup, wildlife protection, and ecosystem recovery has increased demand for specialized response services and equipment.
By Location
Offshore dominates with 54.2% as expanding offshore energy operations require stronger spill protection.
In 2025, Offshore held a dominant market position, capturing more than a 54.2% share. The segment led the market because offshore oil exploration, production, and marine transportation continue to face higher spill risks and stricter environmental regulations. Government agencies responsible for offshore safety have maintained strong oversight through mandatory emergency response plans, regular inspections, and spill preparedness requirements for offshore facilities.
Onshore is expected to register the fastest growth during the forecast period as governments and energy companies continue to improve environmental protection around pipelines, storage terminals, refineries, and production facilities. In 2025 and 2026, regulatory authorities increased attention on leak detection, pipeline integrity management, and emergency response planning to reduce the environmental impact of accidental spills on land.
By End-Use
Oil and Gas Companies lead with 36.4% as strict compliance and operational safety drive higher spending on spill management.
In 2025, Oil and Gas Companies held a dominant market position, capturing more than a 36.4% share. The segment remained the largest because oil producers, offshore operators, pipeline companies, and refinery operators are directly responsible for preventing and responding to oil spill incidents. Government regulators continued to enforce strict environmental standards that require operators to maintain spill response equipment, emergency plans, and trained response teams before conducting exploration, production, and transportation activities.
Environmental Protection Agencies are expected to witness steady growth as governments continue to strengthen environmental monitoring and emergency response capabilities. During 2025 and 2026, national environmental authorities increased efforts to improve spill surveillance, shoreline protection, ecosystem restoration, and coordination with industry during oil spill incidents. Agencies are expanding the use of satellite monitoring, aerial surveillance, and digital reporting systems to detect spills more quickly and support faster response actions.
Key Market Segments
By Technique
- Mechanical Containment and Recovery
- Containment Booms
- Hard Booms
- Fire Booms
- Others
- Skimmers
- Weir Shimmers
- Oleophilic Skimmers
- Non-Oleophilic Skimmers
- Others
- Sorbent
- Others
- Containment Booms
- Chemical Recovery
- Dispersing Agents
- Gelling Agents
- Others
- Biological Recovery
- Others
By Type
- Pre-Oil Spill
- Double-hull
- Pipeline Leak Detection
- Blow-out preventers
- Others
- Post-Oil Spill
By Location
- Onshore
- Offshore
By End-Use
- Government Agencies
- Oil and Gas Companies
- Environmental Protection Agencies
- Marine Contractors
- Others
Driver Analysis
Mandatory response-plan compliance
Regulatory compliance remains the most dependable recurring-revenue driver because it converts spill readiness from discretionary environmental expenditure into an operating-license requirement. Under IMO MARPOL Annex I Regulation 37, oil tankers of at least 150 gross tonnage and other ships of at least 400 gross tonnage must carry an approved Shipboard Oil Pollution Emergency Plan; the OPRC Convention separately requires national contingency planning and cross-border response cooperation.
- In the United States, offshore owners and operators handling, storing, or transporting oil must have an approved Oil Spill Response Plan before operations begin, while onshore facilities potentially subject to discharge controls require SPCC planning above 1,320 gallons of qualifying aboveground storage or 42,000 gallons of buried storage; facilities exceeding 10,000 gallons require professional-engineer certification.
These requirements sustain annual spending on plan revisions, tabletop exercises, equipment inspection, boom and skimmer availability, trained personnel, and response-retainer contracts rather than only episodic cleanup revenue. The market implication is a larger service mix preparedness audits, digital documentation, training, and managed-response subscriptions with regulatory enforcement raising the value of demonstrable readiness and shortening sales cycles for accredited oil-spill response organizations.
Drivers Impact Analysis
| Driver | (~) % Impact on CAGR | Geographic Relevance | Impact Timeline |
|---|---|---|---|
| Mandatory response-plan compliance | +0.9 pp | North America core, EU, APAC ports | Short term (≤ 2 years) |
| Offshore and deepwater asset exposure | +0.8 pp | Brazil, Gulf of Mexico, West Africa, Middle East, APAC | Medium term (2–4 years) |
| Tanker, port and pipeline risk | +0.7 pp | Asia corridors, Middle East, Europe, North America | Short term (≤ 2 years) |
| Satellite, drone and AI deployment | +0.7 pp | EU, North America, Gulf, advanced APAC | Medium term (2–4 years) |
| Climate-driven coastal vulnerability | +0.5 pp | Arctic, islands, Southeast Asia, Gulf Coast | Long term (≥ 4 years) |
| Restoration liability and ESG pressure | +0.4 pp | EU, North America, Australia, coastal Africa | Medium term (2–4 years) |
Restraint Analysis
Logistics and equipment delays
Response effectiveness depends on hours, yet boom sections, skimmers, vessels, absorbents, containers, spare parts, and specialist crews frequently move through the same congested ports and maritime corridors exposed to conflict, rerouting, customs friction, and weather disruption. UNCTAD reported that Red Sea rerouting increased global maritime ton-miles by a record 6% in 2024, while Suez Canal tonnage in May 2025 remained 70% below the 2023 level; it also recorded a 149% increase in the average Shanghai Containerized Freight Index to 2,496 points in 2024, with July spot rates reaching USD 3,600 per container.
These conditions inflate delivered-equipment costs, lengthen replenishment cycles, and increase working-capital needs for stockpiled consumables and spare units. For response providers, the dilemma is structural: holding regional redundancy improves mobilization performance but ties up capital in low-turn inventory, while centralized inventory lowers overhead but risks delayed deployment and contractual penalties after a spill.
Restraint Impact Analysis
| Restraint | (~) % Impact on CAGR | Geographic Relevance | Impact Timeline |
|---|---|---|---|
| High readiness-cost burden | -0.9 pp | Emerging APAC, Africa, Latin America | Short term (≤ 2 years) |
| Logistics and equipment delays | -0.8 pp | Middle East, Red Sea, Europe, APAC corridors | Short term (≤ 2 years) |
| Specialist workforce scarcity | -0.6 pp | North America, EU, Gulf, remote offshore | Medium term (2–4 years) |
| Fragmented regulatory regimes | -0.5 pp | Cross-border waters, Africa, ASEAN, Latin America | Medium term (2–4 years) |
| Low incident-frequency economics | -0.5 pp | Mature markets, inland assets, small operators | Long term (≥ 4 years) |
| Harsh-environment technology limits | -0.4 pp | Arctic, deepwater, islands, cyclone-prone coasts | Long term (≥ 4 years) |
Opportunity Analysis
Response-intelligence SaaS
The underpenetrated opportunity is to convert incident readiness from equipment ownership and annual consulting into a recurring, data-led operating platform that links satellite alerts, AIS vessel data, meteorological inputs, spill-drift models, response-plan documentation, contractor availability, training records, and regulator reporting. This is an upside opportunity rather than a current driver because satellite monitoring exists EMSA’s CleanSeaNet has delivered near-real-time SAR-based oil and vessel detection since 2007 but most capability remains institutionally operated and fragmented across responders, ports, insurers, and operators rather than commercialized as an interoperable multi-tenant workflow product.
A provider that charges USD 25,000–150,000 annually per terminal, port, offshore installation, or fleet-management customer, plus USD 2,000–10,000 per incident-model run, can shift gross-margin mix from roughly 20–35% for equipment-led deployment toward 65–80% for software, analytics, and digital compliance services; a 200-site customer base could therefore create USD 5–30 million of recurring annual revenue before incident-response fees.
Opportunity Impact Analysis
| Opportunity | (~) % Potential CAGR | Geographic Relevance | Execution Window |
|---|---|---|---|
| Response-intelligence SaaS | +1.0 pp | North America, EU, Gulf, advanced APAC | Short term (≤ 2 years) |
| Regional readiness hubs | +0.9 pp | Red Sea, Africa, South Asia, ASEAN | Medium term (2–4 years) |
| HNS and alternative-fuel response | +0.8 pp | EU ports, Singapore, Japan, Korea, Gulf | Medium term (2–4 years) |
| Restoration-as-a-service | +0.7 pp | North America, EU, Australia, coastal Africa | Long term (≥ 4 years) |
| Autonomous cold-water response | +0.6 pp | Arctic, Canada, Nordic, Great Lakes | Long term (≥ 4 years) |
| Roll-up and asset-light leasing | +0.5 pp | Fragmented global markets | Short term (≤ 2 years) |
Challenges Analysis
Inventory localization imbalance
The industry must balance two conflicting requirements: response assets must be geographically close enough to meet emergency timelines, yet localized booms, skimmers, storage tanks, pumps, spares, and specialist vessels depreciate or require maintenance while often remaining unused. This is an ongoing optimization challenge rather than a restraint because suppliers can still deliver equipment and services, but the network’s cost-to-readiness ratio deteriorates when geopolitical shocks, canal disruptions, customs delays, or extreme weather make centralized stockpiles unreliable.
- UNCTAD reported that ship-transit levels through the Red Sea by early May 2025 were still 70% below the 2023 average, while rerouting around the Cape of Good Hope lifted seaborne trade ton-miles by 5.9% in 2024 and maintained volatile, elevated freight rates through mid-2025; earlier disruption had pushed Shanghai-to-Europe spot freight rates up 256% from early December 2023 levels.
For response companies, this means a stockpile located 2,000–5,000 nautical miles away may be commercially cheaper in peacetime but operationally unusable during a time-critical incident, whereas local redundancy can raise carrying costs by 15–30% and lower apparent asset utilization. Mitigation requires network-design models that target 80–90% of probable incidents with locally available first-tier equipment, shared regional depots for second-tier capability, pre-cleared cross-border customs protocols, and digital visibility across every serialized asset and consumable.
Challenges Impact Analysis
| Challenge | (~) % CAGR Friction | Geographic Relevance | Mitigation Horizon |
|---|---|---|---|
| Multi-agency command coordination | -0.8 pp | Red Sea, ASEAN, Africa, Latin America | Medium term (2–4 years) |
| Response talent renewal gap | -0.7 pp | North America, EU, Gulf, offshore APAC | Long term (≥ 4 years) |
| Remote deployment uncertainty | -0.7 pp | Arctic, deepwater, islands, West Africa | Long term (≥ 4 years) |
| Inventory localization imbalance | -0.6 pp | Red Sea, Europe, APAC corridors | Medium term (2–4 years) |
| Detection-to-decision latency | -0.5 pp | EU, North America, advanced APAC | Medium term (2–4 years) |
| Evolving fuel-risk protocols | -0.4 pp | EU ports, Singapore, Japan, Korea | Long term (≥ 4 years) |
Geopolitical Impact Analysis
Geopolitical tensions increase pressure on oil spill preparedness and emergency response.
Recent geopolitical conflicts have increased the importance of oil spill management by raising risks across global shipping routes, offshore energy infrastructure, and oil transportation networks. Attacks and security concerns in key maritime regions have forced governments and energy companies to strengthen spill prevention and emergency response capabilities.
- According to the International Energy Agency (IEA), an average of 20 million barrels of crude oil and oil products per day moved through the Strait of Hormuz in 2025, representing around 25% of global seaborne oil trade, making any disruption a major environmental and operational concern. At the same time, the International Maritime Organization (IMO) confirmed 46 attacks on international shipping in and around the Strait of Hormuz during the 2026 conflict, highlighting the growing need for rapid spill containment and marine environmental protection in high-risk waters.
The changing geopolitical environment has encouraged governments, port authorities, and oil operators to increase investments in surveillance, emergency response equipment, and coordinated spill response planning. Greater use of satellite monitoring, unmanned systems, and real-time vessel tracking is helping authorities detect incidents more quickly and reduce environmental damage. International cooperation has also become more important as oil tankers continue operating through politically sensitive regions.
Regional Analysis
Regional Analysis: North America.
North America is the leading region in the global oil spill management market, holding a 37.8% market share, valued at USD 60.78 billion. The region’s strong position is supported by extensive offshore drilling activities, heavy tanker traffic, and strict environmental regulations across the United States and Canada. In the United States, the Bureau of Safety and Environmental Enforcement monitors all petroleum spill incidents of one barrel or more from Federal Outer Continental Shelf oil and gas operations and publishes annual regional reports, including data from the Gulf of America and Pacific Region.
- The Oil Spill Liability Trust Fund, managed by the United States Coast Guard’s National Pollution Funds Center under the Oil Pollution Act, provides up to USD 1 billion for a single oil pollution incident, strengthening the country’s emergency response capabilities. The National Response Center also operates around the clock as the federal reporting center for oil spills across the United States and its territories.
In Canada, the National Environmental Emergencies Centre recorded 1,009 marine oil spills in 2024, with 412 incidents, or 40.8%, linked to water transportation activities such as fishing and recreational vessels. Strong federal monitoring systems, mandatory contingency planning, and well-established liability frameworks across both countries continue to support the adoption of advanced spill containment, detection, and cleanup technologies, reinforcing North America’s leadership in the global oil spill management market.
Key Regions and Countries Covered
- North America
- The US
- Canada
- Europe
- Germany
- France
- The UK
- Spain
- Italy
- Russia & CIS
- Rest of Europe
- APAC
- China
- Japan
- South Korea
- India
- ASEAN
- Rest of APAC
- Latin America
- Brazil
- Mexico
- Rest of Latin America
- Middle East & Africa
- GCC
- South Africa
- Rest of MEA
Key Players Analysis
Companies operating in the oil spill management market focus on strengthening response capabilities, expanding service networks, and improving equipment performance to remain competitive. A key priority is continuous innovation in spill detection, containment, and recovery technologies, including advanced booms, skimmers, dispersant application systems, autonomous monitoring platforms, drones, and satellite-based surveillance.
Leading companies such as Ecolab, National Oilwell Varco, Lamor Corporation, Vikoma International, MARKLEEN, SkimOil, Fendercare Marine, OMI Environmental Solutions, CURA Emergency Services, Oil Spill Response Ltd, Osprey Spill Control, Northern Tanker Company, Sapura GE Oil & Gas Services Sdn Bhd, Hyundai Heavy Industries Co., Ltd., and Oil Recovery and Environment Protection continue expanding their global presence through service agreements, technology upgrades, and regional response centers.
Market participants also emphasize workforce training, equipment standardization, preventive maintenance, and integrated emergency planning to improve response quality and meet evolving environmental regulations. Investments in automated recovery systems, environmentally responsible cleanup technologies, and resilient supply chains are helping companies improve operational reliability while supporting faster deployment during spill incidents.
Market Key Players
- Ecolab
- National Oilwell Varco
- Northern Tanker Company
- SkimOil
- Sapura GE Oil & Gas Services SdnBhd
- Hyundai Heavy Industries Co., Ltd
- CURA Emergency Services
- Fendercare Marine
- OMI Environmental Solutions (OMIES)
- Oil Soil Response Ltd
- Vikoma International
- Oil Recovery and Environment Protection
- MARKLEEN
- Lamor Corporation
- Osprey Spill Control (OSC)
Key Development
- In January 2026, Lamor Corporation Plc announced that its joint venture KAK-Lamor agreed with Kuwait Oil Company to extend the Kuwait soil remediation project, originally a five year, 380 million U.S. dollar contract, by up to 18 months, following completion of the designated remediation areas under the United Nations backed Kuwait Environmental Remediation Program.
- In February 2026, Ecolab Inc. announced record fourth quarter and full year 2025 results, reporting fourth quarter sales of 2 billion U.S. dollars, up 5%, and adjusted diluted earnings per share of 2.08 dollars, up 15%, while reaffirming a strong 2026 outlook across its water and industrial technology businesses.
Report Scope
| Report Features | Description |
|---|---|
| Market Value (2025) | USD 160.8 Bn |
| Forecast Revenue (2035) | USD 221.9 Bn |
| CAGR (2026 2035) | 3.3% |
| Base Year for Estimation | 2025 |
| Historic Period | 2020-2024 |
| Forecast Period | 2026-2035 |
| Report Coverage | Revenue Forecast, Market Dynamics, Competitive Landscape, Recent Developments |
| Segments Covered | By Technique (Mechanical Containment and Recovery (Containment Booms (Hard Booms, Fire Booms, Others), Skimmers (Weir Skimmers, Oleophilic Skimmers, Non-Oleophilic Skimmers, Others), Sorbent, Others), Chemical Recovery (Dispersing Agents, Gelling Agents, Others), Biological Recovery, Others), By Type (Pre-Oil Spill (Double-hull, Pipeline Leak Detection, Blow-out Preventers, Others), Post-Oil Spill), By Location (Onshore, Offshore), By End User (Government Agencies, Oil and Gas Companies, Environmental Protection Agencies, Marine Contractors, Others) |
| Regional Analysis | North America The US & Canada; Europe Germany, France, The UK, Spain, Italy, Russia & CIS, Rest of Europe; APAC China, Japan, South Korea, India, ASEAN & Rest of APAC; Latin America Brazil, Mexico & Rest of Latin America; Middle East & Africa GCC, South Africa, & Rest of MEA |
| Competitive Landscape | Ecolab, National Oilwell Varco, Northern Tanker Company, SkimOil, Sapura GE Oil & Gas Services Sdn Bhd, Hyundai Heavy Industries Co., Ltd., CURA Emergency Services, Fendercare Marine, OMI Environmental Solutions (OMIES), Oil Spill Response Ltd., Vikoma International, Oil Recovery and Environment Protection, MARKLEEN, Lamor Corporation, and Osprey Spill Control (OSC) |
| Customization Scope | Customization for segments, region/country level will be provided. Moreover, additional customization can be done based on the requirements. |
| Purchase Options | We have three licenses to opt for: Single User License, Multi User License (Up to 5 Users), Corporate Use License (Unlimited Users and Printable PDF) |





































